Impact of Satellite Constellations on Observations with the 80-cm Telescope and the Mini-SiTian at the Xinglong Observatory, NAOC
Pith reviewed 2026-05-20 01:03 UTC · model grok-4.3
The pith
Satellite trails now appear in twice as many images from the 80-cm telescope as they did in 2019.
A machine-rendered reading of the paper's core claim, the machinery that carries it, and where it could break.
Core claim
By combining WorldWide Telescope simulations with actual 2019 and 2023 observations, the authors show that the fraction of images containing satellite trails doubled from an average of 0.34 percent in 2019 to 0.7 percent in 2023 for the 80-cm telescope; for the Mini-SiTian the fraction rose from 5 percent in January to 12 percent by December 2023, reaching 19 percent in summer. Stratified analysis by solar elevation and local time identifies twilight and summer as the most affected periods. Photometric measurements further indicate that trail interference grows stronger for fainter sources and for objects near the trails, with larger residuals under poor seeing.
What carries the argument
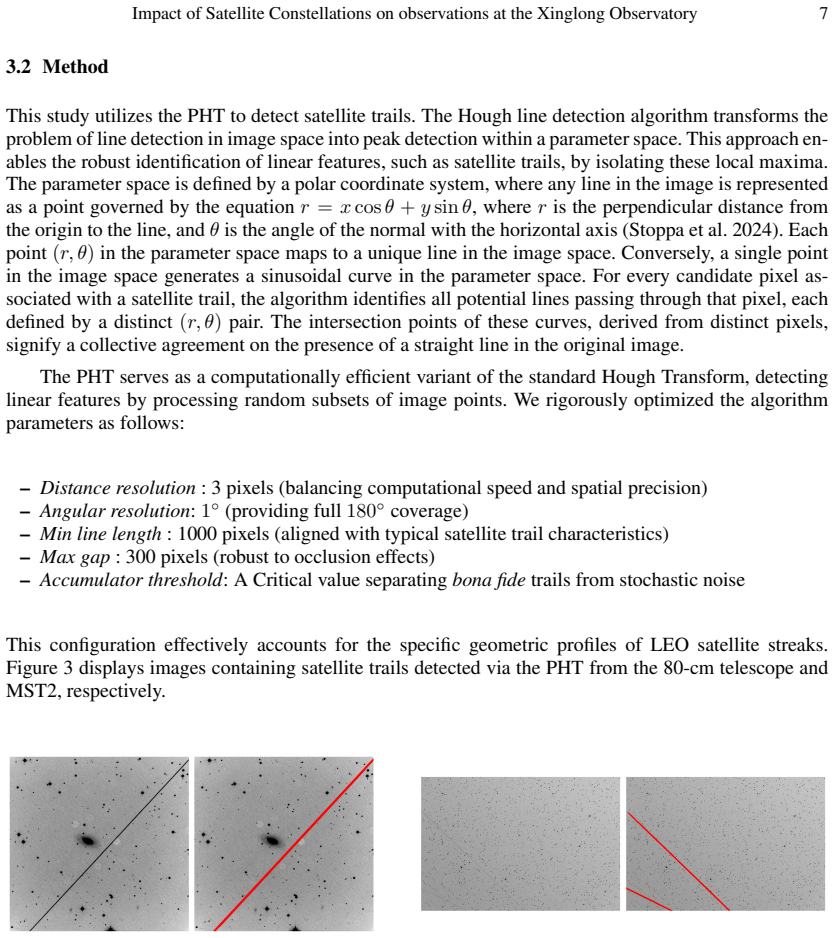
Fraction of images containing satellite trails, measured across years, telescopes, solar elevation, and local time.
If this is right
- Twilight and summer observations suffer the highest rates of satellite-trail contamination.
- Fainter sources and objects close to trails experience stronger photometric interference.
- Poor seeing conditions amplify the size of residuals caused by trails.
- The overall fraction of usable images declines as more satellites are deployed.
Where Pith is reading between the lines
- If the current growth rate continues, summer contamination could routinely exceed 20 percent, forcing surveys to discard or repair a larger share of frames.
- Observatories may need to shift scheduling away from twilight windows or develop automated trail-masking pipelines to preserve data quality.
- The same trend is expected at other mid-latitude sites, suggesting a systemic rather than site-specific issue for optical astronomy.
Load-bearing premise
The observed rise in trail frequency between 2019 and 2023 is driven primarily by increased satellite deployment rather than changes in telescope scheduling, detection thresholds, or data selection criteria across the two epochs.
What would settle it
A repeat of the same analysis on 2024 data from both instruments, with observation schedules and detection thresholds held fixed, would show whether the fraction continues to climb with additional satellite launches.
Figures


read the original abstract
The rapid development of mega-constellations in low Earth orbit (LEO) severely impacts ground-based optical astronomical observations. By combining WorldWide Telescope (WWT) simulations with 2019 and 2023 observational data from the Xinglong Observatory 80-cm telescope and 2023 data from the Mini-SiTian (MST), we find that satellite visibility increases with deployment, particularly during the summer. For the 80-cm telescope, the fraction of images containing satellite trails increased from an average of 0.34% in 2019 to 0.7% in 2023; meanwhile, for the MST in 2023, the fraction rose from 5% in January to 12% by December, peaking at 19% in the summer. Through stratified analysis of solar elevation and local time, we find that observations during twilight and summer are particularly susceptible to satellite trail interference. Photometric analysis reveals that the interference intensity increases for fainter sources and those closer to the trails. Furthermore, a comparative analysis across different seeing conditions shows that the deviation of median standardized residuals ({\sigma}) is significantly greater under poor seeing than under good seeing conditions.
Editorial analysis
A structured set of objections, weighed in public.
Referee Report
Summary. The paper reports an empirical analysis of satellite trail interference in observations from the 80-cm telescope at Xinglong Observatory, comparing 2019 and 2023 data, and 2023 data from the Mini-SiTian (MST). Combining WorldWide Telescope simulations with real observations, it finds the fraction of images containing trails rose from 0.34% (2019) to 0.7% (2023) for the 80-cm telescope; for MST in 2023 the fraction increased from 5% in January to 12% by December, peaking at 19% in summer. Stratified analyses by solar elevation, local time, seeing, and source brightness near trails are presented, along with photometric impact assessments.
Significance. If the 2019–2023 samples prove comparable after accounting for observational metadata, the work supplies site-specific, quantitative evidence of rising LEO satellite interference that is directly useful for scheduling and data-quality assessment at similar facilities. The combination of archival/new observations with simulations and the identification of vulnerable conditions (twilight, summer, poor seeing) constitute a practical contribution to the satellite-impact literature.
major comments (2)
- [80-cm telescope 2019–2023 comparison] The central claim attributes the doubling of trail incidence (0.34% → 0.7%) primarily to increased satellite numbers. This requires the 2019 and 2023 image samples to be comparable in total exposure time, field selection, limiting magnitude, and trail-detection pipeline. The manuscript reports stratified analysis by solar elevation and local time but does not present a direct comparison of the underlying observational metadata (e.g., distribution of exposure durations, filter choices, or pointing cadences) or a matched-subsample re-analysis.
- [MST 2023 seasonal analysis] For the MST 2023 data, the reported rise from 5% in January to 12% by December (peaking at 19% in summer) is presented without an accompanying table or figure showing the monthly distribution of exposure parameters or detection thresholds. If observing cadence or sensitivity changed systematically through the year, the seasonal trend could be partly methodological.
minor comments (2)
- [Photometric and seeing analysis] The abstract and text refer to 'deviation of median standardized residuals (σ)' under different seeing conditions; the precise definition of σ and the standardization procedure should be stated explicitly, preferably with an equation or short methods paragraph.
- Error bars or bootstrap uncertainties on the reported trail fractions (0.34%, 0.7%, 5%, 12%, 19%) would allow readers to judge whether the observed increases exceed statistical fluctuations.
Simulated Author's Rebuttal
We thank the referee for the constructive and detailed comments, which have helped us improve the clarity and robustness of our analysis. We address each major comment below and have incorporated additional comparisons and figures in the revised manuscript to strengthen the evidence for our conclusions.
read point-by-point responses
-
Referee: [80-cm telescope 2019–2023 comparison] The central claim attributes the doubling of trail incidence (0.34% → 0.7%) primarily to increased satellite numbers. This requires the 2019 and 2023 image samples to be comparable in total exposure time, field selection, limiting magnitude, and trail-detection pipeline. The manuscript reports stratified analysis by solar elevation and local time but does not present a direct comparison of the underlying observational metadata (e.g., distribution of exposure durations, filter choices, or pointing cadences) or a matched-subsample re-analysis.
Authors: We agree that demonstrating comparability of the 2019 and 2023 samples is essential to attribute the observed increase in trail incidence to the growth in satellite numbers. Although the original manuscript included stratified analyses by solar elevation and local time, we acknowledge that explicit metadata comparisons were not provided. In the revised version, we have added a new supplementary table that directly compares the distributions of exposure durations, filter choices, pointing cadences, total exposure time, and limiting magnitudes between the two epochs. We have also performed a matched-subsample re-analysis restricted to observations with closely matched metadata parameters; the doubling of the trail fraction persists in this controlled subset. These additions confirm that differences in observing strategy do not explain the trend. revision: yes
-
Referee: [MST 2023 seasonal analysis] For the MST 2023 data, the reported rise from 5% in January to 12% by December (peaking at 19% in summer) is presented without an accompanying table or figure showing the monthly distribution of exposure parameters or detection thresholds. If observing cadence or sensitivity changed systematically through the year, the seasonal trend could be partly methodological.
Authors: We appreciate the referee's caution regarding possible methodological contributions to the seasonal trend. To address this, the revised manuscript now includes a new figure that presents the monthly distributions of exposure times, average seeing, and detection thresholds for the MST dataset throughout 2023. The figure demonstrates that variations in these parameters are modest and do not correlate with the observed peak in trail fraction during summer months. We have also added text clarifying that the trail-detection pipeline and sensitivity settings remained uniform across the year. The seasonal pattern is therefore attributable to changes in satellite visibility rather than observational biases. revision: yes
Circularity Check
No circularity: purely empirical comparison of observed trail fractions against external simulations
full rationale
The manuscript reports direct observational statistics (trail fractions 0.34% in 2019 vs 0.7% in 2023 for the 80-cm telescope; 5% to 12% for MST) drawn from archival and new image sets, stratified by solar elevation and local time. These fractions are measured quantities, not outputs of any fitted model or equation that reduces back to the same data by construction. Simulations from WorldWide Telescope are used only for contextual comparison and do not enter any derivation chain that predicts the reported fractions. No self-citations, ansatzes, or uniqueness theorems are invoked to justify the central claims. The analysis is therefore self-contained against external benchmarks and contains no load-bearing step that collapses to its own inputs.
Axiom & Free-Parameter Ledger
axioms (1)
- domain assumption The increase in satellite trail frequency between 2019 and 2023 is driven primarily by the deployment of LEO mega-constellations.
Reference graph
Works this paper leans on
-
[1]
C., Venkatesan, A., Heim, J., et al
Barentine, J. C., Venkatesan, A., Heim, J., et al. 2023, Nature Astronomy, 7, 252 1
work page 2023
-
[2]
2022, Astronomy & Astrophysics, 657, A75 2
Bassa, C., Hainaut, O., & Galad´ı-Enr´ıquez, D. 2022, Astronomy & Astrophysics, 657, A75 2
work page 2022
-
[3]
2022, Astronomy and Computing, 41, 100652 3, 4
Cui, Z., & Xu, Y . 2022, Astronomy and Computing, 41, 100652 3, 4
work page 2022
-
[4]
2016, Publications of the Astronomical Society of the Pacific, 128 4
Fan, Z., Wang, H., Jiang, X., et al. 2016, Publications of the Astronomical Society of the Pacific, 128 4
work page 2016
-
[5]
2020, arXiv preprint arXiv:2003.05472 2
Gallozzi, S., Paris, D., Scardia, M., & Dubois, D. 2020, arXiv preprint arXiv:2003.05472 2
-
[6]
2022, Monthly Notices of the Royal Astronomical Society, 516, 1502 2, 3, 11
Halferty, G., Reddy, V ., Campbell, T., Battle, A., & Furfaro, R. 2022, Monthly Notices of the Royal Astronomical Society, 516, 1502 2, 3, 11
work page 2022
-
[7]
2025, Research in Astronomy and Astrophysics, 25, 044005 6
He, M., Wu, H., Ge, L., et al. 2025, Research in Astronomy and Astrophysics, 25, 044005 6
work page 2025
-
[8]
2020, The Astrophysical Journal, 905, 3 3
Horiuchi, T., Hanayama, H., & Ohishi, M. 2020, The Astrophysical Journal, 905, 3 3
work page 2020
-
[9]
2025, Research in Astronomy and Astrophysics, 25, 044001 6
Huang, Y ., Liu, J., Wu, H., et al. 2025, Research in Astronomy and Astrophysics, 25, 044001 6
work page 2025
-
[10]
Krantz, H., Pearce, E. C., & Block, A. 2021, arXiv preprint arXiv:2110.10578 2, 11, 15
-
[11]
2023, Nature Astronomy, 7, 262 2
Kruk, S., Garc´ıa-Mart´ın, P., Popescu, M., et al. 2023, Nature Astronomy, 7, 262 2
work page 2023
-
[12]
Lawler, S. M., Boley, A. C., & Rein, H. 2021, The Astronomical Journal, 163, 21 2
work page 2021
-
[13]
2021, Anais da Academia Brasileira de Ciˆencias, 93, e20200628 6, 17
Liu, J., Soria, R., Wu, X.-F., Wu, H., & Shang, Z. 2021, Anais da Academia Brasileira de Ciˆencias, 93, e20200628 6, 17
work page 2021
-
[14]
Mallama, A., Cole, R. E., Harrington, S., et al. 2023a, arXiv preprint arXiv:2306.06657 16
- [15]
-
[16]
McDowell, J. C. 2020, The Astrophysical Journal Letters, 892, L36 2, 10 Mr´oz, P., Otarola, A., Prince, T. A., et al. 2022, The Astrophysical Journal, 924 2, 15
work page 2020
-
[17]
Muirhead, I. J., Crisp, N. H., McGrath, C. N., & Roberts, P. C. 2025, The Astronomical Journal, 170, 215 2 18 Jing Ren et al
work page 2025
- [18]
-
[19]
2024, Astronomy & Astrophysics, 692, A199 7
Stoppa, F., Groot, P., Stuik, R., et al. 2024, Astronomy & Astrophysics, 692, A199 7
work page 2024
-
[20]
2020, Astronomy & Astrophysics, 637, L1 3
Tregloan-Reed, J., Otarola, A., Ortiz, E., et al. 2020, Astronomy & Astrophysics, 637, L1 3
work page 2020
-
[21]
A., Ivezi´c, ˇZ., Bradshaw, A., et al
Tyson, J. A., Ivezi´c, ˇZ., Bradshaw, A., et al. 2020, The Astronomical Journal, 160, 226 2
work page 2020
-
[22]
2020, Bulletin of the American Astronomical Society, 52 2, 15
Walker, C., Hall, J., Allen, L., et al. 2020, Bulletin of the American Astronomical Society, 52 2, 15
work page 2020
-
[23]
2020, Astronomy and Computing, 31, 100380 3
Xu, Y ., Cui, C., Fan, D., et al. 2020, Astronomy and Computing, 31, 100380 3
work page 2020
-
[24]
2025, Research in Astronomy and Astrophysics, 25, 044003 6
Zhang, Y ., Du, L., Hu, Y ., et al. 2025, Research in Astronomy and Astrophysics, 25, 044003 6
work page 2025
-
[25]
2024, Monthly Notices of the Royal Astronomical Society, 530, 5006 2, 15
Zhi, H., Jiang, X., & Wang, J. 2024, Monthly Notices of the Royal Astronomical Society, 530, 5006 2, 15
work page 2024
discussion (0)
Sign in with ORCID, Apple, or X to comment. Anyone can read and Pith papers without signing in.