REVIEW 4 major objections 4 minor 68 references
An Incremental Multi-Level, Multi-Scale Approach to Assessment of Multifidelity HPC Systems
T0 review · 4 major / 4 minor · reviewed 2026-08-10 · deepseek-v4-flash
Pith's one-line read Incremental multiresolution DMD (I-mrDMD) updates supercomputer log analysis in 15–30 seconds instead of 60–80 seconds, making online monitoring practical.
desk verdict Real speedups from incrementally updating level-1 SVD of mrDMD, but the streaming-accuracy claim is unverified because levels 2-L stay stale and the head-to-head comparison against batch mrDMD is missing. read the letter →
The pith
A machine-rendered reading of the paper's core claim, the machinery that carries it, and where it could break.
The reading
What carries the argument
I-mrDMD is the machinery that carries the argument. It combines multiresolution dynamic mode decomposition (mrDMD)—which recursively subtracts slower-frequency modes from time-series data at each of several scales—with an incremental singular value decomposition update at level 1, so newly arriving time steps extend the existing SVD instead of triggering a complete recomputation. The updated level-1 modes are used to reconstruct and subtract the slow dynamics; the residual is then split and processed at finer levels exactly as in the ordinary mrDMD. Mode power and frequency come from the DMD eigenvalues, and z-scores computed against a baseline set of modes flag nodes whose behavior deviates from normal. The authors note that updates to levels 2 through L are left for future work, and they treat the level-1 update as the main computational saving.
What would settle it
Run I-mrDMD on a year of streaming sensor data, and after each update recompute the full mrDMD from scratch and compare the two reconstructions. If the Frobenius-norm difference grows with each update rather than staying bounded—or the z-score baselines drift enough to change which nodes are flagged—the claim that the partial update stays faithful over long streams is refuted.
Extended reading notes
Core claim
The paper's central claim is that the multiresolution dynamic mode decomposition (mrDMD), which converts high-dimensional time series into spatiotemporal modes at multiple frequency scales, can be made incremental with little loss of fidelity, enabling online analysis of high-velocity sensor streams. The proposed I-mrDMD algorithm updates the singular value decomposition at the first (slowest) level of the mrDMD hierarchy using an incremental SVD step, recomputes the DMD modes for that level, and then carries the reconstructed slow dynamics through the remaining levels as in ordinary mrDMD. The authors report that on Theta environment logs (4,392 nodes, 50,000 time points), adding 5,000 new time points takes 14.7 seconds rather than 80.6 seconds for a full recalculation; on Polaris GPU temperature data, the update takes 29.9 seconds versus 59.3 seconds. Reconstruction quality, measured by the Frobenius norm of the difference between actual and reconstructed data, is roughly 3,400–3,960 in the two case studies, which the authors present as evidence that the incremental modes capture the underlying system dynamics. They further claim that z-scores of mode-power deviations from baselines separate normal from anomalous node behavior and align with events in the hardware and job logs.
Load-bearing premise
The load-bearing premise is that updating only the first (slowest) level of the multiresolution decomposition, while leaving the finer levels' modes unchanged, still gives a faithful picture of the system, even though the paper's own measurements show small reconstruction errors (10–5,000 per update) that can accumulate over months or years of streaming.
Editorial extensions
If this is right
- Update time drops below the sensor sampling interval, so I-mrDMD can keep pace with streaming data from current supercomputers that sample at 0.03–10 Hz.
- The decomposition compresses terabytes of environment logs into a small set of spatiotemporal modes, shrinking the data to a size that can be inspected and visualized interactively.
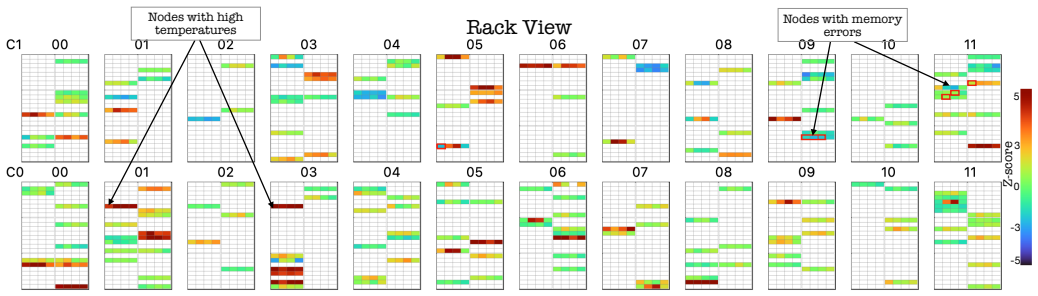
- Per-node z-scores against baselines give operators a direct visual signal for overheating nodes, idle nodes, and nodes with persistent hardware errors, aligned across environment, hardware, and job logs.
- Because the mode update is data-driven and the rack visualization is parameterized by a layout string, the same pipeline transfers to other large-scale systems without retraining.
- The reported reconstruction error grows by roughly 10–5,000 per update, so for streams of weeks or months the incremental result is accurate; for multi-year streams the paper notes error may accumulate and require asynchronous full recomputation.
Reading between the lines
- Extending the incremental SVD update to the deeper mrDMD levels, which the paper calls embarrassingly parallel, would remove the remaining error accumulation and is a natural next step beyond the paper's level-1-only update.
- The 10–5,000 per-update error growth implies an operator could schedule a full recomputation before error crosses a chosen threshold; the paper does not derive such a schedule, but its measurements are enough to build one.
- The cleaner separation of baseline from non-baseline readings that the authors observe for mrDMD and I-mrDMD, compared with PCA, UMAP, and t-SNE, suggests the multiresolution frequency decomposition itself—not just the speedup—is what makes the anomaly signal clear; this could be probed on other high-velocity multivariate streams.
Editorial analysis
A structured set of objections, weighed in public.
Referee Report
Summary. The paper presents I-mrDMD, an incremental version of multiresolution dynamic mode decomposition, with the stated goal of enabling fast, accurate analysis of streaming time-series data from HPC system logs. The authors integrate an incremental SVD update at the first mrDMD level, report wall-clock timings for appending new time points on Theta environment logs and Polaris GPU temperature data, and combine the resulting modes with z-score baselines and a D3-based rack visualization to align environment-, job-, and hardware-log behavior in two case studies. The manuscript explicitly states that updates to mrDMD levels 2 through L are left to future work, and it reports reconstruction errors only as absolute Frobenius norms without a batch mrDMD baseline.
Significance. If the central claim holds, an incremental mrDMD that can refresh a multiresolution decomposition quickly enough for streaming sensor data would be practically valuable for HPC monitoring, where environment logs accumulate terabytes per day. The paper's strengths include the use of real-world supercomputer datasets, concrete wall-clock measurements averaged over 10 runs, a public code repository, and an explicit discussion of the algorithm's current limitations. However, the load-bearing assertions about fidelity and about correlation with hardware/job events are not quantitatively established: the implementation updates only the level-1 SVD, and the reported accuracy measures are not compared with batch mrDMD on the same data. The paper is therefore a promising proof-of-concept whose central streaming-accuracy claim needs additional verification before publication.
major comments (4)
- [III-A1 and Algorithm 1] The central claim of an incremental mrDMD is only partially implemented: the incremental SVD update is applied to level 1 only, and the text explicitly defers updates to levels 2 through L to future work (Section III-A1: "we leave this step for future work"; Section VI: "left as a part of future work"). For each appended block T1, the residual after subtracting the newly updated level-1 slow modes is not decomposed into higher-level frequency bands, so the high-frequency content of the appended segment is absent from the updated representation unless the old higher-level modes happen to capture it. Because Q1 and Q2 are about the fidelity of the online decomposition, the manuscript needs a head-to-head accuracy comparison between I-mrDMD and batch mrDMD on the same T+T1 data, including reconstruction norms and mode-level differences, and at least one multi-step update experiment to show how error accumulates over repeated appends.
- [Section V and III-A1] The quantitative support for accuracy is incomplete. The Frobenius norms reported in Section V (3958.58 and 3423.847) are absolute residuals between the actual and I-mrDMD-reconstructed data, but they are not compared with the corresponding batch mrDMD residual on the same data, nor with the norm of the data itself, so they do not by themselves establish that the incremental result is accurate. Likewise, the assertion in Section III-A1 that the reconstruction difference increases "only by a sum of 10-5000" per update is not accompanied by an experiment, a table, or a description of how this quantity was measured, for which dataset, or over how many updates. Please provide this comparison to answer Q2 quantitatively.
- [Section V, Case Studies 1 and 2] The claimed correlation between environment-log patterns and hardware/job failures is supported only by visual inspection of rack views (Figs. 4 and 6). No quantitative measure is reported linking z-scores or mode amplitudes to memory errors or job failures; the baselines and z-score thresholds are manually selected (e.g., 46-57 °C in Case Study 1 and different ranges in Case Study 2). To support Q3, report a quantitative association (e.g., precision/recall, a confusion matrix, or a correlation coefficient) between anomalous z-scores and recorded hardware or job events, and address sensitivity to the chosen baselines and thresholds.
- [Section IV] The performance comparisons (14.728 s vs 80.580 s; 29.945 s vs 59.263 s; Table I) are for the partial update that skips levels 2-L. Since the paper states that updating levels 2 through L is future work, the reported speedups are for only a subset of the full mrDMD update. If the full update is intended to run online, the paper should either implement and time it, or state clearly that the speedup applies only to the level-1 refresh and that the remaining levels are updated asynchronously with unknown latency.
minor comments (4)
- [Section III-A, Eqs. (2)-(6)] The notation is inconsistent: the conjugate transpose is written as V' in Eq. (2) but the text says the symbol is the conjugate transpose, and Eq. (6) uses aaa and ai(0) without defining how the initial amplitudes are computed. Please make the notation consistent and add a sentence defining the amplitudes.
- [Section III-B] The alignment specification text says the row and column alignment takes numbers "-1, 1, 2" for right-to-left, left-to-right, and bottom-to-top, but then lists "2 for bottom-to-top" after already including 2; this appears to be a typo and the mapping from numbers to alignments should be clarified.
- [References] Reference [51] is labeled as the Theta supercomputer but the URL points to the Polaris page at Argonne; either the reference or the URL is incorrect and should be fixed.
- [Algorithm 1] Algorithm 1, line 8, uses "node level" where the intended variable is likely "level," and the loop "for previous nodes = 1,2,...L" is unclear; please rewrite the pseudocode to match the level notation used in the text.
Circularity Check
No circular derivation found: I-mrDMD is a direct application of the external incremental SVD of [46] to level 1 of mrDMD, and the speedup and reconstruction claims are measured rather than fitted. Minor inherited self-citations keep the score at 2, but no prediction reduces to its input.
full rationale
The central derivation is not circular. I-mrDMD is defined in Algorithm 1 as standard mrDMD with the level-1 SVD replaced by the spatially parallel/temporal serial incremental SVD of Kühl et al. [46], an external algorithm; the remaining steps (extract slower modes, reconstruct, subtract, split, repeat) are the standard mrDMD recursion from [33]. The speedup claims are wall-clock measurements (14.728 s vs 80.580 s for the environment-log update and 29.945 s vs 59.263 s for the GPU-metrics update), which are externally defined and are not fitted or derived from the algorithm's assumptions. The reconstruction norms (3958.58 and 3423.847) are in-sample Frobenius norms of the residual between the data and the modal reconstruction; they are not predictions, so they cannot be forced by construction, although they also do not by themselves establish predictive fidelity. The paper explicitly acknowledges that updates to mrDMD levels 2-L are deferred to future work (Section III-A1 and Section VI) and that the resulting error 'can accumulate for data processed for multiple months to years'; this is an admitted external-validity limitation, not a circular step, and it should be weighed as a completeness gap for Q2 rather than as circularity. The remaining circularity-adjacent element is the sampling-rate rule imported from the authors' own prior work [2],[3] ('We follow the choice of sampling rate from the previous work using mrDMD on the supercomputer logs [2], [3], which set the sampling rate to four times the Nyquist limit to capture cycles [50]'). That is a parameter choice with an external Nyquist citation and is not the load-bearing derivation of the speedup or mode-extraction result. No fitted parameter is renamed as a prediction, no uniqueness theorem is imported, and no known result is merely renamed. The appropriate finding is a minor self-citation score of 2, not a circularity finding.
Assumptions & free parameters
free parameters (6)
- max_levels =
8 (environment), 9 (GPU), 6-7 (case studies), 4 (comparison)
- baseline temperature ranges =
46-57 C (case 1), 45-60 C (case 2a), 30-45 C (case 2b)
- z-score thresholds =
±1.5 for near-baseline, >2 for high
- frequency range for mode selection =
0-60 Hz (case 1), 0-100 Hz (case 2)
- sampling rate multiplier =
4x Nyquist
- SVD rank r =
determined by SVHT
assumptions (8)
- domain assumption Environment log sensor readings are generated by dynamics that mrDMD can meaningfully decompose into slow and fast modes.
- domain assumption Temperature patterns extracted by mrDMD and converted to z-scores correlate with hardware faults and job failures.
- domain assumption Incremental SVD with rank-q truncation preserves enough accuracy to make updated DMD modes reliable.
- ad hoc to paper Leaving mrDMD levels 2-L unupdated while updating level 1 still yields a faithful representation of the system.
- domain assumption Sampling at four times the Nyquist limit is sufficient to capture relevant cycles.
- ad hoc to paper Manually chosen baselines represent normal system behavior.
- standard math Standard properties of SVD, Moore-Penrose pseudoinverse, and eigendecomposition underlying DMD hold.
- standard math SVHT gives the optimal rank threshold for the SVD truncation.
Cite this review
Pith. "Pith review of An Incremental Multi-Level, Multi-Scale Approach to Assessment of Multifidelity HPC Systems." pith.science (2026). https://pith.science/paper/CIJSWIQV
@misc{pith2026250117796,
  author       = {Pith},
  title        = {Pith review of: An Incremental Multi-Level, Multi-Scale Approach to Assessment of Multifidelity HPC Systems},
  year         = {2026},
  howpublished = {\url{https://pith.science/paper/CIJSWIQV}},
  note         = {Machine review of arXiv:2501.17796}
}
read the original abstract
With the growing complexity in architecture and the size of large-scale computing systems, monitoring and analyzing system behavior and events has become daunting. Monitoring data amounting to terabytes per day are collected by sensors housed in these massive systems at multiple fidelity levels and varying temporal resolutions. In this work, we develop an incremental version of multiresolution dynamic mode decomposition (mrDMD), which converts high-dimensional data to spatial-temporal patterns at varied frequency ranges. Our incremental implementation of the mrDMD algorithm (I-mrDMD) promptly reveals valuable information in the massive environment log dataset, which is then visually aligned with the processed hardware and job log datasets through our generalizable rack visualization using D3 visualization integrated into the Jupyter Notebook interface. We demonstrate the efficacy of our approach with two use scenarios on a real-world dataset from a Cray XC40 supercomputer, Theta.
Figures


Figures from the paper (6 more)


Reference graph
Works this paper leans on
-
[38]
J. Gonzales, H. Sakaue, and A. Jemcov, “Novel windowed multi- resolution dynamic mode decomposition (wmrdmd): Application to unsteady surface pressure over a wing in flutter,” Aerospace Science and Technology , vol. 127, p. 107718, 2022. [Online]. Available: https://www.sciencedirect.com/science/article/pii/S1270963822003923
work page 2022
-
[1]
B. W. Brunton, L. A. Johnson, J. G. Ojemann, and J. N. Kutz, “Extracting spatial–temporal coherent patterns in large-scale neural recordings using dynamic mode decomposition,” Journal of Neuroscience Methods , vol. 258, pp. 1–15, 2016. [Online]. Available: https://www.sciencedirect.com/science/article/pii/S0165027015003829
work page 2016
-
[2]
A Multi-Level, Multi-Scale Visual Analytics Approach to Assessment of Multifidelity HPC Systems
Shilpika, B. Lusch, M. Emani, F. Simini, V . Vishwanath, M. E. Papka, and K.-L. Ma, “A multi-level, multi-scale visual analytics approach to assessment of multifidelity hpc systems,” 2023. [Online]. Available: https://arxiv.org/abs/2306.09457
work page Pith review arXiv 2023
-
[3]
F. Shilpika, “A visual analytics exploratory and predictive framework for anomaly detection in multi-fidelity machine log data,” Ph.D. dissertation, UC Davis, 2023
work page 2023
-
[4]
M. Bostock, V . Ogievetsky, and J. Heer, “D3 data-driven documents,” IEEE Transactions on Visualization and Computer Graphics , vol. 17, no. 12, p. 2301–2309, dec 2011. [Online]. Available: https://doi.org/10. 1109/TVCG.2011.185
work page 2011
-
[5]
Jupyter: Thinking and storytelling with code and data,
B. E. Granger and F. P ´erez, “Jupyter: Thinking and storytelling with code and data,” Computing in Science & Engineering , vol. 23, no. 2, pp. 7–14, 2021
work page 2021
-
[6]
A systematic literature review on automated log abstraction techniques,
D. El-Masri, F. Petrillo, Y .-G. Gu ´eh´eneuc, A. Hamou-Lhadj, and A. Bouziane, “A systematic literature review on automated log abstraction techniques,” Information and Software Technology, vol. 122, p. 106276, 2020. [Online]. Available: https://www.sciencedirect.com/ science/article/pii/S0950584920300264
work page 2020
-
[7]
A survey on automated log analysis for reliability engineering,
S. He, P. He, Z. Chen, T. Yang, Y . Su, and M. R. Lyu, “A survey on automated log analysis for reliability engineering,” ACM Comput. Surv. , vol. 54, no. 6, jul 2021. [Online]. Available: https://doi.org/10.1145/3460345
doi:10.1145/3460345 2021
Show all 68 references
-
[8]
Operational-log analysis for big data systems: Challenges and solu- tions,
A. Miranskyy, A. Hamou-Lhadj, E. Cialini, and A. Larsson, “Operational-log analysis for big data systems: Challenges and solu- tions,” IEEE Software, vol. 33, no. 02, pp. 52–59, mar 2016
2016
-
[9]
A survey of online failure prediction methods,
F. Salfner, M. Lenk, and M. Malek, “A survey of online failure prediction methods,” ACM Comput. Surv. , vol. 42, no. 3, Mar. 2010. [Online]. Available: https://doi.org/10.1145/1670679.1670680
2010
-
[10]
Predicting faults in high performance computing systems: An in-depth survey of the state-of-the-practice,
D. Jauk, D. Yang, and M. Schulz, “Predicting faults in high performance computing systems: An in-depth survey of the state-of-the-practice,” in Proceedings of the International Conference for High Performance Computing, Networking, Storage and Analysis , ser. SC ’19. New York,...
2019
-
[11]
Loggan: a log-level generative adversarial network for anomaly detection using permutation event modeling,
B. Xia, Y . Bai, J. Yin, Y . Li, and J. Xu, “Loggan: a log-level generative adversarial network for anomaly detection using permutation event modeling,” Information Systems Frontiers, vol. 23, no. 2, p. 285–298, apr
-
[12]
Detecting anomaly in big data system logs using convolutional neural network,
S. Lu, X. Wei, Y . Li, and L. Wang, “Detecting anomaly in big data system logs using convolutional neural network,” in 2018 IEEE 16th Intl Conf on Dependable, Autonomic and Secure Computing, 16th Intl Conf on Pervasive Intelligence and Computing, 4th Intl Conf on Big Data Inte...
2018
-
[13]
Logbert: Log anomaly detection via bert,
H. Guo, S. Yuan, and X. Wu, “Logbert: Log anomaly detection via bert,” 2021. [Online]. Available: https://arxiv.org/abs/2103.04475
2021 arXiv
-
[14]
A visual analytics system for optimizing the performance of large-scale networks in supercomputing systems,
T. Fujiwara, J. K. Li, M. Mubarak, C. Ross, C. D. Carothers, R. B. Ross, and K.-L. Ma, “A visual analytics system for optimizing the performance of large-scale networks in supercomputing systems,” Visual Informatics , vol. 2, no. 1, pp. 98–110, 2018, proceedings of PacificV AS...
2018
-
[15]
Visual analytics techniques for exploring the design space of large- scale high-radix networks,
J. K. Li, M. Mubarak, R. B. Ross, C. D. Carothers, and K.-L. Ma, “Visual analytics techniques for exploring the design space of large- scale high-radix networks,” in 2017 IEEE International Conference on Cluster Computing (CLUSTER) , 2017, pp. 193–203
2017
-
[16]
Mela: A visual analytics tool for studying multifidelity HPC system logs,
F. Shilpika, B. Lusch, M. Emani, V . Vishwanath, M. E. Papka, and K.-L. Ma, “Mela: A visual analytics tool for studying multifidelity HPC system logs,” in 2019 IEEE/ACM Industry/University Joint International Workshop on Data-center Automation, Analytics, and Control (DAAC) , ...
2019
-
[17]
Toward an in-depth analysis of multifidelity high performance computing systems,
S. Shilpika, B. Lusch, M. Emani, F. Simini, V . Vishwanath, M. E. Papka, and K.-L. Ma, “Toward an in-depth analysis of multifidelity high performance computing systems,” in 2022 22nd IEEE International Symposium on Cluster, Cloud and Internet Computing (CCGrid) , 2022, pp. 716–725
2022
-
[18]
A visual analytics system for optimizing communications in massively parallel applications,
T. Fujiwara, P. Malakar, K. Reda, V . Vishwanath, M. E. Papka, and K.-L. Ma, “A visual analytics system for optimizing communications in massively parallel applications,” in 2017 IEEE Conference on Visual Analytics Science and Technology (VAST) , 2017, pp. 59–70
2017
-
[19]
An intelligent anomaly detection scheme for micro-services architectures with temporal and spatial data analysis,
Y . Zuo, Y . Wu, G. Min, C. Huang, and K. Pei, “An intelligent anomaly detection scheme for micro-services architectures with temporal and spatial data analysis,” IEEE Transactions on Cognitive Communications and Networking, vol. 6, no. 2, pp. 548–561, 2020
2020
-
[20]
A visual analytics approach for hardware system monitoring with streaming func- tional data analysis,
Shilpika, T. Fujiwara, N. Sakamoto, J. Nonaka, and K.-L. Ma, “A visual analytics approach for hardware system monitoring with streaming func- tional data analysis,” IEEE Transactions on Visualization and Computer Graphics, vol. 28, no. 6, pp. 2338–2349, 2022
2022
-
[21]
Using text visualization to aid analysis of machine maintenance logs
M. Brundage, S. Chandrasegaran, X. Zhang, and K.-L. Ma, “Using text visualization to aid analysis of machine maintenance logs.” Proceedings of the 11th Model-Based Enterprise Summit, Gaithersburg, MD, 2020-04-30 2020. [Online]. Available: https: //tsapps.nist.gov/publication/g...
2020
-
[22]
Conceptscope: Organizing and visualizing knowledge in documents based on domain ontology,
X. Zhang, S. Chandrasegaran, and K.-L. Ma, “Conceptscope: Organizing and visualizing knowledge in documents based on domain ontology,” in Proceedings of the 2021 CHI Conference on Human Factors in Computing Systems , ser. CHI ’21. New York, NY , USA: Association for Computing ...
2021
-
[23]
Logaider: A tool for mining potential correlations of HPC log events,
S. Di, R. Gupta, M. Snir, E. Pershey, and F. Cappello, “Logaider: A tool for mining potential correlations of HPC log events,” in Proceedings of the 17th IEEE/ACM International Symposium on Cluster, Cloud and Grid Computing , ser. CCGrid ’17. IEEE Press, 2017, p. 442–451. [Onl...
2017 doi
-
[24]
System log pre-processing to improve failure prediction,
Z. Zheng, Z. Lan, B.-H. Park, and A. Geist, “System log pre-processing to improve failure prediction,”2009 IEEE/IFIP International Conference on Dependable Systems & Networks , pp. 572–577, 2009
2009
-
[25]
Event log mining tool for large scale HPC systems,
A. Gainaru, F. Cappello, S. Trausan-Matu, and B. Kramer, “Event log mining tool for large scale HPC systems,” in Proceedings of the 17th International Conference on Parallel Processing - Volume Part I , ser. Euro-Par’11. Berlin, Heidelberg: Springer-Verlag, 2011, p. 52–64
2011
-
[26]
Logdiver: A tool for measuring resilience of extreme-scale systems and applications,
C. D. Martino, S. Jha, W. Kramer, Z. Kalbarczyk, and R. K. Iyer, “Logdiver: A tool for measuring resilience of extreme-scale systems and applications,” in Proceedings of the 5th Workshop on Fault Tolerance for HPC at EXtreme Scale , ser. FTXS ’15. New York, NY , USA: Associati...
2015
-
[27]
Logmine: Fast pattern recognition for log analytics,
H. Hamooni, B. Debnath, J. Xu, H. Zhang, G. Jiang, and A. Mueen, “Logmine: Fast pattern recognition for log analytics,” in Proceedings of the 25th ACM International on Conference on Information and Knowledge Management , ser. CIKM ’16. New York, NY , USA: Association for Compu...
2016
-
[28]
Aarohi: Making real-time node failure prediction feasible,
A. Das, F. Mueller, and B. Rountree, “Aarohi: Making real-time node failure prediction feasible,” in 2020 IEEE International Parallel and Distributed Processing Symposium (IPDPS) , 2020, pp. 1092–1101
2020
-
[29]
Padla: A dynamic log level adapter using online phase detection,
T. Mizouchi, K. Shimari, T. Ishio, and K. Inoue, “Padla: A dynamic log level adapter using online phase detection,” in 2019 IEEE/ACM 27th International Conference on Program Comprehension (ICPC), 2019, pp. 135–138
2019
-
[30]
Extracting the textual and temporal structure of supercomputing logs,
S. Jain, I. Singh, A. Chandra, Z.-L. Zhang, and G. Bronevetsky, “Extracting the textual and temporal structure of supercomputing logs,” in 2009 International Conference on High Performance Computing (HiPC), 2009, pp. 254–263
2009
-
[31]
Mining historical issue repositories to heal large-scale online service systems,
R. Ding, Q. Fu, J. G. Lou, Q. Lin, D. Zhang, and T. Xie, “Mining historical issue repositories to heal large-scale online service systems,” in 2014 44th Annual IEEE/IFIP International Conference on Dependable Systems and Networks , 2014, pp. 311–322
2014
-
[32]
A semantic-aware representation framework for online log analysis,
W. Meng, Y . Liu, Y . Huang, S. Zhang, F. Zaiter, B. Chen, and D. Pei, “A semantic-aware representation framework for online log analysis,” in 2020 29th International Conference on Computer Communications and Networks (ICCCN), 2020, pp. 1–7
2020
-
[33]
Multiresolution dynamic mode decomposition,
J. N. Kutz, X. Fu, and S. L. Brunton, “Multiresolution dynamic mode decomposition,” SIAM Journal on Applied Dynamical Systems , vol. 15, no. 2, pp. 713–735, 2016. [Online]. Available: https: //doi.org/10.1137/15M1023543
2016 doi
-
[34]
Spectral analysis of nonlinear flows,
C. W. ROWLEY , I. MEZI ´C, S. BAGHERI, P. SCHLATTER, and D. S. HENNINGSON, “Spectral analysis of nonlinear flows,” Journal of Fluid Mechanics, vol. 641, p. 115–127, 2009
2009
-
[35]
Dynamic mode decomposition of numerical and experi- mental data,
P. J. Schmid, “Dynamic mode decomposition of numerical and experi- mental data,” Journal of Fluid Mechanics , vol. 656, p. 5–28, 2010
2010
-
[36]
On dynamic mode decomposition: Theory and applications,
J. H. Tu, C. W. Rowley, D. M. Luchtenburg, S. L. Brunton, and J. N. Kutz, “On dynamic mode decomposition: Theory and applications,” Journal of Computational Dynamics , vol. 1, no. 2, pp. 391–421, 2014. [Online]. Available: /article/id/1dfebc20-876d-4da7-8034-7cd3c7ae1161
2014
-
[37]
Multi-resolution dynamic mode decomposition for damage detection in wind turbine gearboxes,
P. Climaco, J. Garcke, and R. Iza-Teran, “Multi-resolution dynamic mode decomposition for damage detection in wind turbine gearboxes,” Data-Centric Engineering, vol. 4, p. e1, 2023
2023
-
[39]
Dynamic mode decomposition with control,
J. L. Proctor, S. L. Brunton, and J. N. Kutz, “Dynamic mode decomposition with control,” SIAM Journal on Applied Dynamical Systems, vol. 15, no. 1, pp. 142–161, 2016. [Online]. Available: https://doi.org/10.1137/15M1013857
2016 doi
-
[40]
Online dynamic mode decomposition for time-varying systems,
H. Zhang, C. W. Rowley, E. A. Deem, and L. N. Cattafesta, “Online dynamic mode decomposition for time-varying systems,” SIAM Journal on Applied Dynamical Systems , vol. 18, no. 3, pp. 1586–1609, 2019. [Online]. Available: https://doi.org/10.1137/18M1192329
2019 doi
-
[41]
Dynamic mode decomposition for large and streaming datasets,
M. S. Hemati, M. O. Williams, and C. W. Rowley, “Dynamic mode decomposition for large and streaming datasets,” Physics of Fluids , vol. 26, p. 111701, 2014
2014
-
[42]
Streaming gpu singular value and dynamic mode decompositions,
S. D. Pendergrass, J. N. Kutz, and S. L. Brunton, “Streaming gpu singular value and dynamic mode decompositions,” ArXiv, vol. abs/1612.07875, 2016
2016 arXiv
-
[43]
Dynamic mode decomposition for multiscale nonlinear physics,
D. Dylewsky, M. Tao, and J. N. Kutz, “Dynamic mode decomposition for multiscale nonlinear physics,” Phys. Rev. E, vol. 99, p. 063311, Jun
-
[44]
Sparsity-promoting dynamic mode decomposition,
M. R. Jovanovi ´c, P. J. Schmid, and J. W. Nichols, “Sparsity-promoting dynamic mode decomposition,” Physics of Fluids , vol. 26, no. 2, p. 024103, 02 2014. [Online]. Available: https://doi.org/10.1063/1.4863670
2014 doi
-
[45]
Multi-resolution dmd,
H. Labs, “Multi-resolution dmd,” 2024. [Online]. Available: https: //humaticlabs.com/blog/mrdmd-python/
2024
-
[46]
An incremental singular value decomposition approach for large-scale spatially parallel & distributed but temporally serial data – applied to technical flows,
N. K ¨uhl, H. Fischer, M. Hinze, and T. Rung, “An incremental singular value decomposition approach for large-scale spatially parallel & distributed but temporally serial data – applied to technical flows,” Computer Physics Communications , vol. 296, p. 109022, 2024. [Online]....
2024
-
[47]
S. L. Brunton and J. N. Kutz, Data-Driven Science and Engineering: Machine Learning, Dynamical Systems, and Control . Cambridge University Press, 2019
2019
-
[48]
L. N. Trefethen and D. Bau, Numerical Linear Algebra . SIAM, Philadelphia, 1997
1997
-
[49]
The optimal hard threshold for singular values is 4 / √ 3,
M. Gavish and D. L. Donoho, “The optimal hard threshold for singular values is 4 / √ 3,” IEEE Transactions on Information Theory , vol. 60, no. 8, pp. 5040–5053, 2014
2014
-
[50]
Chapter 2 - signal sampling and quantization,
L. Tan and J. Jiang, “Chapter 2 - signal sampling and quantization,” in Digital Signal Processing (Third Edition) , L. Tan and J. Jiang, Eds. Academic Press, 2019, pp. 13–58. [Online]. Available: https: //www.sciencedirect.com/science/article/pii/B9780128150719000026
2019
-
[51]
Argonne leadership computing facility (alcf) theta supercomputer,
A. N. Laboratory, “Argonne leadership computing facility (alcf) theta supercomputer,” 2024. [Online]. Available: https://www.alcf.anl.gov/ polaris
2024
-
[52]
La V ALSE: Scalable log visualization for fault characterization in supercomputers,
H. Guo, S. Di, R. Gupta, T. Peterka, and F. Cappello, “La V ALSE: Scalable log visualization for fault characterization in supercomputers,” in Proc. EGPGV, 2018, pp. 91–100
2018
-
[53]
A visual analytics framework for reviewing mul- tivariate time-series data with dimensionality reduction,
T. Fujiwara, Shilpika, N. Sakamoto, J. Nonaka, K. Yamamoto, and K. Ma, “A visual analytics framework for reviewing mul- tivariate time-series data with dimensionality reduction,” IEEE Trans. Vis. Comput. Graph, vol. 27, no. 2, pp. 1601–1611, 2021
2021
-
[54]
CloudDet: Interactive visual analysis of anomalous perfor- mances in cloud computing systems,
K. Xu, Y . Wang, L. Yang, Y . Wang, B. Qiao, S. Qin, Y . Xu, H. Zhang, and H. Qu, “CloudDet: Interactive visual analysis of anomalous perfor- mances in cloud computing systems,” IEEE Trans. Vis. Comput. Graph, vol. 26, no. 01, pp. 1107–1117, 2020
2020
-
[55]
EnsembleLens: Ensemble-based visual exploration of anomaly detection algorithms with multidimensional data,
K. Xu, M. Xia, X. Mu, Y . Wang, and N. Cao, “EnsembleLens: Ensemble-based visual exploration of anomaly detection algorithms with multidimensional data,” IEEE Trans. Vis. Comput. Graph, vol. 25, no. 1, pp. 109–119, 2019
2019
-
[56]
Theta: Rapid installation and acceptance of an XC40 KNL system,
K. Harms, T. Leggett, B. Allen, S. Coghlan, M. Fahey, C. Holohan, G. McPheeters, and P. Rich, “Theta: Rapid installation and acceptance of an XC40 KNL system,” Concurrency and Computation: Practice and Experience, vol. 30, no. 1, 2018, e4336 cpe.4336
2018
-
[57]
The supercomputer “Fugaku
M. Sato, “The supercomputer “Fugaku” and Arm-SVE enabled A64FX processor for energy-efficiency and sustained application performance,” in Proc. ISPDC, 2020, pp. 1–5
2020
-
[58]
Aurora: Argonne’s next-generation exascale supercomputer,
R. Stevens, J. Ramprakash, P. Messina, M. Papka, and K. Riley, “Aurora: Argonne’s next-generation exascale supercomputer,” 3 2019
2019
-
[59]
The exascale era is upon us: The frontier supercomputer may be the first to reach 1,000,000,000,000,000,000 operations per second,
D. Schneider, “The exascale era is upon us: The frontier supercomputer may be the first to reach 1,000,000,000,000,000,000 operations per second,” IEEE Spectr., vol. 59, no. 1, p. 34–35, jan 2022. [Online]. Available: https://doi.org/10.1109/MSPEC.2022.9676353
2022
-
[60]
Principal components analysis (pca),
A. Ma ´ckiewicz and W. Ratajczak, “Principal components analysis (pca),” Computers & Geosciences , vol. 19, no. 3, pp. 303–342, 1993. [Online]. Available: https://www.sciencedirect.com/science/article/pii/ 009830049390090R
1993
-
[61]
Incremental learning for robust visual tracking,
D. A. Ross, J. Lim, R.-S. Lin, and M.-H. Yang, “Incremental learning for robust visual tracking,” Int. J. Comput. Vis. , vol. 77, no. 1-3, pp. 125–141, 2008
2008
-
[62]
Accelerating t-sne using tree-based algorithms,
L. van der Maaten, “Accelerating t-sne using tree-based algorithms,” Journal of Machine Learning Research, vol. 15, no. 93, pp. 3221–3245,
-
[63]
Umap: Uniform manifold approximation and projection,
L. McInnes, J. Healy, N. Saul, and L. Grossberger, “Umap: Uniform manifold approximation and projection,” The Journal of Open Source Software, vol. 3, no. 29, p. 861, 2018
2018
-
[64]
Application of aligned-umap to longitudinal biomedical studies,
A. Dadu, V . K. Satone, R. Kaur, M. J. Koretsky, H. Iwaki, Y . A. Qi, D. M. Ramos, B. Avants, J. Hesterman, R. Gunn, M. R. Cookson, M. E. Ward, A. B. Singleton, R. H. Campbell, M. A. Nalls, and F. Faghri, “Application of aligned-umap to longitudinal biomedical studies,” Patter...
2023
-
[65]
Multicore-tsne,
D. Ulyanov, “Multicore-tsne,” https://github.com/DmitryUlyanov/ Multicore-TSNE, 2016
2016
-
[2014]
Available: http://jmlr.org/papers/v15/vandermaaten14a
[Online]. Available: http://jmlr.org/papers/v15/vandermaaten14a. html
-
[2019]
Available: https://link.aps.org/doi/10.1103/PhysRevE
[Online]. Available: https://link.aps.org/doi/10.1103/PhysRevE. 99.063311
-
[2021]
Available: https://doi.org/10.1007/s10796-020-10026-3
[Online]. Available: https://doi.org/10.1007/s10796-020-10026-3
Reviewed August 10, 2026 · model on record in the stance chip above.
Discussion (0). Continue with ORCID to comment.