REVIEW 4 major objections 4 minor 2 cited by
Spatially-resolved spectro-photometric SED Modeling of NGC 253's Central Molecular Zone I. Studying the star formation in extragalactic giant molecular clouds
T0 review · 4 major / 4 minor · reviewed 2026-08-10 · deepseek-v4-flash
Pith's one-line read This paper builds the first spatially-resolved SEDs of an extragalactic source—ten giant clouds in NGC 253 at 51-pc resolution—and uses them to show the inner clouds double the outer clouds in SFR, stellar mass, and dust mass.
desk verdict First 51-pc panchromatic GMC SEDs in NGC 253 are a genuinely useful data product; the quantitative SFR/dust numbers rest on an extrapolated FIR bump, so treat the calibrations as provisional until FIR-resolved data arrive. read the letter →
The pith
A machine-rendered reading of the paper's core claim, the machinery that carries it, and where it could break.
The reading
What carries the argument
The load-bearing object is a set of ten 3-arcsecond apertures (51 pc at 3.5 Mpc) placed on the ALMA-identified GMCs of NGC 253, combined so that every aperture carries photometry from near-UV to 20 cm—six decades in frequency. The argument runs through a physically self-consistent SED model whose star formation history simultaneously determines stellar population emission, nebular lines and free-free, two dust components (an embedded birth-cloud phase and a diffuse phase), and synchrotron emission. That single-history structure is what lets the observed radio and submillimeter points constrain the dust temperature and hence the dust mass and SFR, and what makes the comparison of monochromatic tracers to a full panchromatic fit meaningful.
What would settle it
The direct falsifier is the 9-arcsecond Herschel SED of the nuclear region (GMCs 4–6): if fitting that SED with the same two-component dust model returns a diffuse-dust temperature outside the 63–85 K range quoted by the paper, then the 3-arcsecond FIR bump was extrapolated incorrectly and the dust masses and SFRs built on it would shift.
Extended reading notes
Core claim
On the paper's own terms, the discovery is that the panchromatic spectral energy distribution of a starburst can be assembled at the scale of a single giant molecular cloud: ten GMCs in NGC 253's central molecular zone are each measured from near-UV (0.36 µm) to centimeter (20 cm) wavelengths in a common 3 arcsecond (51 pc) aperture, spanning six decades in frequency. Fitting these SEDs with a self-consistent model of stellar populations, nebular emission, two dust components, and synchrotron radiation, the paper finds that the four nuclear GMCs (3–6) have star formation rates of 0.087–0.65 M_sun $yr^{-1}$, stellar masses of 3.7–7.1 × $10^{8}$ M_sun, and dust masses of 1.6–5.8 × $10^{5}$ M_sun, all roughly double those of the six outer GMCs. It also finds that the 33 GHz continuum, radio recombination lines, total 8–1000 µm luminosity, and 60 µm emission give the tightest, near-unity relations with the SFR from the full SED, so centimeter photometry works as an SFR tracer at GMC scales.
Load-bearing premise
The results assume each 51-parsec aperture is one isolated evolving cloud, and that the far-infrared dust bump—where the dust mass and SFR estimates mainly live—can be extrapolated without direct FIR observations at that resolution.
Editorial extensions
If this is right
- H-alpha-derived SFRs are systematically out of step with the full-SED SFRs in this obscured environment, so dust-insensitive radio tracers are preferable inside central molecular zones.
- The 33 GHz continuum can be used as a pencil-beam SFR tracer at roughly 50 pc scales in starbursts, extending galaxy-wide calibrations down by two orders of magnitude in spatial scale.
- The central molecular zone of NGC 253 is genuinely heterogeneous: the four inner clouds dominate cloud-scale star formation and dust mass, while outer clouds are colder and more quiescent.
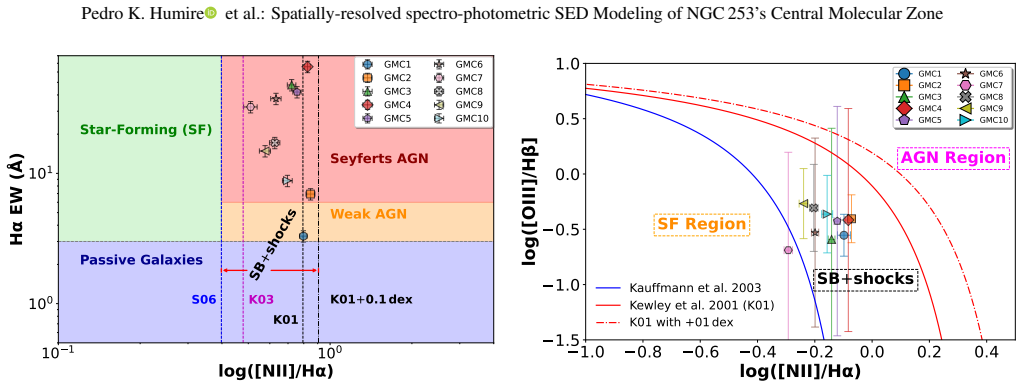
- Line-ratio diagnostic diagrams place the clouds in the composite zone, and the paper's interpretation is that this comes from shocks in the starburst, with an AGN contributing at most 7.5% of the panchromatic luminosity.
Reading between the lines
- Editorial inference: because the four nuclear clouds all share the same far-infrared extrapolation, the inner-versus-outer contrast is probably more robust than the absolute dust masses and SFRs; a systematic error in the FIR bump would move all inner clouds together.
- Editorial inference: the tight 33 GHz–SFR relation at 50 pc scales suggests the same calibration could be pushed to the ~2 pc scales of super star clusters wherever ALMA and VLA resolution allow, directly testing whether radio SFR tracers remain linear below 50 pc.
- Editorial inference: the archival-assembly method used here could be applied to other nearby starbursts (for example M 82) without waiting for new FIR facilities, although the FIR extrapolation caveat would carry over.
Editorial analysis
A structured set of objections, weighed in public.
Referee Report
Summary. The paper assembles archival photometry from S-PLUS, HST, VLT/NaCo and VISIR, Spitzer/IRAC, ALMA/ALCHEMI, and VLA/EVLA to construct 3″-diameter SEDs for ten GMCs in NGC 253's central molecular zone. The authors fit these SEDs with GalaPy as the primary code and CIGALE as a cross-check, supplement the analysis with starlight fits to MUSE plus S-PLUS data, and derive SFRs, stellar and dust masses, ages, and attenuations. They report that central GMCs 3–6 have roughly double the stellar masses, dust masses, and SFRs of external GMCs, and they test monochromatic SFR tracers, finding that 33 GHz radio continuum, radio recombination lines, L_IR, and 60 um emission correlate best with the SED-derived SFRs. A 9″ Herschel/PACS fit is used to support the far-infrared extrapolation, with the paper explicitly acknowledging the absence of 3″ FIR photometry and the partial circularity of the IR tracer correlations.
Significance. If the relative internal/external trends survive better FIR constraints, this is a valuable step: it is one of the first attempts to model panchromatic SEDs at roughly 50 pc scales in an external starburst and to test radio and IR SFR tracers at GMC scales. The paper has several concrete strengths: the internal versus external trends are consistent across GalaPy and CIGALE; the radio-based SFR correlations are anchored in independent VLA/EVLA and H40alpha data; the authors are transparent about the FIR extrapolation in Sect. 5.1 and about the non-independence of the IR tracers in Sect. 4.3.3; and the 9″ PACS test is an honest attempt at external validation. The main scientific value lies in the relative comparison and in the radio tracer calibrations; the absolute dust masses and SFRs, and the ranking of IR tracers, need to be presented with stronger caveats or additional validation.
major comments (4)
- [§5.1, Table 2, Fig. E.1] The 3″ SEDs have no photometric points between 18.7 μm (VLT/Q, only for GMCs 3–7) and 0.93 mm (ALMA B7), so the FIR bump, L_IR, M_dust, and instantaneous SFRs in Tables 5 and B.1 are determined by GalaPy's two-greybody diffuse-dust model across an unobserved gap. The 9″ PACS fit in Appendix E covers a blended aperture centered on GMC 5 that includes GMCs 4–6; its T_DD = 68.8 K does not verify the individual 3″ temperatures (84.5, 67.9, and 63.3 K for GMCs 4, 5, and 6 in Table B.1), and GMCs 1, 2, 7–10 have no FIR constraint at all. A plausible shift of ~20 K in the FIR peak would substantially change L_IR, M_dust, and SFR, and the GalaPy versus CIGALE comparison already shows factor ~3.3 differences for GMC 5 (0.645 versus 0.196 M_sun/yr). The quantitative internal/external doubling claim therefore rests on a model extrapolation; please quantify the sensitivity of the derived M_dust and SFR values to the assumed FIR peak or explicitly reframe those numbers as model-dependent.
- [§4.3.3, Fig. 14] The correlations between SFR and L_24μm, L_60μm, L_100μm, and L_IR are not independent validations: both axes are read from the same GalaPy SED fits that provide the SFRs. The paper acknowledges this in Sect. 4.3.3, but the abstract and conclusions still list L_IR and 60 μm among the best SFR tracers without carrying that caveat forward. The radio correlations (Fig. 13) and the H40alpha comparison (Fig. 12) use independent data and do support the radio-tracer conclusion; the IR-tracer ranking should be explicitly presented as an internal consistency check, or validated with independent FIR photometry, before being quoted as a calibration result.
- [§3.1.1, Table 3] The in-situ model with N_MC = 1 treats each 3″ aperture as an isolated, single molecular cloud with self-consistently evolving gas and dust. In the crowded and highly inclined CMZ of NGC 253 this is a strong assumption: the 9″ PACS aperture itself blends GMCs 4–6, and the 3″ apertures sit on a substantial stellar and gas background. Because the SFH, stellar age, and instantaneous SFR all follow from the isolated-system assumption, the paper should provide some test of this assumption, for example by fitting an annulus as background, shifting the aperture center by the reported coordinate differences, or varying N_MC. At minimum, the conclusions should state explicitly which results remain unchanged if the isolated-cloud assumption is relaxed.
- [Tables 5/6, Eq. (6)] The 33 GHz SFR calibration in Eq. (6) is anchored to GalaPy's instantaneous SFR. Since GalaPy and CIGALE differ by factors up to ~3.3 for the same GMC, the calibration inherits the full model systematics of the chosen SED code even though the correlation itself is tight. The H40alpha comparison in Sect. 4.3.2 provides some support, but it covers only GMCs 4–6 and the comparison is made on aperture-matched regions with their own assumptions. Please quote the radio calibration with an explicit systematic error term reflecting the SED-code spread, and state that the calibration is relative to the GalaPy SFR scale.
minor comments (4)
- [Abstract, §1] The claim of 'six decades in frequency' should be checked: 3,563 Å to 20 cm is log10(0.2/3.563e-7) ≈ 5.75 decades, and at 3″ there are no data between 18.7 μm and 0.93 mm; the phrase 'panchromatic' should be qualified accordingly.
- [Table 4] The notation for GMC-specific parameter ranges, e.g., 'GMC2: ([6.0, 12.0])', is hard to read because the same numeric interval also appears in the 'Common parameter ranges' column; please clarify that all entries are in log10 units and specify the units for age, sfh.tau_star, and ism.tau_esc.
- [§4.2.2, Fig. 9] The trend between |ΔA_V| and stellar age uses Balmer-decrement attenuations whose uncertainties are as large as roughly 90% (Table 8); the regression should display these uncertainties on the y-axis and the interpretation should be phrased accordingly.
- [Fig. 6] The labels r.l.f. and r.m.f. are not defined in the text or caption; please define 'remaining light fraction' and 'remaining mass fraction' where they first appear.
Circularity Check
IR-tracer calibration is partly self-referential: the L_IR, 60, 100, and 24 micron luminosities come from the same GalaPy fit that yields the SFRs, so the ranking of IR SFR tracers is partly an internal-consistency check; radio and H40alpha comparisons remain independent.
-
fitted input called prediction
[Sect. 4.3.3, Fig. 14 (IR tracers); see also Sect. 5.1]
"Accounting for IR points as SFR tracers, as can be seen in Fig. 14, we generally find a comparable dispersion and quality of fit (in terms of mean R) to that obtained with radio bands. However, it is important to note that, since these IR data points are directly derived from the GalaPy SED fitting employed to estimate the SFR, they are not entirely independent of the latter."
The SFR values on the y-axis of Fig. 14 are outputs of GalaPy, and the IR luminosities on the x-axis (L_24, L_60, L_100, and integrated L_IR) are read off the same best-fit GalaPy model. Regressing one set of model outputs against another and then ranking 'best SFR tracers' therefore measures model self-consistency more than independent tracer performance. The authors explicitly concede the non-independence, so the circularity is acknowledged rather than concealed; it affects the IR part of the tracer ranking, not the radio/RRL results.
full rationale
The central derivation is largely self-contained: the GalaPy and CIGALE SED fits are driven by archival photometry, the starlight fits use MUSE+S-PLUS data, and the internal/external GMC dichotomy is additionally supported by independent ALCHEMI chemistry, H40alpha RRLs, and radio continuum measurements. There is no load-bearing self-citation chain or imported uniqueness theorem: GalaPy is an open-source code with its own published benchmarks, and the ALCHEMI references supply independent observational constraints. The one genuine circular element is the IR tracer calibration (Sect. 4.3.3): because L_IR, L_60, L_100, and L_24 are model-derived luminosities from the same GalaPy fits that produce the SFRs, the tight correlations in Fig. 14 are partly internal consistency. The paper states this explicitly, which is why this is scored as partial circularity rather than as a concealed tautology. The radio-based correlations and the H40alpha comparison are independent enough to keep the main internal-versus-external star-formation result well supported. Model systematics (e.g., GalaPy vs CIGALE factor-of-several SFR differences) are a correctness/robustness concern, not a circularity one.
Assumptions & free parameters
free parameters (9)
- GalaPy age =
log10(yr) 7.33-9.95 across GMCs
- sfh.tau_star =
log10(yr) 7.48-10.88
- sfh.psi_max =
log10(Msun/yr) -1.92 to 1.15
- ism.R_MC =
log10(pc) 0.54-1.60
- ism.Rdust =
log10(pc) 1.08-1.64
- ism.f_PAH =
0.03-0.32
- ism.f_MC =
0.01-0.43
- ism.tau_esc =
log10(yr) 6.18-9.22
- noise.f_cal =
-2.25 to -0.55
assumptions (7)
- domain assumption The In-Situ SFH model (Lapi et al. 2018) is valid for an isolated GMC
- domain assumption Each 3'' aperture is an isolated system with N_MC=1
- domain assumption Chabrier IMF
- domain assumption AGN contribution is negligible
- ad hoc to paper The FIR bump at 3'' is captured by model extrapolation
- domain assumption Distance to NGC 253 is 3.5 Mpc
- domain assumption LTE and optically thin sulfur isotopologue modeling
Cite this review
Pith. "Pith review of Spatially-resolved spectro-photometric SED Modeling of NGC 253's Central Molecular Zone I. Studying the star formation in extragalactic giant molecular clouds." pith.science (2026). https://pith.science/paper/D6FKRZMT
@misc{pith2026250115082,
  author       = {Pith},
  title        = {Pith review of: Spatially-resolved spectro-photometric SED Modeling of NGC 253's Central Molecular Zone I. Studying the star formation in extragalactic giant molecular clouds},
  year         = {2026},
  howpublished = {\url{https://pith.science/paper/D6FKRZMT}},
  note         = {Machine review of arXiv:2501.15082}
}
abstract
Studying the interstellar medium in nearby starbursts is essential for understanding the physical mechanisms driving these objects, thought to resemble young star-forming galaxies. This study aims to analyze the physical properties of the first spatially-resolved multi-wavelength SED of an extragalactic source, spanning six decades in frequency (from near-UV to cm wavelengths) at an angular resolution of 3$^{\prime\prime}$ (51 pc at the distance of NGC,253). We focus on the central molecular zone (CMZ) of NGC,253, which contains giant molecular clouds (GMCs) responsible for half of the galaxy's star formation. We use archival data, spanning optical to centimeter wavelengths, to compute SEDs with the GalaPy and CIGALE codes for validation, and analyze stellar optical spectra with the \textsc{starlight} code. Our results show significant differences between central and external GMCs in terms of stellar and dust masses, star formation rates (SFRs), and bolometric luminosities. We identify the best SFR tracers as radio continuum bands at 33 GHz, radio recombination lines, and the total infrared luminosity (L$_{\rm IR}$; 8-1000$\mu$m), as well as 60$\mu$m IR emission. BPT and WHAN diagrams indicate shock signatures in NGC~253's nuclear region, associating it with AGN/star-forming hybrids, though the AGN fraction is negligible ($\leq$7.5%). Our findings show significant heterogeneity in the CMZ, with central GMCs exhibiting higher densities, SFRs, and dust masses compared to external GMCs. We confirm that certain centimeter photometric bands can reliably estimate global SFR at GMC scales.
Figures


Figures from the paper (10 more)




Forward citations
Cited by 2 Pith papers
-
The Discovery of 25 um Interstellar Methanol
Methanol's 25 µm torsional band is detected for the first time in interstellar gas, toward NGC 7538 IRS 1, giving a temperature near 180 K and a column density near 2×10^17 cm^-2.
-
Mapping Dust Attenuation at Kiloparsec Scales. III. The 2175\AA\ Bump
The 2175Å attenuation bump is strongest at low Σ_Hα/Σ_* (especially non-SF regions) while absolute strength tracks dust column, supporting local radiation-field processing of its carriers.
Reference graph
Works this paper leans on
-
[1]
Allard, E. L., Knapen, J. H., Peletier, R. F., & Sarzi, M. 2006, MNRAS, 371, 1087 Allard, E. L., Peletier, R. F., & Knapen, J. H. 2005, ApJ, 633, L25 Álvarez-Márquez, J., Crespo Gómez, A., Colina, L., et al. 2023, A&A, 671, A105 Anantharamaiah, K. R. & Goss, W. M. 1996, ApJ, 466, L13 Ando, R., Nakanishi, K., Kohno, K., et al. 2017, ApJ, 849, 81 Baes, M., ...
work page 2006
-
[2]
AGN fraction 0.0-0.4 by a bin of 0.05 extinction law of polar dust SMC E(B-V) of polar dust 0.01-0.7 by a bin of 0.5 Temperature of the polar dust K 100 Emissivity index of the polar dust 1.6 Radio SF FIR/radio parameter∗ qIR 1.3 - 2.9 by a bin of 0.5 SF Power-law slope (Flux∝ Frequencyαsynch) αSF −2.0 to−0.2 by a bin of 0.5 Radio-Loudness parameter∗∗ RAG...
work page 2022
-
[5]
It shows the highest column densities in both methanol symmetric types and presents the second highest SiO(2–1)/HNCO(40,4− 30,3) ratios after GMC 4, indicative of a strongly perturbed environment due to the presence of strong shocks (Meier et al. 2015; Humire et al. 2022; Huang et al. 2023). GMC 7 hosts the strongest methanol emission at 84.53 and 132.89 ...
work page 2015
-
[6]
(Rico-Villas et al. 2020; Butterworth et al. 2024). However, it might be that the MIR emission we account for in the SED fitting mainly originates from low-mass /old stellar populations. If that is the case, we do not have a clear answer for this discrepancy. Appendix D: Comparison among different methodologies Given the di fferent SED modeling approaches...
work page 2024
-
[7]
at the GMC position. This corresponds to the depiction of cold/low-dispersion gas actively producing stars at the convergence of the ring and the bar, as observed in M 100 (Allard et al. 2005). A more evolved and therefore, more easily observed stellar stream is in line with this position being the oldest among the nuclear regions, as deduced from our SED...
work page 2005
-
[9]
A similar conclusion can also be obtained from the distribution of sulfurated molecules seen in ALMA Band 3 (84–116 GHz), whose emission is also enhanced toward the northeast segment of NGC 253’s CMZ (Meier et al. 2015). GMC 9 presents a mild stellar velocity dispersion ( σ⋆; see Table
work page 2015
-
[11]
and designed for the analysis and syn- thesis of molecular spectra in astrophysical research. It enables spectral modeling, line identification, and data interpretation for astronomical observations, with the capability of performing both local thermodynamic equilibrium (LTE) and non-LTE mod- eling. When performing non-LTE modeling, CASSIS functions as a ...
work page 2007
-
[15]
Article number, page 31 of 34 A&A proofs: manuscript no. aanda 0 100 200 300 400 vlsr [km s 1] 0.5 0.0 0.5 1.0 1.5 2.0 2.5 TMB [K] 138.73934 0 100 200 300 400 vlsr [km s 1] 5 0 5 10 15 184.98177 0 100 200 300 400 vlsr [km s 1] 0 1 2 3 4 5 6 CARMA7 231.22069 0 100 200 300 400 vlsr [km s 1] 0 1 2 3 4 5 6 7 277.45540 0 100 200 300 400 vlsr [km s 1] 4 2 0 2 4...
work page 2022
Show all 15 references
-
[253]
For the CIGALE modeling including the AGN component, we only added the AGN module to the existing input parameters
The list of input parameters to CIGALE analysis without and with AGN component is given in Table A.1. For the CIGALE modeling including the AGN component, we only added the AGN module to the existing input parameters. These CIGALE inputs have yielded a mean reduced χ2 of 2.2 f...
2022
-
[2005]
Our best-results are shown in Fig
for spectroscopic data and restricted to LTE conditions, since these molecules are expected to trace dense gas. Our best-results are shown in Fig. C.1. This way, we obtained di fferent solutions ranging from 32S/34S rates much lower than expected in the Milky Way (∼5) to more ...
2022
-
[2006]
and be a result of its position in between the spiral arms and the inner bar, where (x 1/x2) interactions and inner Lindblad resonances take place (see dashed gray ellipses in Fig. 2). A similar origin for the velocity dispersion can be inferred for GMCs 1, 2, and 8–9, in cont...
2024
-
[2014]
Mass fraction of PAH qPAH 0.47, 1.77, 2.50, 3.19, 4.58, 5.26, 6.63, 7.32 Minimum radiation field Umin 0.4, 0.8, 1.2, 1.6, 2.0, 2.5, 4, 8, 15 power law index of the radiation α 2 fraction illuminated from Umin to Umax γ 0.02, 0.06, 0.1, 0.15, 0.2 active nucleus model; Skirtor (...
2012
-
[2015]
e-folding time of the main stellar population model [Myr] τmain 300-5000 by a bin of 300 e-folding time of the late starburst population model [Myr] τburst 50-500 by a bin of 50 mass fraction of the late burst population fburst 0.01, 0.03, 0.05, 0.1, 0.3, 0.6, 0.9 Age of the m...
2000
-
[2019]
as it has also been used to distinguish between LTE and non-LTE emission, enabling the discovery of new maser transitions (Humire et al. 2024). While originally designed to process single spectra, the code can be adapted to handle data cubes (Harada et al
2024
-
[2023]
Indeed, the strongest SiO(5–4)/HNCO(100,10− 90,9) ratios are observed at this position (Humire et al
and strong shocks at high-J frequency transi- tions. Indeed, the strongest SiO(5–4)/HNCO(100,10− 90,9) ratios are observed at this position (Humire et al. 2022). The whole pic- ture may also be that weak and strong shocks are actually mixed over the entire CMZ (Bao et al. 2024...
2022
Reviewed August 10, 2026 · model on record in the stance chip above.
Discussion (0). Continue with ORCID to comment.