REVIEW 3 major objections 5 minor 62 references
Coronal dimmings from active region 13664 during the May 2024 solar energetic events
T0 review · 3 major / 5 minor · reviewed 2026-08-07 · deepseek-v4-flash
Pith's one-line read This paper claims that within a single active region, dimming area and area growth rate track flare peak flux and fluence more tightly than in the general population, and that coronagraph-only CME speeds underestimate the dimming–CME link.
desk verdict A genuinely new single-AR dimming dataset and a reproducible selection tool, but the comparative claim of enhanced correlations over the general population is not yet controlled for the data-dependent threshold. read the letter →
The pith
A machine-rendered reading of the paper's core claim, the machinery that carries it, and where it could break.
The reading
What carries the argument
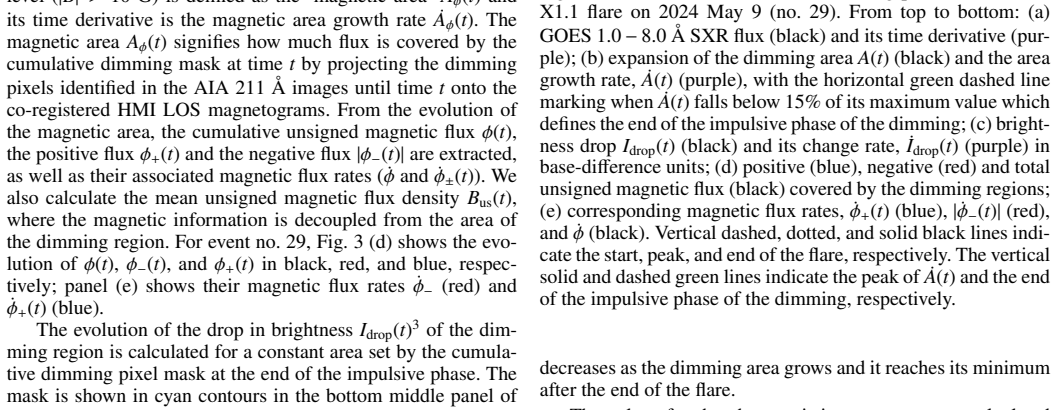
The carrying object is the cumulative dimming mask built by logarithmic base-ratio thresholding of SDO/AIA 211 Å images at $\log_{10}(I/I_0) \le -0.19$, from which the paper derives the time evolution of dimming area $A(t)$, area growth rate $\dot{A}(t)$, magnetic area $A_\phi(t)$, unsigned magnetic flux $\phi(t)$, and brightness drop $I_{\rm drop}(t)$. The load-bearing selection rule is Eq. (2): a detection counts as a real coronal dimming only if its mean area growth rate during the first hour after flare onset exceeds $1.8\times10^{6}$ km$^{2}$ s$^{-1}$, equivalent to $\Delta A \ge 6.48\times10^{9}$ km$^{2}$; this threshold comes from a superposed-epoch analysis of events visually classified into clear, complicated, unclear, and absent dimmings. The threshold turns the 67 M/X-class flares into the 16 on-disc events whose log-log correlations with flare and CME parameters carry the paper's conclusions.
What would settle it
Take the 62-event comparison sample, apply the same selection used here—only flares of GOES class ≥M1.0 and only events whose first-hour mean area growth rate exceeds $1.8\times10^{6}$ km$^{2}$ s$^{-1}$—and recompute the correlations of total dimming area with GOES peak flux and fluence; if the coefficients do not rise toward the paper's values ($c \approx 0.78$ and $0.68$), the claimed single-AR enhancement is a selection artifact rather than a physical effect. Alternatively, a single visually unambiguous dimming associated with a fast CME that fails the growth-rate threshold would falsify the threshold's role as the discriminator of real dimmings.
Extended reading notes
Core claim
Within a single active region the relation between dimmings and their parent flares is much tighter than in the wider dimming population, and the extra amount of correlation is physically informative rather than incidental. For the 16 on-disc dimmings from AR 13664, total dimming area $A$ correlates with GOES peak soft X-ray flux $F_P$ at $c = 0.78 \pm 0.12$ (compared with $c = 0.53 \pm 0.07$ for the comparison sample), and the magnetic dimming area $A_\phi$ reaches $c = 0.84 \pm 0.08$ with $F_P$; similar enhancement appears for flare fluence and for the area growth rate. The paper further shows that when CME maximum velocities are taken only from SOHO/LASCO coronagraphs the correlations with dimming parameters drop (for the comparison sample, from $c \approx 0.56$–$0.69$ with EUV-inclusive velocities to $c \approx 0.36$–$0.41$ with LASCO-only velocities), demonstrating that coronagraphs underestimate the dimming–CME link because they miss the early acceleration phase below about $2\,R_\odot$. It also finds that AR 13664's very strong magnetic fields suppress eruptions: only 23% of its M-class flares (and 83% of its X-class flares) were accompanied by CMEs, well below the general M-class association rate of roughly 60%.
Load-bearing premise
The load-bearing premise is that the visual classification of detections into clear, complicated, unclear, and absent dimmings is an unbiased ground truth, so that the derived threshold—an average area growth rate above $1.8\times10^{6}$ km$^{2}$ s$^{-1}$ within the first hour—separates true plasma-depletion dimmings from unrelated EUV darkenings; if that premise fails, the selection of the 16 on-disc events and the correlations built on them become partly a selection artifact.
Editorial extensions
If this is right
- Dimming area and area growth rate, measured from full-disc EUV images, can be used as quantitative proxies for GOES soft X-ray peak flux and fluence, at least for events from a single active region.
- Magnetic dimming area and its growth rate can serve as early indicators of maximum CME speed, provided the CME kinematics include the low corona rather than only coronagraph data.
- Coronagraph-only CME catalogues systematically weaken dimming–CME correlations because they miss the acceleration phase below about $2\,R_\odot$; future studies should combine EUV and coronagraphic measurements.
- Flare–CME association rates are not universal: in AR 13664 only 23% of M-class flares and 83% of X-class flares had CMEs, reflecting strong magnetic confinement, so global rates should not be applied to individual active regions.
- The same dimming diagnostics are relevant to stellar CME searches, where strong-field active regions may bias the detectability of stellar eruptions.
Reading between the lines
- Inference beyond the paper: part of the claimed enhancement over the comparison sample could be a selection effect, because the first-hour growth-rate threshold removes the slow-growing dimmings that would add scatter to the area–flux relation; applying the identical threshold to the comparison sample would test this.
- Inference beyond the paper: if the single-AR correlations are physical, then global statistical samples are diluted by mixing different magnetic environments, and future dimming–flare correlations should be stratified by active-region magnetic flux or include region identity as a covariate.
- Inference beyond the paper: the growth-rate threshold suggests an operational early-warning test—flag a ≥M1 flare once an EUV region grows by $6.48\times10^{9}$ km$^{2}$ within an hour—and this could be validated in real time against LASCO CME speeds.
- Inference beyond the paper: a direct check of the coronagraph-underestimation claim for the May 2024 events would be to compare LASCO-based $v_{\max}$ correlations with velocities reconstructed from STEREO-A EUVI plus COR data, even at the limited 12° separation available.
Editorial analysis
A structured set of objections, weighed in public.
Referee Report
Summary. The paper presents a systematic study of coronal dimmings associated with flares and CMEs from active region 13664 during 2024 May 1–15. The authors identify 67 M- and X-class flares, 23 CMEs, and 22 dimming detections (16 on-disc), and derive characteristic dimming parameters (area, area growth rate, magnetic flux, brightness drop) using the Dissauer et al. detection and parameterization framework. They compare correlations between dimming parameters and GOES flare peak flux, fluence, and CME maximum velocity with the statistical sample of Dissauer et al. (2018b, 2019), finding enhanced correlations for the single-AR sample and arguing that LASCO-based CME velocities underestimate the true correlations because they miss the early acceleration phase. The central claims are that dimming area and area growth rate are tighter proxies for flare energy release in a single active region than in the general population, and that coronal dimmings capture low-corona CME dynamics better than coronagraphs.
Significance. If the central claims hold, the paper provides quantitative support for using coronal dimming area and growth rate as proxies for flare energy release and as early indicators of CME speed, with potential application to stellar CME studies. The single-AR sample is a valuable complement to the multi-AR statistical studies, and the careful uncertainty estimation via threshold variation and bootstrapping is a strength. However, the significance is moderated by two load-bearing concerns: the dimming sample is selected by a threshold derived from the same dataset, and the comparison with the KD18 sample is not controlled for that differential selection; additionally, the tables that are needed to reproduce the correlations contain inconsistent event numbering. These issues must be resolved before the claimed enhancements can be considered established.
major comments (3)
- [Section 3.3, Eq. (2)] The selection threshold on the first-hour mean area growth rate (Eq. 2) is derived from a superposed epoch analysis of the very same 67 flares (Fig. 4) and is then applied to that same sample to define the 16 on-disc dimmings. The KD18 comparison sample was selected by a different visual pre-selection procedure and includes B/C-class flares. Since the threshold truncates the sample on the area growth rate, the reported enhancements of the correlations involving A and \dot{A} relative to KD18 could be partly a selection artifact. The paper acknowledges in Sect. 5.3 that 'a preselection step was necessary', but it does not quantify the effect on the comparison. Please add a robustness test, for example by applying an analogous growth-rate threshold to the KD18 sample (if the time series allow) or by recomputing the KD18 correlations on the M1.0+ subsample, and by reporting the correlations obtained with and without the threshold for the May 2024 full detection set.
- [Section 4.2, Fig. 5(b)] The abstract claims stronger correlations with both GOES peak flux and fluence. For the headline pair A vs F_T, the evidence does not support an enhancement: the May 2024 correlation is c = 0.68 ± 0.10 versus c = 0.67 ± 0.06 for KD18, which are indistinguishable within the quoted uncertainties. The paper reports bootstrap error bars but never performs a formal test of the difference between the two correlation coefficients. Please add a formal comparison (e.g., Fisher z-transform or bootstrap of the difference) for all pairs where an enhancement is claimed, and state explicitly which differences are statistically significant and which are not.
- [Tables A.1 and B.1] The event numbering in Table B.1 does not match Table A.1. For example, Table B.1 lists N=4 as a dimming event on May 5 at 14:33 UT, but Table A.1 N=4 corresponds to a flare on May 5 at 09:23 UT with no dimming, while the 14:33 UT dimming is N=5 in Table A.1. Similar mismatches occur for other rows (e.g., B.1 N=27 appears to correspond to A.1 N=25). This inconsistency makes it impossible for a reader to associate the tabulated dimming parameters with the correct flare and CME properties, and casts doubt on the reproducibility of all correlation results that use these parameters. Please correct the tables and verify that the analysis code and figures used the correct event pairings.
minor comments (5)
- [Fig. 4 caption] The caption uses 'pink' for the category that the text in Sect. 3.3 calls 'magenta'; please harmonize the terminology.
- [Section 4.4] Typo: 'coronagrapo- hic' should be 'coronagraphic' in the sentence about the coronagraphic field of view.
- [Section 2.2] Minor grammatical issue: 'The data was rebinned' should be 'The data were rebinned'.
- [Table B.1] The column header 'Flare Start' would be clearer as 'Flare Start (UT)'.
- [References] The reference to Veronig et al. (2025) as 'under review' should be updated if the Living Reviews article has been accepted or published by the time of publication.
Circularity Check
No significant circularity: the selection threshold is a methodological choice and the KD18 baseline is an external published dataset.
full rationale
The paper's derivation chain is: detect dimmings with a fixed log-ratio threshold (-0.19); extract dimming parameters following Dissauer et al. (2018a); apply a selection criterion (Eq. 2) to exclude false detections; compute Pearson correlations for the selected 16 on-disc dimmings; and compare with the published KD18 sample. None of these steps defines a target quantity in terms of an input. The Eq. (2) threshold is derived from a superposed epoch analysis of the same 67 flares, and applying it only to the May 2024 sample could bias the KD18 comparison. However, the reported correlations are not fixed by the threshold by construction; they are empirical measurements on the filtered sample. The paper explicitly acknowledges the preselection step in Sect. 5.3, which is a statistical limitation, not a circular reduction. The KD18 comparison uses a published, externally falsifiable dataset from 2010-2012. Although the same research group is involved, those data are independent of the May 2024 fitted values and do not constitute a self-citation chain that forces the conclusion. Self-citations supply the detection algorithm and comparison baseline, but the core correlations are computed from new observations. Therefore no circularity is found.
Assumptions & free parameters
free parameters (1)
- Dimming selection threshold on first-hour area growth rate =
1.8x10^6 km2/s (equivalent to area gain of 6.48x10^9 km2 within one hour)
assumptions (4)
- domain assumption EUV 211 Å brightness decreases in the identified regions are caused by plasma density depletion (mass loss) rather than by temperature changes or cool ejecta.
- domain assumption The detection algorithm and parameter definitions from Dissauer et al. (2018a) are directly transferable to a highly active, large active region without recalibration, enabling the quantitative comparison of parameter distributions and correlations between the two samples.
- standard math Pearson correlation in log-log space with bootstrapped errors is an adequate statistical framework for comparing correlation strengths between the two datasets.
- ad hoc to paper The 2-hour analysis window and manual stops at subsequent flares do not systematically truncate the dimming evolution for most events.
Cite this review
Pith. "Pith review of Coronal dimmings from active region 13664 during the May 2024 solar energetic events." pith.science (2026). https://pith.science/paper/DLTBZJAV
@misc{pith2026250604818,
  author       = {Pith},
  title        = {Pith review of: Coronal dimmings from active region 13664 during the May 2024 solar energetic events},
  year         = {2026},
  howpublished = {\url{https://pith.science/paper/DLTBZJAV}},
  note         = {Machine review of arXiv:2506.04818}
}
read the original abstract
Coronal dimmings are regions of transiently reduced brightness in extreme ultraviolet (EUV) and soft X-ray (SXR) emissions associated with coronal mass ejections (CMEs), providing key insights into CME initiation and early evolution. During May 2024, AR 13664 was among the most flare-productive regions in recent decades, generating 55 M-class and 12 X-class flares along with multiple Earth-directed CMEs. The rapid succession of these CMEs triggered the most intense geomagnetic storm in two decades. We study coronal dimmings from a single active region (AR 13664) and compare them with statistical dimming properties. We investigate how coronal dimming parameters - such as area, brightness, and magnetic flux - relate to key flare and CME properties. We systematically identified all flares above M1.0, all coronal dimmings and all CMEs (from the CDAW SOHO/LASCO catalogue) produced by AR 13664 during 2024 May 1 - 15, and studied the associations between the different phenomena and their characteristic parameters. We detect coronal dimmings in 22 events, with 16 occurring on-disc and six off-limb. Approximately 83% of X-class flares and 23% of M-class flares are associated with CMEs, with 13 out of 16 on-disc dimmings linked to CME activity. Our results support the strong interplay between coronal dimmings and flares, as we find increased correlations between flare and dimming parameters in this single-AR study compared to the general dimming population. Furthermore, we confirm that coronagraphic observations, unable to observe the lower corona, underestimate correlations between CME velocities and dimming parameters, as they fail to capture the early CME acceleration phase. This highlights the critical role of dimming observations in providing a more comprehensive understanding of CME dynamics.
Figures


Figures from the paper (9 more)


Reference graph
Works this paper leans on
-
[1]
Aschwanden , M. J. 2016, , 831, 105
work page 2016
-
[2]
Aschwanden , M. J. 2017, , 847, 27
work page 2017
- [3]
-
[4]
Attrill , G. D. R., van Driel-Gesztelyi , L., D \'e moulin , P., et al. 2008, , 252, 349
work page 2008
-
[5]
Attrill, G. D. R. & Wills-Davey, M. J. 2010, Solar Physics, 262, 461
work page 2010
-
[6]
M., Berkebile-Stoiser , S., Veronig , A
Bein , B. M., Berkebile-Stoiser , S., Veronig , A. M., et al. 2011, , 738, 191
work page 2011
- [7]
-
[8]
Burkepile , J. T., Hundhausen , A. J., Stanger , A. L., St. Cyr , O. C., & Seiden , J. A. 2004, Journal of Geophysical Research (Space Physics), 109, A03103
work page 2004
Show all 62 references
-
[9]
Carrington , R. C. 1859, , 20, 13
-
[10]
Chikunova , G., Dissauer , K., Podladchikova , T., & Veronig , A. M. 2020, , 896, 17
2020
-
[11]
2023, , 678, A166
Chikunova , G., Podladchikova , T., Dissauer , K., et al. 2023, , 678, A166
2023
-
[12]
M., Temmer , M., & Podladchikova , T
Dissauer , K., Veronig , A. M., Temmer , M., & Podladchikova , T. 2019, , 874, 123
2019
-
[13]
M., Temmer , M., Podladchikova , T., & Vanninathan , K
Dissauer , K., Veronig , A. M., Temmer , M., Podladchikova , T., & Vanninathan , K. 2018 a , , 855, 137
2018
-
[14]
M., Temmer , M., Podladchikova , T., & Vanninathan , K
Dissauer , K., Veronig , A. M., Temmer , M., Podladchikova , T., & Vanninathan , K. 2018 b , , 863, 169
2018
-
[15]
2009, Earth Moon and Planets, 104, 295
Gopalswamy , N., Yashiro , S., Michalek , G., et al. 2009, Earth Moon and Planets, 104, 295
2009
-
[16]
Harra , L. K. & Sterling , A. C. 2001, , 561, L215
2001
-
[17]
2025, , 979, 49
Hayakawa , H., Ebihara , Y., Mishev , A., et al. 2025, , 979, 49
2025
-
[18]
S., Acton , L
Hudson , H. S., Acton , L. W., & Freeland , S. L. 1996, , 470, 629
1996
-
[19]
Jain, S., Podladchikova, T., Chikunova, G., Dissauer, K., & Veronig, A. M. 2024, Astronomy & Astrophysics, 683, A15
2024
-
[20]
M., et al
Jain , S., Podladchikova , T., Veronig , A. M., et al. 2024, , 692, A214
2024
-
[21]
W., Green , L
James , A. W., Green , L. M., Palmerio , E., et al. 2017, , 292, 71
2017
-
[22]
M., Purkhart , S., Zhang , P., & Rempel , M
Jarolim , R., Veronig , A. M., Purkhart , S., Zhang , P., & Rempel , M. 2024, , 976, L12
2024
-
[23]
Jin , M., Cheung , M. C. M., DeRosa , M. L., et al. 2020, in IAU Symposium, Vol. 354, Solar and Stellar Magnetic Fields: Origins and Manifestations, ed. A. Kosovichev , S. Strassmeier , & M. Jardine , 426--432
2020
-
[24]
D., Chen , P
Jin , M., Ding , M. D., Chen , P. F., Fang , C., & Imada , S. 2009, , 702, 27
2009
-
[25]
K., Martinis , C., Daniell , R
Karan , D. K., Martinis , C., Daniell , R. E., et al. 2024, ESS Open Archive eprints, 428, 171805504.42893378
2024
-
[26]
2024, , 965, L5
Karimov , K., Lee , H., Jeong , H.-J., et al. 2024, , 965, L5
2024
-
[27]
D., Lynch , B
Kazachenko , M. D., Lynch , B. J., Welsch , B. T., & Sun , X. 2017, , 845, 49
2017
-
[28]
D., Manning , D., & West , M
Krista , L. D., Manning , D., & West , M. J. 2022, , 930, 165
2022
-
[29]
Krista , L. D. & Reinard , A. A. 2017, , 839, 50
2017
-
[30]
R., Title , A
Lemen , J. R., Title , A. M., Akin , D. J., et al. 2012, , 275, 17
2012
-
[31]
2021, , 917, L29
Li , T., Chen , A., Hou , Y., et al. 2021, , 917, L29
2021
-
[32]
Loyd , R. O. P., Mason , J. P., Jin , M., et al. 2022, , 936, 170
2022
-
[33]
H., Nakwacki , M
Mandrini , C. H., Nakwacki , M. S., Attrill , G., et al. 2007, , 244, 25
2007
-
[34]
P., Woods , T
Mason , J. P., Woods , T. N., Webb , D. F., et al. 2016, , 830, 20
2016
-
[35]
M., Temmer , M., M \"o stl , C., & Biernat , H
Miklenic , C., Veronig , A. M., Temmer , M., M \"o stl , C., & Biernat , H. K. 2011, , 273, 125
2011
-
[36]
Parker , W. E. & Linares , R. 2024, Journal of Spacecraft and Rockets, 61, 1412
2024
-
[37]
D., Thompson , B
Pesnell , W. D., Thompson , B. J., & Chamberlin , P. C. 2012, , 275, 3
2012
-
[38]
M., et al
Podladchikova , T., Jain , S., Veronig , A. M., et al. 2024, , 691, A344
2024
-
[39]
& Yurchyshyn , V
Qiu , J. & Yurchyshyn , V. B. 2005, , 634, L121
2005
-
[40]
Reinard , A. A. & Biesecker , D. A. 2009, , 705, 914
2009
-
[41]
2024, The Astrophysical Journal Letters, 973, L31
Romano, P., Elmhamdi, A., Marassi, A., & Contarino, L. 2024, The Astrophysical Journal Letters, 973, L31
2024
-
[42]
M., Chikunova , G., Dissauer , K., Podladchikova , T., & Veronig , A
Ronca , G. M., Chikunova , G., Dissauer , K., Podladchikova , T., & Veronig , A. M. 2024, , 691, A195
2024
-
[43]
H., Schou , J., Bush , R
Scherrer , P. H., Schou , J., Bush , R. I., et al. 2012, , 275, 207
2012
-
[44]
H., Bush , R
Schou , J., Scherrer , P. H., Bush , R. I., et al. 2012, , 275, 229
2012
-
[45]
2024, Annals of Geophysics, 67, PA218
Spogli, L., Alberti, T., Bagiacchi, P., et al. 2024, Annals of Geophysics, 67, PA218
2024
-
[46]
Sterling , A. C. & Hudson , H. S. 1997, , 491, L55
1997
-
[47]
G., Hoeksema , J
Sun , X., Bobra , M. G., Hoeksema , J. T., et al. 2015, , 804, L28
2015
-
[48]
K., Su , Y., Temmer , M., & Veronig , A
Thalmann , J. K., Su , Y., Temmer , M., & Veronig , A. M. 2015, , 801, L23
2015
-
[49]
J., Cliver , E
Thompson , B. J., Cliver , E. W., Nitta , N., Delann \'e e , C., & Delaboudini \`e re , J. P. 2000, , 27, 1431
2000
-
[50]
J., Plunkett , S
Thompson , B. J., Plunkett , S. P., Gurman , J. B., et al. 1998, , 25, 2465
1998
-
[51]
A., Shugai , Y
Vakhrusheva , A. A., Shugai , Y. S., Kaportseva , K. B., Eremeev , V. E., & Kalegaev , V. V. 2024, Geomagnetism and Aeronomy, 64, 1
2024
-
[52]
M., Dissauer , K., & Temmer , M
Vanninathan , K., Veronig , A. M., Dissauer , K., & Temmer , M. 2018, , 857, 62
2018
-
[53]
M., Dissauer , K., Kliem , B., et al
Veronig , A. M., Dissauer , K., Kliem , B., et al. 2025, Living Reviews in Solar Physics, under review
2025
-
[54]
M., G \"o m \"o ry , P., Dissauer , K., Temmer , M., & Vanninathan , K
Veronig , A. M., G \"o m \"o ry , P., Dissauer , K., Temmer , M., & Vanninathan , K. 2019, , 879, 85
2019
-
[55]
M., Odert , P., Leitzinger , M., et al
Veronig , A. M., Odert , P., Leitzinger , M., et al. 2021, Nature Astronomy, 5, 697
2021
-
[56]
Veronig , A. M. & Polanec , W. 2015, , 290, 2923
2015
-
[57]
Wall, J. V. & Jenkins, C. R. 2012, Practical Statistics for Astronomers (Cambridge University Press)
2012
-
[58]
Yashiro, S., Akiyama, S., Gopalswamy, N., & Howard, R. A. 2006, The Astrophysical Journal, 650, L143
2006
-
[59]
2004, Journal of Geophysical Research (Space Physics), 109, A07105
Yashiro , S., Gopalswamy , N., Michalek , G., et al. 2004, Journal of Geophysical Research (Space Physics), 109, A07105
2004
-
[60]
M., Sterling, A
Zarro, D. M., Sterling, A. C., Thompson, B. J., Hudson, H. S., & Nitta, N. 1999, , 520, L139
1999
-
[61]
, " * write output.state after.block = add.period write newline
ENTRY address archiveprefix author booktitle chapter edition editor howpublished institution eprint journal key month note number organization pages publisher school series title type volume year label extra.label sort.label short.list INTEGERS output.state before.all mid.sent...
-
[62]
write newline
" write newline "" before.all 'output.state := FUNCTION n.dashify 't := "" t empty not t #1 #1 substring "-" = t #1 #2 substring "--" = not "--" * t #2 global.max substring 't := t #1 #1 substring "-" = "-" * t #2 global.max substring 't := while if t #1 #1 substring * t #2 gl...
Reviewed August 7, 2026 · model on record in the stance chip above.
Discussion (0). Continue with ORCID to comment.