REVIEW 5 major objections 5 minor 51 references
Know Unreported Roadway Incidents in Real-time: Early Traffic Anomaly Detection
T0 review · 5 major / 5 minor · reviewed 2026-08-11 · deepseek-v4-flash
Pith's one-line read A deep learning system that learns to flag roadway anomalies before they are reported.
desk verdict A genuinely useful labeling pipeline for traffic anomaly detection, but the evaluation is circular: labels, FAR, and significant-incident definitions all derive from the same slowdown-speed input, so the headline early-detection claim is unverified. read the letter →
The pith
A machine-rendered reading of the paper's core claim, the machinery that carries it, and where it could break.
The reading
What carries the argument
The load-bearing object is the slowdown speed of a segment, defined as the positive difference between the average speed of upstream segments and the segment's own speed. It is used as a prior-knowledge filter in a two-step labeling algorithm: incident reports are kept as anomaly labels only if a slowdown-speed threshold is exceeded somewhere in their time window, and prolonged slowdown events without any report are added as unreported anomalies. Ahead-labeling then extends each anomaly window 15 minutes backward so early-stage features enter training. The prediction model is a per-segment sequence-to-sequence Transformer/GraphTrans that maps the past hour of sub-graph traffic, weather, and time features onto anomaly status for the next six 5-minute steps, trained with weighted binary cross-entropy, teacher forcing, sliding windows applied after chronological splits, and a separately tuned alert threshold.
What would settle it
On a short segment where incidents typically start at the segment's beginning, compute the overlap between top slowdown-speed timestamps and independently verified incident times; if the overlap falls far below the reported 60 percent and the model's mean time to detection turns positive, the early-detection claim is refuted. A lead over camera-confirmed onset times, rather than report times, would be the cleaner confirmation that the alerts are genuinely predictive.
Extended reading notes
Core claim
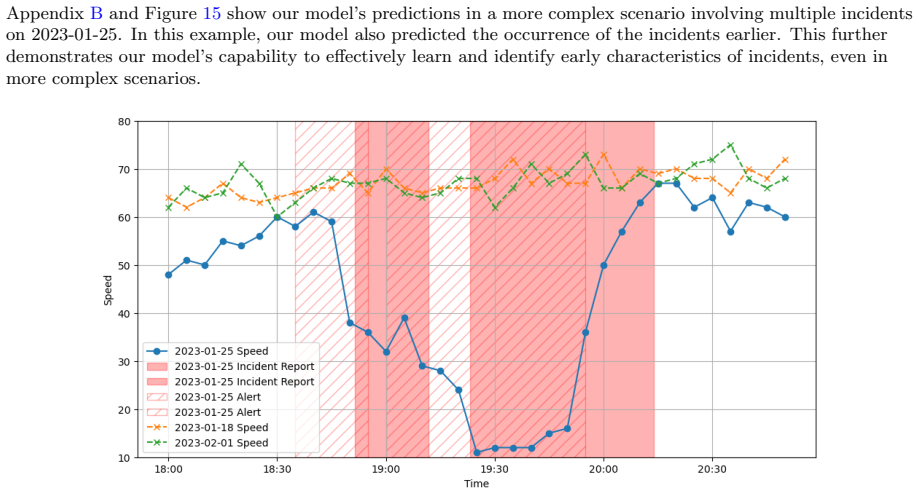
On its own terms, the paper establishes that early anomaly detection is learnable from probe speed and weather data without relying on incident reports as ground truth. The central empirical claim is that the proposed framework, trained with prior-knowledge-denoised labels and multi-step prediction, detects or predicts incidents before they appear in any report: across all ten test segments the mean time to detection relative to report time is negative, and alerts arrive 5–42 minutes earlier than Waze reports. The paper further claims that the model detects significant incidents at nearly perfect rate while keeping false alarm rates low, and that the denoised labels make training converge where raw incident-report labels do not. The authors interpret negative MTTD as evidence that the model has learned early-stage spatial signatures—upstream and downstream speeds—that precede both the report and the visible speed drop on the target segment.
Load-bearing premise
The whole pipeline assumes that a large slowdown speed—the gap between upstream traffic speed and the segment's own speed—reliably marks real, significant anomalies, and the authors note this holds only for relatively long segments where incidents do not start at the segment's beginning; where that correlation is weak, the generated labels and hence the model are built on a biased signal.
Editorial extensions
If this is right
- Incident alerts can be issued before any human or crowdsourced report exists, giving operators 5–42 minutes of lead time on the tested segments.
- Training on denoised anomaly labels rather than raw incident reports makes deep models converge and outperform statistical, SVM, GAN, and autoencoder baselines in F1 and false alarm rate.
- The method transfers across two different road networks using only data sources that cover most major roads, so it can be deployed without new detectors or manual report filtering.
- Ahead-labeling shortens mean time to detection in 8 of 10 test cases, at the cost of a small increase in false alarms.
- A shared-decoder multi-step formulation lets a single model issue alerts for a rolling half-hour horizon, a form of prediction rather than only now-casting.
Reading between the lines
- If the slowdown-speed prior is as transferable as the paper suggests, the same label-denoising recipe could be applied to other anomaly domains with a cheap spatial proxy—for example, water or power network disruptions detected through pressure or voltage differentials.
- The negative MTTD claims are measured against report times, not true incident onset; verifying against independently camera-confirmed onset times would determine how much of the lead time is real anticipation versus reporting latency.
- The per-segment model design trades global transferability for simplicity; a single network-wide model that shares the slowdown-speed prior might extend the method to segments with very few incidents, which the paper identifies as a gap.
Editorial analysis
A structured set of objections, weighed in public.
Referee Report
Summary. This paper proposes a framework for early detection/prediction of traffic anomalies using widely available probe-vehicle speed data, incident reports, and weather. The authors generate 'anomaly labels' from a slowdown-speed threshold (Algorithm 1) and extend them backward in time (Algorithm 2), then train per-segment sequence-to-sequence models (Transformer/GraphTrans) to predict these labels up to 30 minutes ahead. On ten segments in Maryland and Pennsylvania, they report negative mean time to detection (MTTD) relative to Waze reports, significant-incident detection rates DR(S) near 1, and low false alarm rates (FAR), concluding that their model alerts 5–42 minutes earlier than Waze reports.
Significance. If the reported results were obtained against independent ground truth, the framework would be practically valuable: it uses low-cost, ubiquitous data, is fully automated, and explicitly addresses delayed and missing incident reports. The paper also takes care to avoid train-test contamination in sliding-window construction and includes a sensitivity analysis of the labeling threshold. However, the evaluation is circular: the ground-truth labels for both training and testing are derived from the same slowdown-speed feature that is a model input, and the false-alarm definition counts any alarm matching those generated labels as a true positive. Consequently, the headline early-detection claim is not supported by the presented evidence.
major comments (5)
- [§4.2, Algorithm 1; §4.5; Eq. (13)] The anomaly labels used for both training and evaluation are generated from the slowdown speed SD_i(t) defined in Eq. (4), which is also a direct input feature of the model (Section 4.1/4.5). Eq. (13) counts an alarm as false only if it overlaps neither an incident report nor a generated anomaly label. A trivial detector that raises an alarm whenever SD_i(t) exceeds the Algorithm 1 percentile threshold would, by construction, match most generated labels and yield high DR(S), low FAR, and negative MTTD relative to delayed Waze reports, without detecting any real unreported incident. The headline results in Table 4 are therefore not evidence of early detection of actual anomalies. An independent ground truth (e.g., verified incident logs, camera/operator records, or a public benchmark such as the cited FT-AED dataset) is needed to validate both the labels and the detection timeliness.
- [§4.3, Algorithm 2; §5.3; §6] Ahead labeling extends every anomaly label backward by θ_ahead = 3 steps (15 minutes) before training. Because MTTD is measured against the start of Waze reports (Eq. 12) and the evaluation uses the same ahead-extended labels to define significant incidents (Eqs. 14–15), the model is trained to fire exactly in the extended pre-report window. The conclusion that the model 'alerts 5–42 min earlier than Waze reports' therefore follows by construction from the label definition; it does not demonstrate that the model detects an anomaly before it actually occurs or before it is observable in the input features. Timeliness should be re-evaluated against the actual onset of the anomaly (e.g., verified incident time) rather than against the generated labels.
- [§6 (Conclusion)] The authors concede that they 'mainly chose edges with a high correlation between the occurrence of incidents and high slowdown speeds,' and that this correlation requires relatively long segments with incidents not at the segment start. Since the labeling algorithm is based on that same correlation, the selected ten segments are exactly those where the labeling assumption is most favorable. The stated generalizability to 'any size of road segments' (Section 1) is therefore unsupported; results on segments lacking the high correlation, or an alternative labeling mechanism not derived from the model's input features, are needed.
- [§5.3, Table 4] The learned baselines (SVM, GAN, TSSAE) are trained on raw incident-report labels, while Ours is trained on the generated anomaly labels. The paper itself observes (Section 5.3) that models trained on incident reports often fail to converge. Thus the comparison largely reflects label quality rather than model architecture. A baseline using the same generated labels and the same input features—e.g., a simple threshold on SD_i(t) or a standard classifier trained on the same labels—should be included to isolate the contribution of the proposed deep learning framework.
- [Eq. (13)] The false alarm rate is not a conventional false alarm rate. The numerator counts alarms that do not overlap any incident report or generated anomaly label, and the denominator is the total number of alarms. A model that never triggers has FAR = 0, which is why several baselines in Table 4 with DR = 0 also show FAR = 0. The paper should report a per-time-step false positive rate (e.g., the fraction of non-anomaly time steps with alarms) or precision against independent ground truth.
minor comments (5)
- [§4.3, Algorithm 2] The pseudocode's first loop uses 'AANi(p,:q) = 1' for q=1,...,θ_ahead−1, which appears to set a slice from the start rather than the intended q−θ_ahead:q window; the second loop also sets AANi(p,q−θ_ahead:q)=1. Please clarify the exact semantics and loop bounds.
- [§4.2 vs §4.3] The text in §4.2 says the prediction interval is 5 minutes, while §4.3 says the prediction interval is 15 minutes; Algorithm 2 uses θ_ahead=3. Please make the temporal units consistent throughout.
- [§6 vs Table 4] The conclusion states alerts are 5–42 minutes earlier than Waze reports, but Table 4 shows MTTD values of -4 to -42 for Ours(a), i.e., 4–42 minutes; the range should be reconciled with the table.
- [Eq. (1) vs Eq. (12)] Equation (12) uses N_detected_incident while Eq. (1) used N_detected; standardize the notation for the number of detected incidents.
- [Table 4] Table 4 contains unusual symbols and crossed-out entries whose meaning is only partially explained; consider a more readable layout with a legend for the strikethrough criteria.
Circularity Check
Headline metrics are scored against labels generated from the same slowdown-speed input the model receives; a threshold baseline on SD could reproduce the near-zero FAR and negative MTTD, so the early-detection claim is unverified.
-
self definitional
[Section 3.2 Eq. (4); Section 4.2 Algorithm 1 (Step 0)]
"Given that traffic flow data often requires additional detectors and is not widely available, we use the slowdown speed described in Equation (4) as the prior knowledge to infer whether an incident report corresponds to a traffic anomaly. ... obtain the abnormal slowdown speed threshold: θiSD = Percentile(vec(SDi), n); compute the abnormal slowdown speed binary matrix: ASDi(p,q) = I(SDi(p,q) ≥ θiSD)"
The anomaly labels used as training targets are built from thresholding SD_i(t), which is itself one of the engineered input features (Section 3.2 defines SD; Sections 4.1 and 4.5 feed sub-graph traffic status into the encoder). Thus the target variable is a deterministic function of a model input feature. The paper's disclaimer that 'the model is not trained to detect abnormal slowdown speeds' does not break the loop: ASD events that are prolonged or overlap incident reports are exactly what enters the label, so a threshold classifier on SD reproduces the labels by construction. The Conclusion further admits that segments were chosen for high SD-incident correlation, making such a threshold baseline particularly favorable.
-
self definitional
[Section 5.3.3, Eqs. (13)-(15)]
"The numerator of FAR has been changed from the number of alarms not coinciding with any incident reports to the number of alarms not coinciding with any incident reports or anomalies. The anomalies here are those generated using the anomaly labels described in Section 4.2."
FAR, DR(S), and MTTD(S) are evaluated against the same generated labels that were used for training. Because those labels are threshold functions of the SD input, any alarm that coincides with an SD-threshold event is automatically counted as a true positive rather than a false alarm. Consequently, near-zero FAR and DR(S)=1 for 'significant' incidents are largely assured by the evaluation definition, not by independent evidence that unreported incidents were detected. The final comparison to Waze report times is the only external anchor, but true-positive significance is still defined by the internal labels.
1 more flagged steps
-
self definitional
[Section 4.3 Algorithm 2; Section 5.3.3 Table 4]
"Therefore, we label anomalies starting from a few time steps prior to the reported incident/anomaly time to supplement the lack of early characteristics in the anomaly samples. For example, an anomaly from 7:30 a.m. to 8:30 a.m. can be ahead-labeled by 15 minutes to become from 7:15 a.m. to 8:30 a.m."
The 15-minute backward extension of every anomaly label is inserted into the training target before the model is trained and before the test metrics are computed. Since FAR counts alarms overlapping these ahead-labeled anomalies as true, and MTTD is measured from the Waze report start, the negative MTTD values and the claimed 5-42 minute advance are at least partly baked into the label definition rather than established against an independent ground truth. No external incident logs or public benchmark are used to verify that the early alarms correspond to real unreported incidents.
full rationale
The circularity here is not a self-citation chain; it is definitional. Algorithm 1 constructs the anomaly ground truth from a percentile threshold on SD_i(t) (Eq. 4), and SD is also an engineered input feature fed into the sub-graph encoder. Algorithm 2 then extends every positive label 15 minutes backward, injecting the 'early' advantage into the target. The evaluation in Section 5.3.3 then scores FAR, DR(S), and MTTD(S) against exactly these generated labels, so the reported near-zero FAR and DR(S)=1 are largely consequences of the evaluation definition. A model that simply raised alerts when current or recent SD exceeded the Algorithm 1 threshold would match the labels and could reproduce the headline results on segments deliberately chosen for high SD-incident correlation, as the Conclusion concedes. The comparison with Waze report times provides only a weak external anchor, because the definition of a true positive is still determined by the internally generated labels. Without independent incident logs or a public benchmark such as the cited FT-AED dataset, the central early-detection claim cannot be distinguished from the model's own label generator. Score 8, not 10, because the model does use additional spatiotemporal features and Waze report times are external, but the central evaluation loop reduces by definition to the slowdown-speed threshold.
Assumptions & free parameters
free parameters (7)
- slowdown speed percentile n =
adjusted per segment via alpha in Algorithm 1; specific values not reported
- removal percentage threshold theta1 =
default 0.6
- addition percentage threshold theta2 =
default 1.0
- minimum anomaly duration theta_t =
default 3 (15 min)
- ahead-labeling duration theta_ahead =
default 3 (15 min)
- anomaly weight w_ano in WBCE loss =
default ratio of negative to positive samples; further adjusted
- alert threshold tau =
tuned per segment on tuning set, range ~0.4-0.7
assumptions (4)
- domain assumption A significant traffic incident produces a significant slowdown speed on the target or upstream links (shock-wave theory).
- domain assumption Probe-vehicle speed data (INRIX) are complete and accurate enough after imputation to reflect traffic states.
- domain assumption Recurrent speed baselines (same weekday, past 3 weeks, excluding incident reports) are stable references for defining anomalies.
- domain assumption Multi-step sequence-to-sequence models can learn early-stage incident features from the generated labels.
Cite this review
Pith. "Pith review of Know Unreported Roadway Incidents in Real-time: Early Traffic Anomaly Detection." pith.science (2026). https://pith.science/paper/E6REIXPW
@misc{pith2026241210892,
  author       = {Pith},
  title        = {Pith review of: Know Unreported Roadway Incidents in Real-time: Early Traffic Anomaly Detection},
  year         = {2026},
  howpublished = {\url{https://pith.science/paper/E6REIXPW}},
  note         = {Machine review of arXiv:2412.10892}
}
read the original abstract
This research aims to know traffic anomalies as early as possible. A traffic anomaly refers to a generic incident on the road that influences traffic flow and calls for urgent traffic management measures. `Knowing'' the occurrence of a traffic anomaly is twofold: the ability to detect this anomaly before it is reported anywhere, or it may be such that an anomaly can be predicted before it actually occurs on the road (e.g., non-recurrent traffic breakdown). In either way, the objective is to inform traffic operators of unreported incidents in real time and as early as possible. The key is to stay ahead of the curve. Time is of the essence. Conventional automatic incident detection (AID) methods often struggle with early detection due to their limited consideration of spatial effects and early-stage characteristics. Therefore, we propose a deep learning framework utilizing prior domain knowledge and model-designing strategies. This allows the model to detect a broader range of anomalies, not only incidents that significantly influence traffic flow but also early characteristics of incidents along with historically unreported anomalies. We specially design the model to target the early-stage detection/prediction of an incident. Additionally, unlike most conventional AID studies, our method is highly scalable and generalizable, as it is fully automated with no manual selection of historical reports required, relies solely on widely available low-cost data, and requires no additional detectors. The experimental results across numerous road segments on different maps demonstrate that our model leads to more effective and early anomaly detection.
Figures


Figures from the paper (14 more)




Reference graph
Works this paper leans on
-
[1]
Abdulhai, B., & Ritchie, S. G. (1999). Enhancing the universality and transferability of freeway incident detection using a bayesian-based neural network. Transportation Research Part C: Emerging Technologies, 7 (5), 261–280
work page 1999
-
[2]
Ahmed, F., & Hawas, Y. (2015). An integrated real-time traffic signal system for transit signal priority, incident detection and congestion management. Transportation Research Part C: Emerging Technologies, 60 , 52–76
work page 2015
-
[3]
Ahmed, S. A., & Cook, A. R. (1982). Application of time-series analysis techniques to freeway incident detection. Transportation Research Record, 841 (3), 19–21
work page 1982
-
[4]
Asakura, Y., Kusakabe, T., Nguyen, L. X., & Ushiki, T. (2017). Incident detection methods using probe vehicles with on-board gps equipment. Transportation research part C: emerging technologies, 81 , 330–341
work page 2017
-
[5]
Bahdanau, D., Cho, K., & Bengio, Y. (2014). Neural machine translation by jointly learning to align and translate. arXiv preprint arXiv:1409.0473
arXiv 2014
-
[6]
Balke, K., Dudek, C. L., & Mountain, C. E. (1996). Using probe-measured travel times to detect major freeway incidents in houston, texas. Transportation Research Record, 1554 (1), 213–220
work page 1996
-
[7]
Chakraborty, P., Hegde, C., & Sharma, A. (2019). Data-driven parallelizable traffic incident detection using spatio-temporally denoised robust thresholds. Transportation research part C: emerging technologies, 105 , 81–99
work page 2019
-
[8]
Chakraborty, P., Sharma, A., & Hegde, C. (2018). Freeway traffic incident detection from cameras: A semi-supervised learning approach. In 2018 21st international conference on intelligent transportation systems (itsc) (pp. 1840–1845)
work page 2018
Show all 51 references
-
[9]
L., & Ritchie, S
Cheu, R. L., & Ritchie, S. G. (1995). Automated detection of lane-blocking freeway incidents using artificial neural networks. Transportation Research Part C: Emerging Technologies, 3 (6), 371–388
1995
-
[10]
L., & Tay, G
Cheu, R. L., & Tay, G. C. W. (2004). Sampling strategies for probe-vehicle-based freeway incident detection algorithms. Transportation research record, 1867 (1), 80–88
2004
-
[11]
Coursey, A., Ji, J., Quinones Grueiro, M., Barbour, W., Zhang, Y., Derr, T., . . . Work, D. (2024). Ft-aed: Benchmark dataset for early freeway traffic anomalous event detection. Advances in Neural Information Processing Systems , 37 , 15526–15549
2024
-
[12]
Dia, H., & Rose, G. (1997). Development and evaluation of neural network freeway incident detection models using field data. Transportation Research Part C: Emerging Technologies, 5 (5), 313–331
1997
-
[13]
L., Messer, C
Dudek, C. L., Messer, C. J., & Nuckles, N. B. (1974). Incident detection on urban freeways. Transportation research record, 495 , 12–24
1974
-
[14]
ElSahly, O., & Abdelfatah, A. (2022). A systematic review of traffic incident detection algorithms. Sustainability, 14 (22), 14859. Federal Highway Administration (FHW A). (2020a). Process for establishing, implementing, and institutionalizing a traffic incident management per...
2022
-
[15]
Bengio, Y
Goodfellow, I., Pouget-Abadie, J., Mirza, M., Xu, B., Warde-Farley, D., Ozair, S., . . . Bengio, Y. (2014). Generative adversarial nets. Advances in neural information processing systems , 27
2014
-
[16]
Grigorev, A., Mih˘ ait ¸˘ a, A.-S., Saleh, K., & Chen, F. (2024). Automatic accident detection, segmentation and duration prediction using machine learning. IEEE Transactions on Intelligent Transportation Systems, 25 (2), 1547-1568. DOI: 10.1109/TITS.2023.3323636
2024
-
[17]
S., & Chen, F
Gu, Y., Qian, Z. S., & Chen, F. (2016). From twitter to detector: Real-time traffic incident detection using social media data. Transportation research part C: emerging technologies, 67 , 321–342
2016
-
[18]
C., Li, X., & Sun, W
Han, X., Grubenmann, T., Cheng, R., Wong, S. C., Li, X., & Sun, W. (2020). Traffic incident detection: A trajectory-based approach. In 2020 ieee 36th international conference on data engineering (icde) (pp. 1866–1869)
2020
-
[19]
H., & Friedman, J
Hastie, T., Tibshirani, R., Friedman, J. H., & Friedman, J. H. (2009). The elements of statistical learning: data mining, inference, and prediction (Vol. 2). Springer
2009
-
[20]
He, D., Kim, J., Shi, H., & Ruan, B. (2023). Autonomous anomaly detection on traffic flow time series 33 with reinforcement learning. Transportation Research Part C: Emerging Technologies, 150 , 104089
2023
-
[21]
L., & Srinivasan, D
Jin, X., Cheu, R. L., & Srinivasan, D. (2002). Development and adaptation of constructive probabilistic neural network in freeway incident detection. Transportation Research Part C: Emerging Technologies, 10 (2), 121–147
2002
-
[22]
Karim, A., & Adeli, H. (2002). Incident detection algorithm using wavelet energy representation of traffic patterns. Journal of Transportation Engineering , 128 (3), 232–242
2002
-
[23]
Liu, T.-Y
Ke, G., Meng, Q., Finley, T., Wang, T., Chen, W., Ma, W., . . . Liu, T.-Y. (2017). Lightgbm: A highly efficient gradient boosting decision tree. Advances in neural information processing systems , 30
2017
-
[24]
Ke, Z., Duan, H., & Qian, S. (2024). Interpretable mixture of experts for time series prediction under recurrent and non-recurrent conditions. arXiv preprint arXiv:2409.03282
2024 arXiv
-
[25]
Ke, Z., Zou, Q., Liu, J., & Qian, S. (2024). Real-time system optimal traffic routing under uncertainties–can physics models boost reinforcement learning? arXiv preprint arXiv:2407.07364
2024 arXiv
-
[26]
Ki, Y.-K., & Lee, D.-Y. (2007). A traffic accident recording and reporting model at intersections. IEEE Transactions on Intelligent Transportation Systems , 8 (2), 188–194
2007
-
[27]
Li, L., Lin, Y., Du, B., Yang, F., & Ran, B. (2022). Real-time traffic incident detection based on a hybrid deep learning model. Transportmetrica A: transport science, 18 (1), 78–98
2022
-
[28]
Lin, Y., Li, L., Jing, H., Ran, B., & Sun, D. (2020). Automated traffic incident detection with a smaller dataset based on generative adversarial networks. Accident Analysis & Prevention , 144 , 105628
2020
-
[29]
Pan, D. (2022). Development of incident detection algorithms compatible with low temporal-resolution traffic detectors and limited incident data (Unpublished doctoral dissertation). The George Washington University
2022
-
[30]
Parkany, E., & Xie, C. (2005). A complete review of incident detection algorithms & their deployment: What works and what doesn ’t (Technical Report No. NETCR37). New England Transportation Consortium. Retrieved from https://onlinepubs.trb.org/onlinepubs/trispdfs/00988875.pdf
2005
-
[31]
B., Movahedi, A., Taghipour, H., Derrible, S., & Mohammadian, A
Parsa, A. B., Movahedi, A., Taghipour, H., Derrible, S., & Mohammadian, A. K. (2020). Toward safer highways, application of xgboost and shap for real-time accident detection and feature analysis. Accident Analysis & Prevention , 136 , 105405
2020
-
[32]
J., & Tignor, S
Payne, H. J., & Tignor, S. C. (1978). Freeway incident-detection algorithms based on decision trees with states. Transportation Research Record(682)
1978
-
[33]
N., & Hall, F
Persaud, B. N., & Hall, F. L. (1989). Catastrophe theory and patterns in 30-second freeway traffic data—implications for incident detection. Transportation Research Part A: General , 23 (2), 103–113
1989
-
[34]
F., Noeimi, H., Sanwal, K., Rydzewski, D., Skabardonis, A., Varaiya, P., & Al-Deek, H
Petty, K. F., Noeimi, H., Sanwal, K., Rydzewski, D., Skabardonis, A., Varaiya, P., & Al-Deek, H. (1996). The freeway service patrol evaluation project: Database support programs, and accessibility. Transportation Research Part C: Emerging Technologies, 4 (2), 71–85
1996
-
[35]
W., & Koppelman, F
Sermons, M. W., & Koppelman, F. S. (1996). Use of vehicle positioning data for arterial incident detection. Transportation Research Part C: Emerging Technologies, 4 (2), 87–96
1996
-
[36]
S., & Schofer, J
Sethi, V., Bhandari, N., Koppelman, F. S., & Schofer, J. L. (1995). Arterial incident detection using fixed detector and probe vehicle data. Transportation Research Part C: Emerging Technologies, 3 (2), 99–112
1995
-
[37]
Sheu, J.-B. (2002). A stochastic optimal control approach to real-time, incident-responsive traffic signal control at isolated intersections. Transportation Science, 36 (4), 418–434
2002
-
[38]
Singh, D., & Mohan, C. K. (2018). Deep spatio-temporal representation for detection of road accidents using stacked autoencoder. IEEE Transactions on Intelligent Transportation Systems , 20 (3), 879–887
2018
-
[39]
J., & Chassiakos, A
Stephanedes, Y. J., & Chassiakos, A. P. (1993). Application of filtering techniques for incident detection. Journal of transportation engineering , 119 (1), 13–26
1993
-
[40]
Sutskever, I., Vinyals, O., & Le, Q. V. (2014). Sequence to sequence learning with neural networks. Advances in neural information processing systems , 27 . Taheri Sarteshnizi, I., Bagloee, S. A., Sarvi, M., & Nassir, N. (2024). Traffic anomaly detection: Exploiting temporal p...
2014
-
[41]
Turner, B., Breen, J., & Howard, E. (2015). Road safety manual: a manual for practitioners and decision makers on implementing safe system infrastructure. https://roadsafety.piarc.org/ en/road-safety-management-safety-data/quality-and-under-reporting
2015
-
[42]
Vapnik, V. (2013). The nature of statistical learning theory . Springer science & business media. 34
2013
-
[43]
Vaswani, A., Shazeer, N., Parmar, N., Uszkoreit, J., Jones, L., Gomez, A. N., . . . Polosukhin, I. (2017). Attention is all you need. Advances in neural information processing systems , 30
2017
-
[44]
J., & Zipser, D
Williams, R. J., & Zipser, D. (1989). A learning algorithm for continually running fully recurrent neural networks. Neural computation, 1 (2), 270–280
1989
-
[45]
Wirasinghe, S. C. (1978). Determination of traffic delays from shock-wave analysis. Transportation Research, 12 (5), 343–348
1978
-
[46]
E., & Stoica, I
Wu, Z., Jain, P., Wright, M., Mirhoseini, A., Gonzalez, J. E., & Stoica, I. (2021). Representing long-range context for graph neural networks with global attention. Advances in Neural Information Processing Systems , 34 , 13266–13279
2021
-
[47]
Xie, Q., Guo, T., Chen, Y., Xiao, Y., Wang, X., & Zhao, B. Y. (2020). Deep graph convolutional networks for incident-driven traffic speed prediction. In Proceedings of the 29th acm international conference on information & knowledge management (pp. 1665–1674)
2020
-
[48]
Yao, W., & Qian, S. (2020). Learning to recommend signal plans under incidents with real-time traffic prediction. Transportation Research Record, 2674 (6), 45-59. Retrieved from https://doi.org/10.1177/0361198120917668 DOI: 10.1177/0361198120917668
2020 doi
-
[49]
Yuan, F., & Cheu, R. L. (2003). Incident detection using support vector machines. Transportation Research Part C: Emerging Technologies , 11 (3-4), 309–328
2003
-
[50]
Zhang, Z., He, Q., Gao, J., & Ni, M. (2018). A deep learning approach for detecting traffic accidents from social media data. Transportation research part C: emerging technologies, 86 , 580–596
2018
-
[51]
Zhu, W., Wu, J., Fu, T., Wang, J., Zhang, J., & Shangguan, Q. (2021). Dynamic prediction of traffic incident duration on urban expressways: A deep learning approach based on lstm and mlp. Journal of intelligent and connected vehicles , 4 (2), 80–91. 35 A Prediction/Detection E...
2021
Reviewed August 11, 2026 · model on record in the stance chip above.
Discussion (0). Continue with ORCID to comment.