REVIEW 3 major objections 3 minor 3 cited by
On the Average Ultraviolet Emission Line Spectra of High-Redshift Galaxies: Hot and Cold, Carbon-poor, Nitrogen-modest, and Oozing Ionizing Photons
T0 review · 3 major / 3 minor · reviewed 2026-08-12 · deepseek-v4-flash
Pith's one-line read The average star-forming galaxy at redshifts 4–10 has electron temperatures of 14,000–21,000 K from [O III] lines but only 8,000–13,000 K from the Balmer jump, a discrepancy that undermines abundance measurements.
desk verdict First stacked z>4 UV-line spectra from ~1000 galaxies; the 40% [O III]/Balmer-jump temperature gap is the real news, but the abundance claims lean on an assumed density. read the letter →
The pith
A machine-rendered reading of the paper's core claim, the machinery that carries it, and where it could break.
The reading
What carries the argument
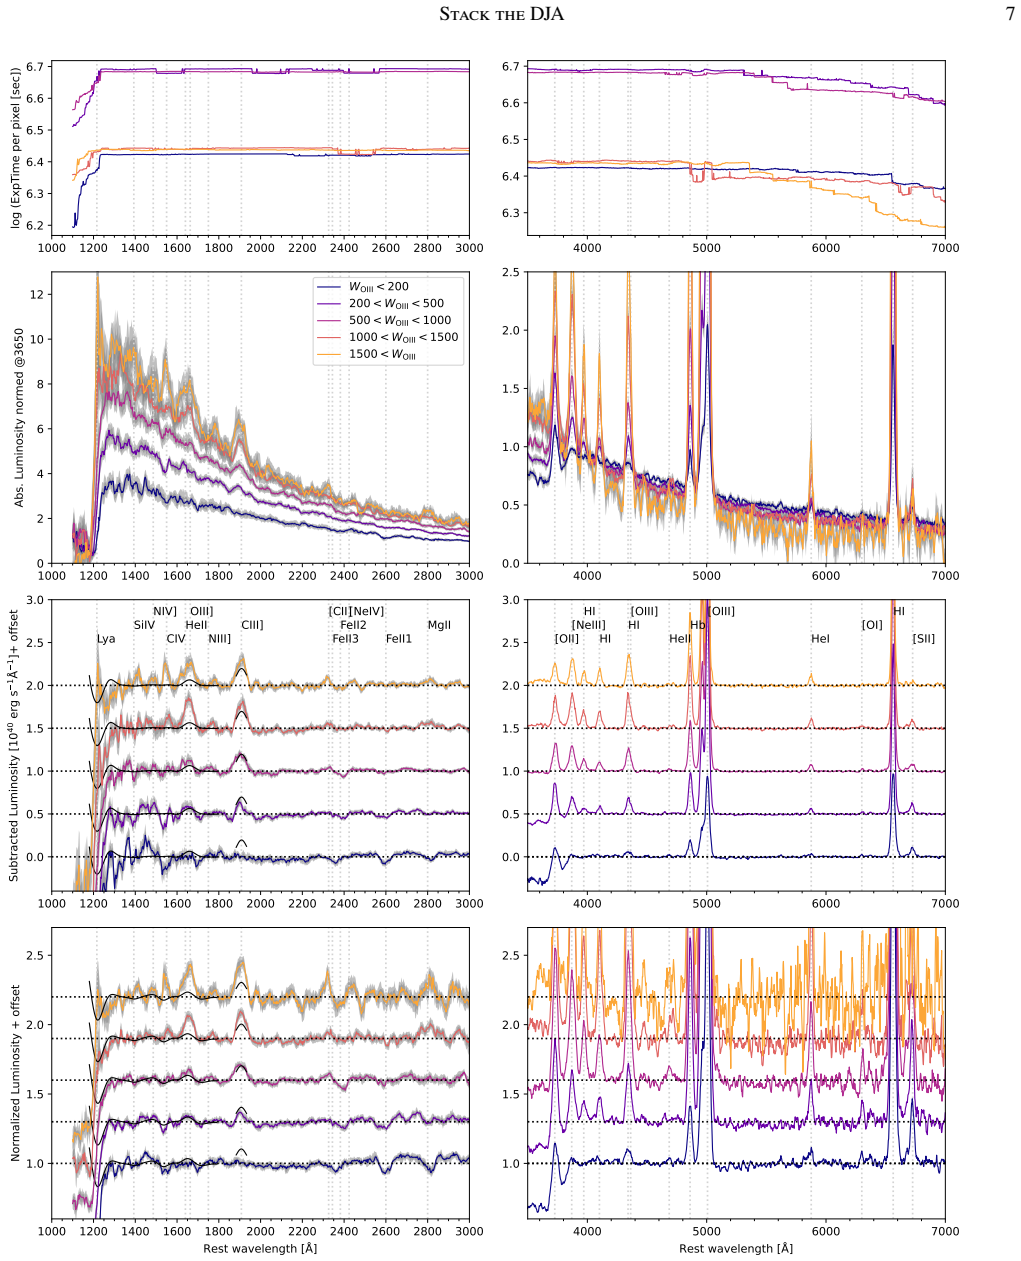
The central machinery is the stacked rest-frame spectrum: roughly 1,000 galaxies divided into five bins of [O III] λ5008 equivalent width, co-added to reach exposure times of several million seconds per pixel. This depth reveals weak UV lines and the nebular Balmer jump in the average galaxy, enabling two independent electron-temperature measurements: the collisionally excited [O III] 5008/1666 ratio (plus 5008/4363 in three stacks) and the Balmer jump amplitude, modeled with a combined stellar-plus-nebular continuum fit. The temperature discrepancy between these two thermometers is the load-bearing result that feeds the abundance analysis.
What would settle it
Measure the density-sensitive doublet ratios [O II] λ3726/3729 or [S II] λ6717/6731 in a sample of z ≈ 4–10 galaxies with medium-resolution NIRSpec gratings (or JWST/NIRSpec at R~1000) to determine the electron density. If the true density is near $10^{6}$ $cm^{-3}$, the [O III]-based temperatures would drop by ~20%, the 40% discrepancy with the Balmer jump would largely vanish, and the reported nitrogen enhancement would disappear; if densities are indeed ~250 $cm^{-3}$, the discrepancy is real and one of the thermometers is biased.
Extended reading notes
Core claim
In the average z=4–10 star-forming galaxy, the electron temperature measured from the collisionally excited [O III] 5008/1666 ratio is 14,000–21,000 K, whereas the Balmer jump measured from the hydrogen recombination continuum gives 8,000–13,000 K. After applying a standard temperature-zone correction for the cooler O+ region, the two estimates still disagree by about 40%. The paper argues this offset is not explained by dust attenuation, recombination physics, or the adopted density, and concludes that either the collisional or the recombination-based thermometer is biased in these systems. It then uses the [O III] temperatures to derive oxygen, carbon, and nitrogen abundances, finding log(C/O) ≈ −1 with no evolution across metallicity or age, and N/O mildly above local starbursts but below the extreme 'nitrogen-loud' galaxies. The most intense starbursts show ionizing photon production efficiencies reaching $10^{25}$.7 Hz/erg and multiple independent signatures of Lyman continuum escape, including near-complete Mg II escape and large [S II] deficits.
Load-bearing premise
The assumed electron density of 250 $cm^{-3}$, which cannot be measured from the low-resolution prism spectra, drives the [O III] temperature and all derived oxygen, carbon, and nitrogen abundances; the paper shows that a density of $10^{6}$ $cm^{-3}$ removes the temperature discrepancy and shifts the nitrogen points onto the local relation.
Editorial extensions
If this is right
- If the temperature discrepancy is real, all high-redshift abundances derived from the [O III] temperature scale (e.g., 12+log(O/H), C/O, N/O) are systematically biased, potentially reconciling some disagreements between early- and late-universe metallicity measurements.
- The Balmer jump is a reliable, recombination-based thermometer even in unresolved prism spectra, offering a path to measure gas temperatures without the density and collisional assumptions that plague forbidden-line ratios.
- The finding that log(C/O) ≈ −1 with no evolution means that carbon production lags oxygen in the first billion years, requiring star-formation histories or IMFs that delay carbon enrichment.
- Mild nitrogen enhancement in the average galaxy implies the same processes seen in extreme 'nitrogen-loud' galaxies (very massive stars, dense clusters) are common but at lower intensity, ruling out rare exotic events like tidal disruptions as the primary cause.
- If the highest-[O III] stacks really leak LyC with f_esc ~ 5–10% or more, these galaxies could sustain reionization, and the [S II] deficit and Mg II escape diagnostics can be used to identify similar leakers at lower redshift.
Reading between the lines
- A direct measurement of the electron density in these galaxies (e.g., via [O II] 3726/3729 or [S II] 6717/6731 with higher-resolution JWST gratings or ALMA) would settle whether the temperature discrepancy is an artifact; the paper shows that n_e = 10^6 cm^-3 removes the discrepancy and brings N/O onto the local relation.
- The 40% temperature gap might reflect a bimodal temperature distribution in the ISM (hot, low-metallicity, high-ionization regions vs. cooler, denser gas), which would make single-temperature abundance derivations invalid and could explain the C/O and N/O patterns.
- If the Balmer jump temperature is the correct one, then oxygen abundances in the early universe may be higher than currently reported, which would flatten the mass-metallicity relation and ease the tension with chemical evolution models.
- The same stacking technique could be applied to medium-resolution grating data for a subset of these galaxies to test whether the assumed density and the fitted line widths change the conclusions.
Signed reviews
Editorial analysis
A structured set of objections, weighed in public.
Referee Report
Summary. The paper co-adds ~1000 z=4-10 galaxies from the DAWN JWST Archive with NIRSpec prism spectroscopy, building five stacks sorted by [O III] 5008 equivalent width. It reports the first statistical detections of faint UV lines (C IV, He II, O III], C III], N III], N IV], [C II], Mg II) in average high-redshift star-forming galaxies, and measures electron temperatures from both the [O III] 5008/1666 collisionally excited ratio and the nebular Balmer jump. From these temperatures it derives O, C, and N abundances, finding roughly solar-like C/O ~ -1 with no trend, a mildly enhanced N/O relative to local starbursts, and a ~40% discrepancy between the collisionally excited and recombination-based temperature diagnostics. The paper also uses Mg II escape fractions, a [S II] deficit, O32 ratios, and UV slopes to argue that the strongest starbursts are strong Lyman-continuum leakers.
Significance. If the central claims hold, the paper provides the first statistical view of the UV line emission and chemical abundances of the average z=4-10 galaxy, with a sample size an order of magnitude larger than earlier stacked analyses. The care in line measurement, bootstrap error estimation, and cross-checks of [O III] temperatures with the 4363 line and dust-insensitive ratios is commendable, as is the explicit comparison with CLASSY, LzLCS, and SDSS benchmarks. The potential 40% offset between collisionally excited and recombination temperatures would challenge standard nebular diagnostics at high redshift, and the finding that Mg II and [S II] indicate significant LyC escape in the average high-EW galaxy has clear implications for reionization. However, the abundance and temperature results depend on an assumed and unmeasured electron density, and the paper's own density test substantially weakens the central claims, so the significance is contingent on resolving this systematic.
major comments (3)
- [§4.1.2 and §4.3] The electron density is assumed to be n_e=250 cm^-3 throughout because the prism data cannot resolve density-sensitive doublets (§4.1.2). This assumption enters directly into the PyNeb calculation of the [O III] 5008/1666 temperature and into all O, C, N abundances in §4.2. The paper's own test with n_e=10^6 cm^-3 (§4.3, Figure 9 right) increases 12+log(O/H) by ~0.5 dex and moves the N/O points onto the local relation, which would remove the 'mild nitrogen enhancement' claim and reduce the ~40% temperature offset to ~20%. Because density cannot be measured with the current data, the central abundance and temperature results carry an unquantified systematic error. I request that the paper either obtain a density constraint from medium-resolution data for a subsample or, at minimum, present the density dependence as the dominant systematic and explicitly state that all abundance conclusions are conditional on n_e.
- [§7 versus Table 8] The summary states that log(N/O) ≃ -0.3 in the three highest WOIII stacks, but Table 8 reports log(N/O) = -0.42 ± 0.70, -0.92 ± 0.61, and -1.05 ± 0.52 for stacks 3, 4, and 5. The values for stacks 4 and 5 are more than 1 sigma below the claimed value and are consistent within the uncertainties with the local N/O relation at the same oxygen abundance. This apparent inconsistency between the abstract/summary and the tabulated measurements directly affects the paper's nitrogen-enhancement conclusion, and must be resolved with a corrected summary or a re-analysis of the N/O estimates.
- [§6.2] The 'around 40% offset' between the [O III] and Balmer Jump temperatures is a central claim, but its magnitude depends on the assumed n_e and on the detailed Balmer Jump model, which includes free parameters for the stellar population age, the fraction of lost LyC photons, and independent stellar and nebular reddening (§4.1.1). The paper's own n_e=10^6 test reduces the offset to roughly 20%, and the model-dependence of the Balmer Jump is not fully explored (for example, the sensitivity to the assumed constant-SFR history and the choice of stellar templates is not quantified). Please re-evaluate the discrepancy with a systematic treatment of both the density and the Balmer Jump model uncertainties, and state the resulting range of the offset.
minor comments (3)
- [§4.2, last paragraph] The sentence 'we do not find evolution of N/O with 12+log(O/H) although the estimate values do correlate' is self-contradictory; please rephrase to state clearly whether a trend is found or not, and quantify the significance.
- [§5 and Table 9] The text says 'the average galaxy exceeds the most extreme deficit seen in the LzLCS program' with regard to the [S II] deficit, but only stack 5 (and possibly stack 4) shows a deficit beyond the LzLCS extreme; the other stacks are consistent with the SDSS locus. Please clarify which stacks are meant by 'average galaxy'.
- [§4.2] The propagation of the assumed T_low (from Garnett et al. 1995) into the O/H uncertainties is not described; please state whether the 0.1-0.3 dex errors in 12+log(O/H) include the systematic uncertainty in the O+/O++ temperature scaling.
Circularity Check
No significant circularity: independent diagnostics and external calibrations carry the central results; only minor methodological self-citations appear.
full rationale
The derivation chain is self-contained and non-circular. The electron-temperature discrepancy is between two independent diagnostics: the [O III] 5008/1666 ratio run through PyNeb with external atomic data, and a Balmer-jump spectral fit using Starburst99 and Schirmer (2016) recombination continua; neither quantity is defined in terms of the other or fitted to a target result. The C, N, O abundances are computed from measured line ratios and these temperatures using standard PyNeb emissivities and ICFs, with the ICF choice explicitly tested (negligible difference) and the high-density case n_e=10^6 presented as a sensitivity test rather than hidden. The Mg II escape fraction and [S II] deficit use external calibrations (Xu et al. 2022; Wang et al. 2021) validated against CLOUDY, SDSS, and LzLCS, not against the paper's own outputs. The only self-references (Hayes et al. 2023 line-fitting engine; Berg et al. 2019b and Martinez et al. in prep ICFs) are methodological; the central claims do not reduce to them, and the ICF variants are shown to be negligible. The assumed n_e=250 cm^-3 is a stated, tested assumption producing a systematic uncertainty, not a circular reduction. Thus no equation reduces to its input by construction.
Assumptions & free parameters
free parameters (4)
- electron density n_e =
250 cm^-3
- intrinsic Balmer decrement H-alpha/H-beta =
2.86
- stellar population age in Balmer Jump model =
3-60 Myr across stacks
- fraction of lost LyC photons in Balmer Jump model =
not stated
assumptions (5)
- domain assumption Atomic data for O, C, N (transition probabilities, collision strengths) implemented in PyNeb are correct.
- domain assumption Garnett et al. (1995) scaling between Te(O+) and Te(O++) applies at z=4-10.
- domain assumption Starburst99 models with Geneva tracks and Salpeter IMF represent high-z stellar continua.
- domain assumption Local-universe calibrations (Xu et al. 2022 for MgII, Wang et al. 2021 for [S II] deficit, Chisholm et al. 2022 for beta) transfer to z=4-10.
- domain assumption Stacked galaxies are dominated by star formation rather than AGN.
Cite this review
Pith. "Pith review of On the Average Ultraviolet Emission Line Spectra of High-Redshift Galaxies: Hot and Cold, Carbon-poor, Nitrogen-modest, and Oozing Ionizing Photons." pith.science (2026). https://pith.science/paper/EBGXEOMS
@misc{pith2026241109262,
  author       = {Pith},
  title        = {Pith review of: On the Average Ultraviolet Emission Line Spectra of High-Redshift Galaxies: Hot and Cold, Carbon-poor, Nitrogen-modest, and Oozing Ionizing Photons},
  year         = {2026},
  howpublished = {\url{https://pith.science/paper/EBGXEOMS}},
  note         = {Machine review of arXiv:2411.09262}
}
read the original abstract
We determine the spectroscopic properties of ~1000 ostensibly star-forming galaxies at redshifts (z=4-10) using prism spectroscopy from JWST/NIRSpec. With rest-wavelength coverage between Lya and [S II] in the optical, we stack spectra as a function of nebular conditions, and compare UV spectral properties with stellar age. This reveals UV lines of N III], N IV], C III], C IV, He II, and O III] in the average high-z galaxy. All UV lines are more intense in younger starbursts. We measure electron temperatures from the collisionally excited [O III] line ratios, finding Te=18000-22000 K for the O++ regions. We also detect a significant nebular Balmer Jump from which we estimate only Te=8000-13000 K. Accounting for typical temperature offsets between zones bearing doubly and singly ionized oxygen, these two temperatures remain discrepant by around 40%. We use the [O III] temperatures to estimate abundances of carbon, nitrogen, and oxygen. We find that log(C/O) is consistently ~-1, with no evolution of C/O with metallicity or stellar age. The average spectra are mildly enhanced in Nitrogen, with higher N/O than low-z starbursts, but are less enhanced than samples of high-z galaxies with visible UV N III] and N IV]. Whatever processes produce the N-enhancement in the individual galaxies must also be ongoing, at lower levels, in the median galaxy in the early Universe. The strongest starbursts are a source of significant ionizing emission: ionizing photon production efficiencies reach 10^25.7 Hz/erg, and show multiple signatures of high Lyman continuum escape, including Mg II escape fractions nearing 100%, significant deficits in [S II] emission, high degrees of ionization, and blue UV colors.
Figures


Figures from the paper (6 more)


Forward citations
Cited by 3 Pith papers
-
Unveiling and Characterising Ubiquitous Nitrogen Enhancement in $6 \leq z \leq 10$ Galaxies with JWST Spectroscopy
Stacked JWST/NIRSpec spectra of 135 z=6-10 galaxies show supersolar N/O that is highest after a star-formation lull, consistent with delayed AGB enrichment and pristine gas inflows.
-
The Pitfalls of Using Lyman Alpha Damping Wings in High-z Galaxy Spectra to Measure the Intergalactic Neutral Hydrogen Fraction
Recovery of xHI and NDLA from Ly-alpha damping wings in low-resolution galaxy spectra is heavily biased and degenerate, with xHI effectively unconstrained.
-
Systematic Bias in Ionizing Radiation Escape Fraction Measurements from Foreground Large-Scale Structures
Lyman-alpha forest absorption at z~2.5 is weakly but significantly stronger along sightlines through overdense galaxy regions, implying a systematic bias in ionizing escape fraction measurements.
Reference graph
Works this paper leans on
-
[1]
Acharyya, A., Kewley, L. J., Rigby, J. R., et al. 2019, MNRAS, 488, 5862, doi: 10.1093/mnras/stz1987
-
[2]
Aggarwal, K. M., & Keenan, F. P. 1999, ApJS, 123, 311, doi: 10.1086/313232
doi:10.1086/313232 1999
-
[3]
2019, RMxAA, 55, 377, doi: 10.22201/ia.01851101p.2019.55.02.21
Alarie, A., & Morisset, C. 2019, RMxAA, 55, 377, doi: 10.22201/ia.01851101p.2019.55.02.21
-
[4]
Alexandroff, R. M., Heckman, T. M., Borthakur, S., Overzier, R., & Leitherer, C. 2015, ApJ, 810, 104, doi: 10.1088/0004-637X/810/2/104
-
[5]
Kewley, L. J. 2008, ApJS, 178, 20, doi: 10.1086/589652 Amorín, R., Fontana, A., Pérez-Montero, E., et al. 2017, Nature Astronomy, 1, 0052, doi: 10.1038/s41550-017-0052 Arellano-Córdova, K. Z., Berg, D. A., Chisholm, J., et al. 2022, ApJL, 940, L23, doi: 10.3847/2041-8213/ac9ab2
doi:10.1086/589652 2008
-
[6]
Atek, H., Labbé, I., Furtak, L. J., et al. 2024, Nature, 626, 975, doi: 10.1038/s41586-024-07043-6
-
[7]
Backhaus, B. E., Trump, J. R., Pirzkal, N., et al. 2024, ApJ, 962, 195, doi: 10.3847/1538-4357/ad1520
-
[8]
2024, arXiv e-prints, arXiv:2404.08052, doi: 10.48550/arXiv.2404.08052
Barrufet, L., Oesch, P., Marques-Chaves, R., et al. 2024, arXiv e-prints, arXiv:2404.08052, doi: 10.48550/arXiv.2404.08052
Show all 145 references
-
[9]
B., Rigby, J
Bayliss, M. B., Rigby, J. R., Sharon, K., et al. 2014, ApJ, 790, 144, doi: 10.1088/0004-637X/790/2/144
2014 doi
- [10]
-
[11]
A., Chisholm, J., Erb, D
Berg, D. A., Chisholm, J., Erb, D. K., et al. 2019a, ApJL, 878, L3, doi: 10.3847/2041-8213/ab21dc
-
[12]
McQuinn, K. B. W. 2019b, ApJ, 874, 93, doi: 10.3847/1538-4357/ab020a
-
[13]
A., Pogge, R
Berg, D. A., Pogge, R. W., Skillman, E. D., et al. 2020, ApJ, 893, 96, doi: 10.3847/1538-4357/ab7eab
2020 doi
-
[14]
A., Skillman, E
Berg, D. A., Skillman, E. D., Henry, R. B. C., Erb, D. K., & Carigi, L. 2016, ApJ, 827, 126, doi: 10.3847/0004-637X/827/2/126
2016 doi
-
[15]
A., James, B
Berg, D. A., James, B. L., King, T., et al. 2022, ApJS, 261, 31, doi: 10.3847/1538-4365/ac6c03
2022 doi
-
[16]
N., Röttgering, H
Best, P. N., Röttgering, H. J. A., & Longair, M. S. 2000, MNRAS, 311, 23, doi: 10.1046/j.1365-8711.2000.03028.x
2000
-
[17]
J., Stefanon, M., Brammer, G., et al
Bouwens, R. J., Stefanon, M., Brammer, G., et al. 2023, MNRAS, 523, 1036, doi: 10.1093/mnras/stad1145
2023 doi
-
[18]
Bruton, S., Lin, Y.-H., Scarlata, C., & Hayes, M. J. 2023a, ApJL, 949, L40, doi: 10.3847/2041-8213/acd5d0
-
[19]
2023b, ApJ, 953, 29, doi: 10.3847/1538-4357/acd179
Bruton, S., Scarlata, C., Haardt, F., et al. 2023b, ApJ, 953, 29, doi: 10.3847/1538-4357/acd179
-
[20]
J., Saxena, A., Cameron, A
Bunker, A. J., Saxena, A., Cameron, A. J., et al. 2023, A&A, 677, A88, doi: 10.1051/0004-6361/202346159
2023 doi
- [21]
-
[22]
C., Cullen, F., McLure, R
Carnall, A. C., Cullen, F., McLure, R. J., et al. 2024, MNRAS, 534, 325, doi: 10.1093/mnras/stae2092 22 M. J. Hayes et al
2024 doi
- [23]
- [24]
-
[25]
2023, A&A, 673, L7, doi: 10.1051/0004-6361/202346410
Charbonnel, C., Schaerer, D., Prantzos, N., et al. 2023, A&A, 673, L7, doi: 10.1051/0004-6361/202346410
2023 doi
- [26]
-
[27]
2018, MNRAS, 479, 3264, doi: 10.1093/mnras/sty1461
Chevallard, J., Charlot, S., Senchyna, P., et al. 2018, MNRAS, 479, 3264, doi: 10.1093/mnras/sty1461
2018 doi
-
[28]
2020, MNRAS, 498, 2554, doi: 10.1093/mnras/staa2470
Henry, A. 2020, MNRAS, 498, 2554, doi: 10.1093/mnras/staa2470
2020 doi
-
[29]
2022, MNRAS, 517, 5104, doi: 10.1093/mnras/stac2874
Chisholm, J., Saldana-Lopez, A., Flury, S., et al. 2022, MNRAS, 517, 5104, doi: 10.1093/mnras/stac2874
2022 doi
-
[30]
2012, MNRAS, 427, 1973, doi: 10.1111/j.1365-2966.2012.22007.x
Christensen, L., Laursen, P., Richard, J., et al. 2012, MNRAS, 427, 1973, doi: 10.1111/j.1365-2966.2012.22007.x
2012
-
[31]
A., Erb, D
Citro, A., Berg, D. A., Erb, D. K., et al. 2024, ApJ, 969, 148, doi: 10.3847/1538-4357/ad4600
2024 doi
-
[32]
2023, MNRAS, 518, 425, doi: 10.1093/mnras/stac2737
Curti, M., D’Eugenio, F., Carniani, S., et al. 2023, MNRAS, 518, 425, doi: 10.1093/mnras/stac2737
2023 doi
-
[33]
2024, A&A, 684, A75, doi: 10.1051/0004-6361/202346698
Curti, M., Maiolino, R., Curtis-Lake, E., et al. 2024, A&A, 684, A75, doi: 10.1051/0004-6361/202346698
2024 doi
-
[34]
T., McLeod, D
Donnan, C. T., McLeod, D. J., Dunlop, J. S., et al. 2023, MNRAS, 518, 6011, doi: 10.1093/mnras/stac3472
2023 doi
-
[35]
P., Whitler, L., et al
Endsley, R., Stark, D. P., Whitler, L., et al. 2024, MNRAS, 533, 1111, doi: 10.1093/mnras/stae1857
2024 doi
-
[36]
K., Pettini, M., Shapley, A
Erb, D. K., Pettini, M., Shapley, A. E., et al. 2010, ApJ, 719, 1168, doi: 10.1088/0004-637X/719/2/1168
2010 doi
-
[37]
2009, ApJ, 700, 654, doi: 10.1088/0004-637X/700/1/654
Esteban, C., Bresolin, F., Peimbert, M., et al. 2009, ApJ, 700, 654, doi: 10.1088/0004-637X/700/1/654
2009 doi
-
[38]
2014, MNRAS, 443, 624, doi: 10.1093/mnras/stu1177
Esteban, C., García-Rojas, J., Carigi, L., et al. 2014, MNRAS, 443, 624, doi: 10.1093/mnras/stu1177
2014 doi
-
[39]
2004, MNRAS, 355, 229, doi: 10.1111/j.1365-2966.2004.08313.x
Esteban, C., Peimbert, M., García-Rojas, J., et al. 2004, MNRAS, 355, 229, doi: 10.1111/j.1365-2966.2004.08313.x
2004
-
[40]
2016, MNRAS, 456, 3354, doi: 10.1093/mnras/stv2794
Feltre, A., Charlot, S., & Gutkin, J. 2016, MNRAS, 456, 3354, doi: 10.1093/mnras/stv2794
2016 doi
-
[41]
L., Leung, G
Finkelstein, S. L., Leung, G. C. K., Bagley, M. B., et al. 2024, ApJL, 969, L2, doi: 10.3847/2041-8213/ad4495
2024 doi
-
[42]
R., Jaskot, A
Flury, S. R., Jaskot, A. E., Ferguson, H. C., et al. 2022a, ApJ, 930, 126, doi: 10.3847/1538-4357/ac61e4 —. 2022b, ApJS, 260, 1, doi: 10.3847/1538-4365/ac5331
-
[43]
R., Jaskot, A
Flury, S. R., Jaskot, A. E., Saldana-Lopez, A., et al. 2024, arXiv e-prints, arXiv:2409.12118. https://arxiv.org/abs/2409.12118 Froese Fischer, C., & Tachiev, G. 2004, Atomic Data and Nuclear Data Tables, 87, 1, doi: 10.1016/j.adt.2004.02.001 García-Rojas, J., & Esteban, C. 20...
2024 arXiv
-
[44]
R., Skillman, E
Garnett, D. R., Skillman, E. D., Dufour, R. J., et al. 1995, ApJ, 443, 64, doi: 10.1086/175503 Götberg, Y., de Mink, S. E., Groh, J. H., Leitherer, C., & Norman, C. 2019, A&A, 629, A134, doi: 10.1051/0004-6361/201834525
1995 doi
-
[45]
G., Izotov, Y
Guseva, N. G., Izotov, Y. I., & Thuan, T. X. 2006, ApJ, 644, 890, doi: 10.1086/503865
2006 doi
-
[46]
2016, MNRAS, 462, 1757, doi: 10.1093/mnras/stw1716
Gutkin, J., Charlot, S., & Bruzual, G. 2016, MNRAS, 462, 1757, doi: 10.1093/mnras/stw1716
2016 doi
-
[47]
2023a, ApJS, 265, 5, doi: 10.3847/1538-4365/acaaa9
Harikane, Y., Ouchi, M., Oguri, M., et al. 2023a, ApJS, 265, 5, doi: 10.3847/1538-4365/acaaa9
-
[48]
2023b, ApJ, 959, 39, doi: 10.3847/1538-4357/ad029e
Harikane, Y., Zhang, Y., Nakajima, K., et al. 2023b, ApJ, 959, 39, doi: 10.3847/1538-4357/ad029e
-
[49]
Rivera-Thorsen, T. E. 2023, MNRAS, 520, 5903, doi: 10.1093/mnras/stad477
2023 doi
-
[50]
J., & Scarlata, C
Hayes, M. J., & Scarlata, C. 2023, ApJL, 954, L14, doi: 10.3847/2041-8213/acee6a
2023 doi
-
[51]
J., Tan, J
Hayes, M. J., Tan, J. C., Ellis, R. S., et al. 2024, ApJL, 971, L16, doi: 10.3847/2041-8213/ad63a7
2024 doi
-
[52]
2024, ApJL, 960, L13, doi: 10.3847/2041-8213/ad12cd
He, X., Wang, X., Jones, T., et al. 2024, ApJL, 960, L13, doi: 10.3847/2041-8213/ad12cd
2024 doi
- [53]
-
[54]
A., Scarlata, C., Verhamme, A., & Erb, D
Henry, A., Berg, D. A., Scarlata, C., Verhamme, A., & Erb, D. 2018, ApJ, 855, 96, doi: 10.3847/1538-4357/aab099
2018 doi
-
[55]
Y.-Y., Topping, M
Hsiao, T. Y.-Y., Topping, M. W., Coe, D., et al. 2024, arXiv e-prints, arXiv:2409.04625, doi: 10.48550/arXiv.2409.04625
2024 doi
-
[56]
2024, ApJ, 971, 21, doi: 10.3847/1538-4357/ad5015
Hu, W., Papovich, C., Dickinson, M., et al. 2024, ApJ, 971, 21, doi: 10.3847/1538-4357/ad5015
2024 doi
-
[57]
2014, MNRAS, 442, 753, doi: 10.1093/mnras/stu723
Humphrey, A., & Binette, L. 2014, MNRAS, 442, 753, doi: 10.1093/mnras/stu723
2014 doi
-
[58]
2023, MNRAS, 518, 5018, doi: 10.1093/mnras/stac3198
Iani, E., Zanella, A., Vernet, J., et al. 2023, MNRAS, 518, 5018, doi: 10.1093/mnras/stac3198
2023 doi
-
[59]
K., Shimizu, I., Iwata, I., & Tanaka, M
Inoue, A. K., Shimizu, I., Iwata, I., & Tanaka, M. 2014, MNRAS, 442, 1805, doi: 10.1093/mnras/stu936
2014 doi
-
[60]
2023, ApJ, 959, 100, doi: 10.3847/1538-4357/ad09be
Isobe, Y., Ouchi, M., Tominaga, N., et al. 2023, ApJ, 959, 100, doi: 10.3847/1538-4357/ad09be
2023 doi
-
[61]
I., Chisholm, J., Worseck, G., et al
Izotov, Y. I., Chisholm, J., Worseck, G., et al. 2022, MNRAS, 515, 2864, doi: 10.1093/mnras/stac1899
2022 doi
-
[62]
I., Guseva, N
Izotov, Y. I., Guseva, N. G., Fricke, K. J., et al. 2021, A&A, 646, A138, doi: 10.1051/0004-6361/202039772
2021 doi
-
[63]
I., Schaerer, D., Thuan, T
Izotov, Y. I., Schaerer, D., Thuan, T. X., et al. 2016, MNRAS, 461, 3683, doi: 10.1093/mnras/stw1205
2016 doi
-
[64]
I., Schaerer, D., Worseck, G., et al
Izotov, Y. I., Schaerer, D., Worseck, G., et al. 2023, MNRAS, 522, 1228, doi: 10.1093/mnras/stad1036
2023 doi
-
[65]
2022, A&A, 661, A80, doi: 10.1051/0004-6361/202142663 Stack the DJA 23
Jakobsen, P., Ferruit, P., Alves de Oliveira, C., et al. 2022, A&A, 661, A80, doi: 10.1051/0004-6361/202142663 Stack the DJA 23
2022 doi
-
[67]
L., Pettini, M., Christensen, L., et al
James, B. L., Pettini, M., Christensen, L., et al. 2014, MNRAS, 440, 1794, doi: 10.1093/mnras/stu287
2014 doi
-
[68]
L., Berg, D
James, B. L., Berg, D. A., King, T., et al. 2022, ApJS, 262, 37, doi: 10.3847/1538-4365/ac8008
2022 doi
-
[69]
E., & Ravindranath, S
Jaskot, A. E., & Ravindranath, S. 2016, ApJ, 833, 136, doi: 10.3847/1538-4357/833/2/136
2016 doi
- [70]
-
[71]
2023, ApJL, 951, L17, doi: 10.3847/2041-8213/acd938
Jones, T., Sanders, R., Chen, Y., et al. 2023, ApJL, 951, L17, doi: 10.3847/2041-8213/acd938
2023 doi
- [72]
-
[73]
J., Nicholls, D
Kewley, L. J., Nicholls, D. C., & Sutherland, R. S. 2019, ARA&A, 57, 511, doi: 10.1146/annurev-astro-081817-051832
2019 doi
-
[74]
J., Ferland, G
Kisielius, R., Storey, P. J., Ferland, G. J., & Keenan, F. P. 2009, MNRAS, 397, 903, doi: 10.1111/j.1365-2966.2009.14989.x
2009
-
[75]
2024, ApJL, 962, L6, doi: 10.3847/2041-8213/ad1de1
Kobayashi, C., & Ferrara, A. 2024, ApJL, 962, L6, doi: 10.3847/2041-8213/ad1de1
2024 doi
- [76]
- [77]
- [78]
-
[79]
S., et al
Laporte, N., Nakajima, K., Ellis, R. S., et al. 2017, ApJ, 851, 40, doi: 10.3847/1538-4357/aa96a8
2017 doi
-
[80]
2024, A&A, 687, A73, doi: 10.1051/0004-6361/202449362
Leclercq, F., Chisholm, J., King, W., et al. 2024, A&A, 687, A73, doi: 10.1051/0004-6361/202449362
2024 doi
-
[81]
2013, A&A, 553, A106, doi: 10.1051/0004-6361/201118370
Leitet, E., Bergvall, N., Hayes, M., Linné, S., & Zackrisson, E. 2013, A&A, 553, A106, doi: 10.1051/0004-6361/201118370
2013 doi
-
[82]
D., et al
Leitherer, C., Schaerer, D., Goldader, J. D., et al. 1999, ApJS, 123, 3, doi: 10.1086/313233
1999 doi
-
[83]
2022, A&A, 659, A16, doi: 10.1051/0004-6361/202141651 López-Sánchez, Á
Llerena, M., Amorín, R., Cullen, F., et al. 2022, A&A, 659, A16, doi: 10.1051/0004-6361/202141651 López-Sánchez, Á. R., Esteban, C., García-Rojas, J., Peimbert, M., & Rodríguez, M. 2007, ApJ, 656, 168, doi: 10.1086/510112
2022 doi
-
[84]
Luridiana, V., Morisset, C., & Shaw, R. A. 2015, A&A, 573, A42, doi: 10.1051/0004-6361/201323152
2015 doi
-
[85]
P., Tang, M., et al
Mainali, R., Stark, D. P., Tang, M., et al. 2020, MNRAS, 494, 719, doi: 10.1093/mnras/staa751
2020 doi
- [86]
-
[87]
2024, A&A, 687, A67, doi: 10.1051/0004-6361/202347087
Maiolino, R., Übler, H., Perna, M., et al. 2024, A&A, 687, A67, doi: 10.1051/0004-6361/202347087
2024 doi
-
[88]
2024, A&A, 681, A30, doi: 10.1051/0004-6361/202347411
Marques-Chaves, R., Schaerer, D., Kuruvanthodi, A., et al. 2024, A&A, 681, A30, doi: 10.1051/0004-6361/202347411
2024 doi
-
[89]
M., & Kunth, D
Mas-Hesse, J. M., & Kunth, D. 1991, A&AS, 88, 399
1991
-
[90]
2023, A&A, 674, A221, doi: 10.1051/0004-6361/202245152 Matthee,J.,Sobral,D.,Hayes,M.,etal.2021,MNRAS,505,1382, doi: 10.1093/mnras/stab1304
Mascia, S., Pentericci, L., Saxena, A., et al. 2023, A&A, 674, A221, doi: 10.1051/0004-6361/202245152 Matthee,J.,Sobral,D.,Hayes,M.,etal.2021,MNRAS,505,1382, doi: 10.1093/mnras/stab1304
2023 doi
-
[91]
P., Brammer, G., et al
Matthee, J., Naidu, R. P., Brammer, G., et al. 2024, ApJ, 963, 129, doi: 10.3847/1538-4357/ad2345
2024 doi
-
[92]
2010, A&A, 515, A68, doi: 10.1051/0004-6361/200913315 Méndez-Delgado, J
Mattsson, L. 2010, A&A, 515, A68, doi: 10.1051/0004-6361/200913315 Méndez-Delgado, J. E., Esteban, C., García-Rojas, J., Kreckel, K., & Peimbert, M. 2023, Nature, 618, 249, doi: 10.1038/s41586-023-05956-2 Meštrić, U., Vanzella, E., Upadhyaya, A., et al. 2023, A&A, 673, A50, do...
2010 doi
-
[93]
L., Arellano-Córdova, K
Mingozzi, M., James, B. L., Arellano-Córdova, K. Z., et al. 2022, ApJ, 939, 110, doi: 10.3847/1538-4357/ac952c
2022 doi
-
[94]
L., Berg, D
Mingozzi, M., James, B. L., Berg, D. A., et al. 2024, ApJ, 962, 95, doi: 10.3847/1538-4357/ad1033
2024 doi
-
[95]
2023, ApJS, 269, 33, doi: 10.3847/1538-4365/acd556
Nakajima, K., Ouchi, M., Isobe, Y., et al. 2023, ApJS, 269, 33, doi: 10.3847/1538-4365/acd556
2023 doi
-
[96]
2018, A&A, 612, A94, doi: 10.1051/0004-6361/201731935
Nakajima, K., Schaerer, D., Le Fèvre, O., et al. 2018, A&A, 612, A94, doi: 10.1051/0004-6361/201731935
2018 doi
-
[97]
2024, A&A, 688, A142, doi: 10.1051/0004-6361/202348866
Nandal, D., Sibony, Y., & Tsiatsiou, S. 2024, A&A, 688, A142, doi: 10.1051/0004-6361/202348866
2024 doi
-
[98]
2024a, A&A, 688, A106, doi: 10.1051/0004-6361/202449644
Napolitano, L., Pentericci, L., Santini, P., et al. 2024a, A&A, 688, A106, doi: 10.1051/0004-6361/202449644
-
[99]
2024b, arXiv e-prints, arXiv:2410.18763, doi: 10.48550/arXiv.2410.18763
Napolitano, L., Castellano, M., Pentericci, L., et al. 2024b, arXiv e-prints, arXiv:2410.18763, doi: 10.48550/arXiv.2410.18763
-
[100]
B., et al
Newville, M., Stensitzki, T., Allen, D. B., et al. 2016, Lmfit: Non-Linear Least-Square Minimization and Curve-Fitting for
2016
-
[101]
Groves, B. A. 2017, MNRAS, 466, 4403, doi: 10.1093/mnras/stw3235 Oke,J.B.,&Gunn,J.E.1983,ApJ,266,713,doi:10.1086/160817
2017 doi
-
[102]
F., & Tsang, B
Pascale, M., Dai, L., McKee, C. F., & Tsang, B. T. H. 2023, ApJ, 957, 77, doi: 10.3847/1538-4357/acf75c Peña-Guerrero, M. A., Leitherer, C., de Mink, S., Wofford, A., & Kewley,L. 2017,ApJ, 847,107,doi: 10.3847/1538-4357/aa88bf
2023 doi
-
[103]
Peimbert, A., Peimbert, M., & Ruiz, M. T. 2005, ApJ, 634, 1056, doi: 10.1086/444557
2005 doi
-
[104]
W., Oey, M
Pellegrini, E. W., Oey, M. S., Winkler, P. F., et al. 2012, ApJ, 755, 40, doi: 10.1088/0004-637X/755/1/40
2012 doi
-
[105]
2020, ApJ, 896, 170, doi: 10.3847/1538-4357/ab91a5
Tumlinson, J. 2020, ApJ, 896, 170, doi: 10.3847/1538-4357/ab91a5
2020 doi
-
[106]
A., Steidel, C
Reddy, N. A., Steidel, C. C., Pettini, M., & Bogosavljević, M. 2016, ApJ, 828, 107, doi: 10.3847/0004-637X/828/2/107
2016 doi
-
[107]
A., Kriek, M., Shapley, A
Reddy, N. A., Kriek, M., Shapley, A. E., et al. 2015, ApJ, 806, 259, doi: 10.1088/0004-637X/806/2/259 24 M. J. Hayes et al
2015 doi
-
[108]
A., Sanders, R
Reddy, N. A., Sanders, R. L., Shapley, A. E., et al. 2023, ApJ, 951, 56, doi: 10.3847/1538-4357/acd0b1
2023 doi
-
[109]
2024, ApJ, 966, 228, doi: 10.3847/1538-4357/ad382c
Revalski, M., Rafelski, M., Henry, A., et al. 2024, ApJ, 966, 228, doi: 10.3847/1538-4357/ad382c
2024 doi
-
[110]
E., Dahle, H., Chisholm, J., et al
Rivera-Thorsen, T. E., Dahle, H., Chisholm, J., et al. 2019, Science, 366, 738, doi: 10.1126/science.aaw0978
2019 doi
- [111]
-
[112]
W., Bouwens, R
Roberts-Borsani, G. W., Bouwens, R. J., Oesch, P. A., et al. 2016, ApJ, 823, 143, doi: 10.3847/0004-637X/823/2/143
2016 doi
-
[113]
D., Tacchella, S., et al
Robertson, B., Johnson, B. D., Tacchella, S., et al. 2024, ApJ, 970, 31, doi: 10.3847/1538-4357/ad463d
2024 doi
-
[114]
E., Ellis, R
Robertson, B. E., Ellis, R. S., Furlanetto, S. R., & Dunlop, J. S. 2015, ApJL, 802, L19, doi: 10.1088/2041-8205/802/2/L19
2015 doi
-
[115]
2022, A&A, 663, A59, doi: 10.1051/0004-6361/202141864
Saldana-Lopez, A., Schaerer, D., Chisholm, J., et al. 2022, A&A, 663, A59, doi: 10.1051/0004-6361/202141864
2022 doi
-
[116]
Brammer, G. B. 2024, ApJ, 962, 24, doi: 10.3847/1538-4357/ad15fc
2024 doi
-
[117]
L., Shapley, A
Sanders, R. L., Shapley, A. E., Kriek, M., et al. 2018, ApJ, 858, 99, doi: 10.3847/1538-4357/aabcbd
2018 doi
-
[118]
L., Shapley, A
Sanders, R. L., Shapley, A. E., Clarke, L., et al. 2023, ApJ, 943, 75, doi: 10.3847/1538-4357/aca9cc
2023 doi
-
[119]
2022a, A&A, 665, L4, doi: 10.1051/0004-6361/202244556
Schaerer, D., Marques-Chaves, R., Barrufet, L., et al. 2022a, A&A, 665, L4, doi: 10.1051/0004-6361/202244556
-
[120]
2024, A&A, 687, L11, doi: 10.1051/0004-6361/202450721
Schaerer, D., Marques-Chaves, R., Xiao, M., & Korber, D. 2024, A&A, 687, L11, doi: 10.1051/0004-6361/202450721
2024 doi
-
[121]
I., Worseck, G., et al
Schaerer, D., Izotov, Y. I., Worseck, G., et al. 2022b, A&A, 658, L11, doi: 10.1051/0004-6361/202243149
-
[122]
2016, PASP, 128, 114001, doi: 10.1088/1538-3873/128/969/114001
Schirmer, M. 2016, PASP, 128, 114001, doi: 10.1088/1538-3873/128/969/114001
2016 doi
-
[123]
2024, A&A, 687, A283, doi: 10.1051/0004-6361/202347187
Scholtz, J., Witten, C., Laporte, N., et al. 2024, A&A, 687, A283, doi: 10.1051/0004-6361/202347187
2024 doi
-
[124]
P., Charlot, S., et al
Senchyna, P., Stark, D. P., Charlot, S., et al. 2021, MNRAS, 503, 6112, doi: 10.1093/mnras/stab884
2021 doi
-
[125]
P., Vidal-García, A., et al
Senchyna, P., Stark, D. P., Vidal-García, A., et al. 2017, MNRAS, 472, 2608, doi: 10.1093/mnras/stx2059
2017 doi
-
[126]
P., Charlot, S., et al
Senchyna, P., Stark, D. P., Charlot, S., et al. 2022, ApJ, 930, 105, doi: 10.3847/1538-4357/ac5d38
2022 doi
- [127]
- [128]
-
[129]
P., Richard, J., Siana, B., et al
Stark, D. P., Richard, J., Siana, B., et al. 2014, MNRAS, 445, 3200, doi: 10.1093/mnras/stu1618 Stark,D.P.,Ellis,R.S.,Charlot,S.,etal.2017,MNRAS,464,469, doi: 10.1093/mnras/stw2233
2014 doi
-
[130]
J., Illingworth, G
Stefanon, M., Bouwens, R. J., Illingworth, G. D., et al. 2022, ApJ, 935, 94, doi: 10.3847/1538-4357/ac7e44
2022 doi
-
[131]
C., Strom, A
Steidel, C. C., Strom, A. L., Pettini, M., et al. 2016, ApJ, 826, 159, doi: 10.3847/0004-637X/826/2/159
2016 doi
-
[132]
2023, ApJL, 957, L18, doi: 10.3847/2041-8213/ad0159
Stiavelli, M., Morishita, T., Chiaberge, M., et al. 2023, ApJL, 957, L18, doi: 10.3847/2041-8213/ad0159
2023 doi
-
[133]
P., Chevallard, J., & Charlot, S
Tang, M., Stark, D. P., Chevallard, J., & Charlot, S. 2019, MNRAS, 489, 2572, doi: 10.1093/mnras/stz2236
2019 doi
- [134]
- [135]
-
[136]
1985, A&A, 150, 151
Tarrab, I. 1985, A&A, 150, 151
1985
-
[137]
W., Stark, D
Topping, M. W., Stark, D. P., Senchyna, P., et al. 2024, MNRAS, 529, 3301, doi: 10.1093/mnras/stae682 Toribio San Cipriano, L., Domínguez-Guzmán, G., Esteban, C., et al. 2017, MNRAS, 467, 3759, doi: 10.1093/mnras/stx328 Toribio San Cipriano, L., García-Rojas, J., Esteban, C., ...
2024 doi
-
[138]
R., Arrabal Haro, P., Simons, R
Trump, J. R., Arrabal Haro, P., Simons, R. C., et al. 2023, ApJ, 945, 35, doi: 10.3847/1538-4357/acba8a van Zee, L., & Haynes, M. P. 2006, ApJ, 636, 214, doi: 10.1086/498017
2023 doi
-
[139]
2010, A&A, 513, A20, doi: 10.1051/0004-6361/200913042 Vázquez, G
Vanzella, E., Grazian, A., Hayes, M., et al. 2010, A&A, 513, A20, doi: 10.1051/0004-6361/200913042 Vázquez, G. A., & Leitherer, C. 2005, ApJ, 621, 695, doi: 10.1086/427866
2010 doi
-
[140]
M., Leitherer, C., et al
Wang, B., Heckman, T. M., Leitherer, C., et al. 2019, ApJ, 885, 57, doi: 10.3847/1538-4357/ab418f
2019 doi
-
[141]
M., Amorín, R., et al
Wang, B., Heckman, T. M., Amorín, R., et al. 2021, ApJ, 916, 3, doi: 10.3847/1538-4357/ac0434
2021 doi
- [142]
- [143]
-
[144]
W., & Barlow, M
Wesson, R., Liu, X. W., & Barlow, M. J. 2005, MNRAS, 362, 424, doi: 10.1111/j.1365-2966.2005.09325.x
2005
-
[145]
2024, A&A, 682, A40, doi: 10.1051/0004-6361/202347176
Witstok, J., Smit, R., Saxena, A., et al. 2024, A&A, 682, A40, doi: 10.1051/0004-6361/202347176
2024 doi
-
[146]
2022, ApJ, 933, 202, doi: 10.3847/1538-4357/ac7225 —
Xu, X., Henry, A., Heckman, T., et al. 2022, ApJ, 933, 202, doi: 10.3847/1538-4357/ac7225 —. 2023, ApJ, 943, 94, doi: 10.3847/1538-4357/aca89a
2022 doi
Reviewed August 12, 2026 · model on record in the stance chip above.
Discussion (0). Continue with ORCID to comment.