REVIEW 4 major objections 6 minor 1 cited by
nvAgent: Automated Data Visualization from Natural Language via Collaborative Agent Workflow
T0 review · 4 major / 6 minor · reviewed 2026-08-08 · deepseek-v4-flash
Pith's one-line read A three-agent pipeline with schema filtering, VQL planning, and execution-driven refinement raises the pass rate on natural-language chart generation to 85.63% (single-table) and 81.07% (multi-table) on VisEval.
desk verdict A credible incremental agent-workflow result on VisEval, overclaimed in places and short on significance testing; worth refereeing with revisions. read the letter →
The pith
A machine-rendered reading of the paper's core claim, the machinery that carries it, and where it could break.
The reading
What carries the argument
The load-bearing mechanism is a collaborative division of labor around a compact intermediate representation. nvAgent first uses a processor agent to build a database description, filter the schema to query-relevant tables and columns, augment it with explanatory notes about key relationships, and classify the query as single or multi-table. A composer agent then consumes that filtered context and produces a Visualization Query Language (VQL) statement - SQL-like data operations plus a visualization type and binning clause - using chain-of-thought reasoning, few-shot examples, and a sketch-and-fill process. A validator agent translates the VQL into executable Python, runs it in a sandbox, and on error routes the message back to the composer to refine the VQL rather than the Python, iterating until execution succeeds. VQL is the engine: it is deliberately constrained so the LLM plans the chart and data selection before code is written, and so the refinement loop corrects the plan instead of patching generated code.
What would settle it
Take a random sample of nvAgent's GPT-4o outputs on VisEval that were marked valid, and have human annotators check whether the chart type, axes, ordering, and aggregation match the natural-language query; if a substantial fraction of execution-successful charts are semantically wrong, the pass-rate advantage over baselines would narrow.
Extended reading notes
Core claim
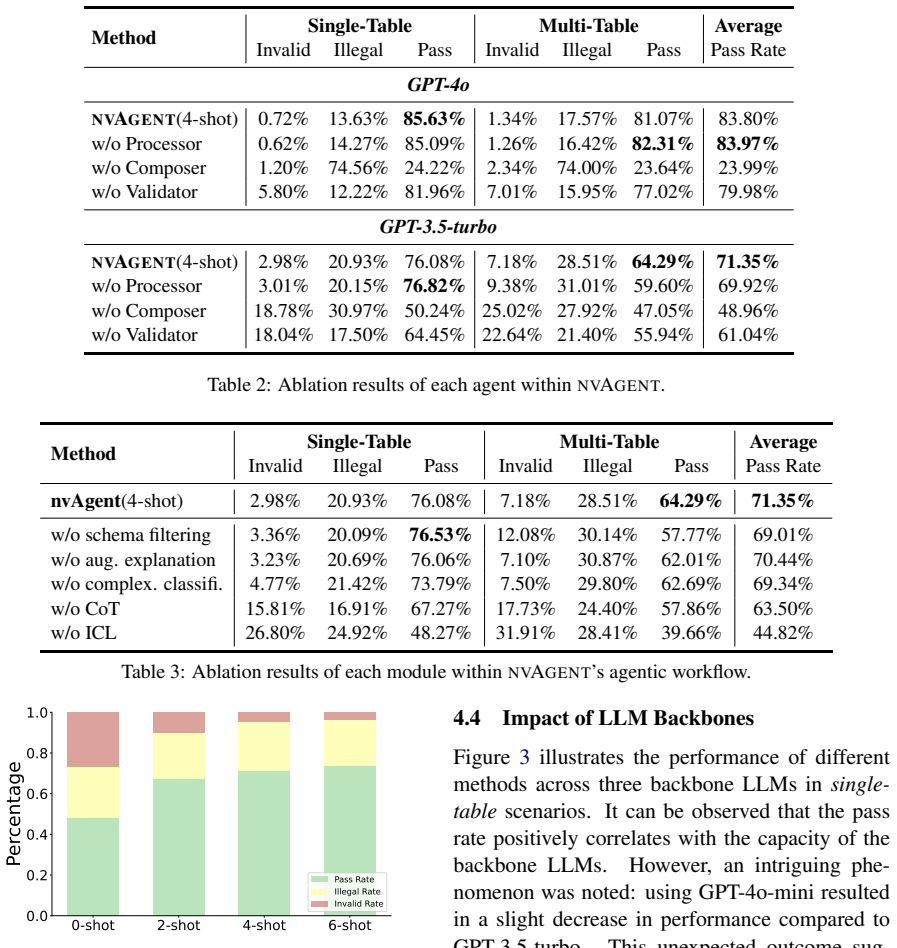
The central claim is empirical: on VisEval, the collaborative agent workflow nvAgent outperforms all three prior systems (Chat2Vis, LIDA, CoML4Vis) on pass rate and quality in both single- and multi-table scenarios, with the largest absolute gains in multi-table settings. With GPT-4o, nvAgent attains a pass rate of 85.63% on single-table and 81.07% on multi-table queries, compared with 77.75% and 71.84% for the strongest baseline; the multi-table quality score rises from 2.48 to 2.93. Ablations identify the composer as the critical component (removing it drops pass rate by 22.39 points with GPT-3.5-turbo and 59.81 points with GPT-4o), the validator as a smaller but consistent contributor, and in-context learning as essential. The authors interpret the narrow single/multi gap (85.63% vs 81.07%) as evidence that the division of labor makes cross-table queries nearly as tractable as single-table ones.
Load-bearing premise
The loop that decides when a visualization is 'valid' checks that the generated code runs without error, not that the chart's type, data, ordering, or grouping actually answers the query, and the reported pass rate inherits that assumption.
Editorial extensions
If this is right
- If nvAgent's numbers hold, multi-table natural-language visualization is no longer a separate failure regime: the multi-table pass rate trails the single-table pass rate by only 4.56 points with GPT-4o.
- The composer ablation implies that the planning stage, not schema preprocessing, carries most of the benefit; removing it costs 59.81 points in average pass rate with GPT-4o.
- In-context learning is load-bearing: dropping few-shot examples cuts average pass rate from 71.35% to 44.82% with GPT-3.5-turbo.
- Refining the VQL plan rather than the generated Python is worth about 1.01 points in pass rate and saves tokens in the correction loop.
- Gains persist across all three backbone models tested, so the approach is not tied to a single LLM.
Reading between the lines
- A natural, testable extension is to add a semantic validator that checks chart type, ordering, and aggregation against the query rather than only execution success; nvAgent's own remaining illegal rates of 13.63% (single-table) and 17.57% (multi-table) with GPT-4o are the reserve this would target.
- If the processor's contribution is concentrated in multi-table settings and shrinks with stronger LLMs, future systems might trade the schema-filtering step for longer-context models while keeping the composer and validator stages.
- The VQL-plus-refinement recipe could transfer to other generation tasks with a constrained target grammar, such as SQL or configuration code, where planning in the constrained language and validating by execution are natural fits.
- A direct stress test would run nvAgent on out-of-distribution multi-table schemas or with open-weight LLMs to separate the agent design's effect from the backbone model's capability.
Editorial analysis
A structured set of objections, weighed in public.
Referee Report
Summary. The paper proposes nvAgent, a three-agent workflow for natural-language-to-visualization (NL2Vis) on relational tables. A processor agent filters schemas and augments context, a composer agent generates an intermediate Visualization Query Language (VQL) representation through chain-of-thought and sketch-and-fill prompting, and a validator agent translates VQL to executable Python, runs it, and iteratively refines VQL on execution errors. The system is evaluated on the VisEval benchmark with GPT-4o, GPT-4o-mini, and GPT-3.5-turbo backbones, against Chat2Vis, LIDA, and CoML4Vis. The central empirical claim is that nvAgent improves pass rate by 7.88 percentage points in single-table and 9.23 percentage points in multi-table scenarios over the best baseline (Table 1), with ablations attributing the gain mainly to the composer and validator agents. The paper also reports readability and quality scores, human Elo rankings, and error analyses.
Significance. If the central claim holds, nvAgent is a useful modular recipe for multi-table NL2Vis: the processor/composer/validator decomposition and the VQL intermediate representation are concrete and transferable design choices, and the paper evaluates them on an external benchmark with three backbones, ablations, and human judgment. The availability of code and a demo is a strength. The significance is moderate, however, because the headline pass-rate advantage is not yet fully separated from evaluation asymmetries and from the validator's narrow, execution-only correctness check; the paper's own limitations section concedes that semantic correctness is not fully captured. The contribution is an engineering-plus-empirical result rather than a new formal method, and its value depends on tightening the evaluation claims.
major comments (4)
- [Section 4.2, Table 1] The statement that nvAgent improves 'across all metrics' is contradicted by Table 1. On readability, Chat2Vis with GPT-4o scores 3.87 in single-table and 3.76 in multi-table, while nvAgent scores 3.66 and 3.61; with GPT-4o-mini, Chat2Vis also has higher single-table readability (3.81 vs. 3.67). The negative readability deltas are visible in the Δ row of Table 1. The claim should be restricted to pass rate and quality score, or the readability gap should be discussed rather than dismissed.
- [Section 3.4, Table 2] The validator's described mechanism checks only whether code executes successfully; it does not verify chart type, data transformations, ordering, or binning, which are the components of VisEval's legality definition. The paper says the validator 'ensures correctness via iterative validation and refinement,' but Table 2 shows that removing the validator increases the invalid rate (GPT-4o single-table: 0.72% to 5.80%) while slightly decreasing the illegal rate (13.63% to 12.22%). The pass-rate contribution of the validator therefore comes almost entirely from turning execution failures into rendered output, not from improving semantic/legal compliance. The headline claim should be reframed accordingly, or supported with evidence that the refinement loop improves Chart Type, Data, and Order compliance.
- [Section 4.2, Table 1] No statistical significance testing or confidence intervals are reported for the pass-rate deltas. The GPT-4o-mini single-table delta is only 1.28 percentage points, and the GPT-3.5-turbo multi-table illegal-rate comparison is hard to interpret because of the LIDA invalid-rate interaction. Without bootstrap confidence intervals, per-item significance tests, or release of the raw per-item outputs, the strength of the improvement for the weaker backbones is not established. This is load-bearing for the 'consistently surpasses' claim.
- [Section 4.1, Table 7] The baseline comparison is asymmetric in inference budget. nvAgent uses three LLM agents and iterative refinement, with about 5,900-6,600 tokens per query, whereas Chat2Vis, LIDA, and CoML4Vis use 865-3,377 tokens and have no self-correction loop. Some of the pass-rate margin may reflect this additional compute rather than the workflow design per se. The paper should report pass rate as a function of inference budget, include a stronger single-agent baseline that is allowed the same number of refinement attempts, or at least discuss the cost/performance trade-off explicitly.
minor comments (6)
- [Abstract, Section 4.2] The phrases '7.88% improvement' and '9.23% improvement' should be '7.88 percentage points' and '9.23 percentage points,' since the metrics are already percentages.
- [References] CoML4Vis is cited as (Zhang et al., 2023), but the reference list entry appears to describe MLCopilot; the method name, reference, or both need correction.
- [Appendix A, Table 6] The Pearson correlation P-value is reported as 0.000; it should be reported as <0.001 or with the actual value.
- [General] There are multiple typos and inconsistencies: 'anthor' in the corresponding-author footnote, 'mult-table' in Section 6, 'NVAGENT' vs. 'nvAgent' capitalization, and the abstract's 'NL2V IS' spacing.
- [Section 4.6, Appendix A] The Elo evaluation would be clearer if the paper specified how ties are handled in the pairwise human judgments and how the 1,000 example pairs are sampled from the single- and multi-table sets.
- [Limitations] The limitations paragraph concedes that 'our prompting strategy and evaluation metrics may not fully capture the nuances of complex visualizations or semantic correctness.' This concession should be integrated into the main evaluation discussion in Section 4, since it bears directly on the interpretation of the headline pass rate.
Circularity Check
No significant circularity: headline results are measured on the external VisEval benchmark; internal judges affect only ancillary quality/readability metrics.
full rationale
nvAgent is an empirical systems paper whose central claim is a measured pass-rate improvement on the external VisEval benchmark against standard baselines, so there is no derivation chain whose outputs are fixed by its inputs. The rule-based Pass Rate (valid + legal) is defined by VisEval's external checks (Code Execution, Chart Type, Data, Order, Layout, Scale & Ticks), and the paper reports raw error decomposition in Table 10; the agent's execution-guided refinement is a system component, not a metric that defines the score. The only internally generated scores are Readability/Quality (GPT-4o-mini judge with Pearson r=0.65 vs. human annotation) and ELO comparisons with author-conducted human annotation; these are evaluation instruments, not predictions derived from fit parameters, and they do not affect the headline pass-rate deltas. The Limitations section explicitly concedes that metrics 'may not fully capture the nuances of complex visualizations or semantic correctness,' which is a validity caveat, not a circular step. Citations to prior work by overlapping authors (e.g., Wu et al. 2024b for VQL, Chen et al. 2024a for MLLM-as-a-judge) are routine methodological references and are not load-bearing: VQL is an implementation choice, and the judge is validated against human scores. I find no equation, fitted parameter, or self-citation chain that makes any claimed result true by construction.
Assumptions & free parameters
free parameters (3)
- Number of in-context examples =
4-shot
- Backbone sampling temperature =
0
- ELO K-factor =
32
assumptions (3)
- domain assumption VisEval ground truths and rule-based checkers are a valid operationalization of visualization correctness
- domain assumption GPT-4o-mini's readability scores adequately approximate human readability judgment
- ad hoc to paper VQL as an intermediate representation preserves the semantics needed for correct visualization and can be translated to correct Python by a simple function
invented entities (1)
-
Visualization Query Language (VQL) intermediate representation
Cite this review
Pith. "Pith review of nvAgent: Automated Data Visualization from Natural Language via Collaborative Agent Workflow." pith.science (2026). https://pith.science/paper/EOVV3L64
@misc{pith2026250205036,
  author       = {Pith},
  title        = {Pith review of: nvAgent: Automated Data Visualization from Natural Language via Collaborative Agent Workflow},
  year         = {2026},
  howpublished = {\url{https://pith.science/paper/EOVV3L64}},
  note         = {Machine review of arXiv:2502.05036}
}
read the original abstract
Natural Language to Visualization (NL2Vis) seeks to convert natural-language descriptions into visual representations of given tables, empowering users to derive insights from large-scale data. Recent advancements in Large Language Models (LLMs) show promise in automating code generation to transform tabular data into accessible visualizations. However, they often struggle with complex queries that require reasoning across multiple tables. To address this limitation, we propose a collaborative agent workflow, termed nvAgent, for NL2Vis. Specifically, nvAgent comprises three agents: a processor agent for database processing and context filtering, a composer agent for planning visualization generation, and a validator agent for code translation and output verification. Comprehensive evaluations on the new VisEval benchmark demonstrate that nvAgent consistently surpasses state-of-the-art baselines, achieving a 7.88% improvement in single-table and a 9.23% improvement in multi-table scenarios. Qualitative analyses further highlight that nvAgent maintains nearly a 20% performance margin over previous models, underscoring its capacity to produce high-quality visual representations from complex, heterogeneous data sources.
Figures


Figures from the paper (13 more)


Forward citations
Cited by 1 Pith paper
-
VIS-Shepherd: Constructing Critic for LLM-based Data Visualization Generation
A 7-billion-parameter multimodal model fine-tuned on 2,500 expert critiques of data visualizations matches or beats much larger models at identifying visualization defects.
Reference graph
Works this paper leans on
-
[1]
Chart Colors: • Are the colors clear and natural, effectively conveying the information? • Color blindness accessibility: Are the color combinations easy to distinguish, especially for users with color blindness?
-
[2]
Title and Axis Labels: • Ensure the chart has a clear title. • Do the X-axis and Y-axis labels exist, and are they complete? • Check if the labels are difficult to read, e.g., are they written vertically instead of horizontally? • The title should not be a direct question; instead, it should describe the data or trends being presented
-
[3]
Scoring Scale: • 1 Point: Very poor, unable to understand or severely lacking information
Legend Completeness: • Is the legend complete, and does it clearly indicate the color labels for different data series? • Ensure each color has a corresponding legend, making it easy for users to understand what the data represents. Scoring Scale: • 1 Point: Very poor, unable to understand or severely lacking information. • 2 Points: Poor quality, multipl...
-
[4]
Aesthetics: Consider if the chart’s color scheme, proportions, and overall design are visually pleasing
-
[5]
Proceedings of the VLDB Endowment , 17(12):3920–3933
Autotqa: Towards autonomous tabular ques- tion answering through multi-agent large language models. Proceedings of the VLDB Endowment , 17(12):3920–3933. A Detailed Experiment Setups Baselines. This study compares our approach with three state-of-the-art baselines. We also at- tempted to include Code Interpreter as a baseline; however, API rate limitation...
work page 2023
-
[6]
The customer_type column in the Customers table will be used for further grouping and as the third dimension in the stacked bar chart. The query involves joining these two tables to analyze order amounts by customer type and month, which requires aggregation and time-based binning. [Question] Show the total order amount for each customer type by month in ...
-
[9]
Appropriateness of chart type: Check if the selected chart type is suitable for expressing the data and relation- ships required by the query
-
[10]
Data completeness: Ensure the chart includes all necessary data required by the query
Show all 55 references
-
[11]
Readability: Assess the clarity of the chart, accuracy of labels, and overall layout
-
[13]
Evaluation process:
Information conveyance: Judge if the chart effectively conveys the main information or insights required by the query. Evaluation process:
-
[14]
Carefully read the natural language query
-
[15]
Observe the visualization results generated by two models
-
[16]
Based on the above criteria, choose the better visualization or select a tie if they are equally good
-
[17]
CREATE VIEW {table_name} AS SELECT * FROM read_csv_auto('{os.path.join(data_folder, file)}')
If neither visualization satisfies the query requirements well, please choose the relatively better one. Remember, your evaluation will help us improve and compare different visualization models. Thank you for your participation! Figure 12: Instructions for human annorators in...
-
[18]
- Only exclude columns that are completely irrelevant
Schema Filtering: - Identify the tables and columns that are relevant to the user query. - Only exclude columns that are completely irrelevant. - The output should be {{tables: [columns]}}. - Keep the columns needed to be primary keys and foreign keys in the filtered schema. -...
-
[19]
New Schema Generation: - Generate a new schema of the filtered schema, based on the given database schema and your filtered schema
-
[20]
- Include the number of tables, total columns, and any notable relationships or patterns
Augmented Explanation: - Provide a concise summary of the filtered schema to give additional knowledge. - Include the number of tables, total columns, and any notable relationships or patterns
-
[21]
Student": [
Classification: For the database new schema, classify it as SINGLE or MULTIPLE based on the tables number. - if tables number >= 2: predict MULTIPLE - elif only one table: predict SINGLE ============================== Here is a typical example: [Database Schema] [DB_ID] dorm_1...
2000
-
[22]
The Lives_in table acts as a bridge between Student and Dorm, allowing for the association of students with their dorms
-
[23]
The ‘dorm name’ column in the Dorm table is crucial for filtering the specific dorm (Smith Hall)
-
[24]
VIS TYPE + SQL + BINNING
The ‘fname’ column from the Student table is required for the final output. [Classification] MULTIPLE ============================== Here is a new question: [DB_ID] {db_id} [Database Schema] {db_schema} [Query] {query} Now give your answer following this format strictly withou...
-
[32]
There is a one-to-many relationship between Customers and Orders through the customer_id foreign key
Third add Visualize type and BINNING into the SQL components to generate final VQL ============================== Here is a typical example: [Database Schema] # Table: Orders, (orders) [ (order_id, order id, And this is a id type column), (customer_id, customer id, And this is...
2023
-
[33]
The Orders table contains information about individual orders, including the order date and total amount
-
[34]
The Customers table contains customer information, including their name and type (Regular, VIP, or New)
-
[35]
The customer_id column links the two tables, allowing us to associate orders with specific customers
-
[36]
The order_date column in the Orders table will be used for monthly grouping and binning
-
[37]
The total_amount column in the Orders table needs to be summed for each group
-
[39]
We need to select 3 columns for STACKED BAR chart, order_date as X-axis, SUM(total_amout) as Y-axis, customer_type as group column
-
[40]
We need to join the Orders and Customers tables
-
[41]
We need to group by customer type
-
[42]
VIS TYPE + SQL + BINNING
We do not need to use any window function for MONTH. sql “‘sql SELECT O.order_date, SUM(O.total_amount), C.customer_type FROM Orders AS O JOIN Customers AS C ON O.customer_id = C.customer_id GROUP BY C.customer_type “‘ Sub task 3: Third add Visualize type and BINNING into the ...
-
[45]
For simple visualizations: - SELECT exactly TWO columns, X-axis and Y-axis(usually aggregate function) b
Binning: BIN [COLUMN] BY [INTERV AL], [INTERV AL]: [YEAR, MONTH, DAY , WEEKDAY] When generating VQL, we should always consider special rules and constraints: [Special Rules] a. For simple visualizations: - SELECT exactly TWO columns, X-axis and Y-axis(usually aggregate functio...
-
[47]
COLORED BY
Grouping column c. When "COLORED BY" is mentioned in the question: - Use complex visualization type(STACKED BAR for bar charts, GROUPED LINE for line charts, GROUPED SCATTER for scatter charts) - Make the "COLORED BY" column the third SELECT column - Do NOT include "COLORED BY...
-
[48]
First choose visualize type and binning, then construct a specific sketch for the natural language query
-
[49]
Second generate SQL components following the sketch
-
[50]
Third add Visualize type and BINNING into the SQL components to generate final VQL ============================== Here is a typical example: [Database Schema] # Table: course, (course) [ (course_id, course id, Value examples: [101, 696, 656, 659]. And this is an id type column...
2002
-
[51]
The course table contains information about individual courses, including the course title, department, and credits
-
[52]
The section table contains information about specific sections of courses, including the semester, year, building, room number, and time slot
-
[53]
The course_id column links the two tables, allowing us to associate sections with specific courses
-
[54]
The dept_name column in the course table will be used to filter for Psychology department courses
-
[55]
The year column in the section table will be used for yearly grouping and binning
-
[56]
The query involves joining these two tables to analyze the number of courses offered by the Psychology department each year, which requires aggregation and time-based binning
We need to count the number of courses offered each year, which requires aggregation and time-based binning. The query involves joining these two tables to analyze the number of courses offered by the Psychology department each year, which requires aggregation and time-based b...
-
[57]
We need to select 2 columns for LINE chart, year as X-axis, COUNT(year) as Y-axis
-
[58]
We need to join the course and section tables to get the number of courses offered by the Psychology department in each year
-
[59]
We need to filter the courses by the Psychology department
-
[60]
VIS TYPE + SQL + BINNING
We do not need to use any window function for YEAR. sql “‘sql SELECT S.year, COUNT(S.year) FROM course AS C JOIN section AS S ON C.course_id = S.course_id WHERE C.dept_name = ‘Psychology’ “‘ Sub task 3: Third add Visualize type and BINNING into the SQL components to generate f...
-
[61]
Visualization Type: bar, pie, line, scatter, stacked bar, grouped line, grouped scatter
-
[62]
SQL Components: SELECT, FROM, JOIN, WHERE, GROUP BY , ORDER BY
-
[63]
For simple visualizations: - SELECT exactly TWO columns, X-axis and Y-axis(usually aggregate function) b
Binning: BIN [COLUMN] BY [INTERV AL], [INTERV AL]: [YEAR, MONTH, DAY , WEEKDAY] When refining VQL, we should always consider special rules and constraints: [Special Rules] a. For simple visualizations: - SELECT exactly TWO columns, X-axis and Y-axis(usually aggregate function)...
-
[64]
Y-axis (aggregate function)
-
[65]
COLORED BY
Grouping column c. When "COLORED BY" is mentioned in the question: - Use complex visualization type(STACKED BAR for bar charts, GROUPED LINE for line charts, GROUPED SCATTER for scatter charts) - Make the "COLORED BY" column the third SELECT column - Do NOT include "COLORED BY...
-
[2018]
In 2018 IEEE 34th international conference on data engineering (ICDE), pages 101–112
Deepeye: Towards automatic data visualiza- tion. In 2018 IEEE 34th international conference on data engineering (ICDE), pages 101–112. IEEE. Yuyu Luo, Jiawei Tang, and Guoliang Li. 2021a. nvbench: A large-scale synthesized dataset for cross-domain natural language to visualiza...
2018 arXiv
-
[2020]
IEEE Transactions on Visualization and Computer Graphics, 27(2):369–379
Nl4dv: A toolkit for generating analytic spec- ifications for data visualization from natural lan- guage queries. IEEE Transactions on Visualization and Computer Graphics, 27(2):369–379. OpenAI. 2022. Chatgpt (gpt-3.5). https://openai. com/index/chatgpt/. OpenAI. 2024a. Gpt-4o...
2022 arXiv
-
[2023]
In Companion Proceedings of the ACM Web Confer- ence 2023, WWW ’23, page 49–52
Mirror: A natural language interface for data querying, summarization, and visualization. In Companion Proceedings of the ACM Web Confer- ence 2023, WWW ’23, page 49–52. ACM. Yao Xu, Shizhu He, Zeng Xiangrong, Jiabei Chen, Guang Liu, Bingning Wang, Jun Zhao, and Kang Liu. 2024...
2023 arXiv
-
[2024]
arXiv preprint arXiv:2406.13408
Sqlfixagent: Towards semantic-accurate sql generation via multi-agent collaboration. arXiv preprint arXiv:2406.13408. Chi-Min Chan, Weize Chen, Yusheng Su, Jianxuan Yu, Wei Xue, Shanghang Zhang, Jie Fu, and Zhiyuan Liu. 2023. Chateval: Towards better llm-based eval- uators thr...
2023 arXiv
Reviewed August 8, 2026 · model on record in the stance chip above.
Discussion (0). Continue with ORCID to comment.