Application of Bayesian Statistical Tools to SKA Telescopes Polarization Surveys to Study Magnetization of the Large-scale Structure of the Universe
Pith reviewed 2026-06-25 20:23 UTC · model grok-4.3
The pith
Bayesian analysis of Faraday rotation data shows 50,000 mid-frequency measurements with high-precision redshifts are needed to constrain magnetization in galaxy clusters.
A machine-rendered reading of the paper's core claim, the machinery that carries it, and where it could break.
Core claim
A Bayesian framework applied to large samples of Faraday rotation measures can separate contributions from galaxy clusters, filaments, and voids, with the result that 50,000 mid-frequency measurements and high-precision redshifts suffice to constrain magnetization in dense environments while 17,000 spectroscopic redshifts at low frequencies can provide initial constraints on filaments.
What carries the argument
Bayesian statistical approach to separating Faraday rotation contributions from different large-scale structure environments
If this is right
- Magnetization inside galaxy clusters becomes measurable once 50,000 mid-frequency Faraday rotation values are combined with precise redshifts.
- Initial limits on magnetization along filaments become feasible with low-frequency observations and spectroscopic redshifts for at least 17,000 sources.
- Magnetic fields in sheets and voids stay largely unconstrained even with the largest planned samples.
- Redshift accuracy directly determines whether environmental signals can be isolated without mixing.
Where Pith is reading between the lines
- Future optical or spectroscopic surveys will need to be coordinated with radio observations to meet the redshift requirements.
- The remaining difficulty for filaments suggests that stacking or cross-correlation techniques could be tested as ways to boost sensitivity.
- If the separation works, the same data set could be reanalyzed for other statistical properties of the magnetic field distribution.
Load-bearing premise
The spatial distribution of background radio sources, the coherence scales of magnetic fields, and the accuracy of redshift information will allow the Bayesian framework to cleanly separate contributions from clusters, filaments, and voids without significant contamination or model mismatch.
What would settle it
If real survey data produce magnetization estimates for clusters or filaments that disagree with independent probes such as X-ray or synchrotron observations at a level exceeding the expected statistical uncertainties, the required sample sizes would need revision.
Figures


read the original abstract
Understanding cosmological magnetic fields requires a detailed knowledge of magnetism in the different environments of the large-scale structure of the Universe. Magnetic fields are well known to inhabit galaxy clusters, and recently their presence has been detected between galaxy clusters, along filaments extending up to 10-15 Mpc. Beyond that, there is limited information on the existence of magnetic fields in sheets and voids of the cosmic web. We propose a Bayesian statistical approach to study magnetic fields on large scales through observations of the Faraday rotation effect in large samples of polarized point-like background radio sources. We present the expectations to detect magnetization in environments of the large-scale structure with the SKA-Mid polarization survey planned by the SKAO Magnetism Science Working Group and with SKA-Low with AA4 telescopes, and discuss the required level of accuracy on the redshifts of the host galaxies for such a study. We find that about 50,000 mid-frequency Faraday rotation measurements complemented by high-precision redshifts are needed to constrain magnetization of dense environments as galaxy clusters. Investigation of magnetization in weakly-magnetized low-density enviroments, as filaments, will remain challenging, but low frequencies radio observations and spectroscopic redhifts for at least 17,000 will allow us to put first constraints.
Editorial analysis
A structured set of objections, weighed in public.
Referee Report
Summary. The manuscript proposes a Bayesian hierarchical statistical framework for analyzing Faraday rotation measures (RMs) from polarized background sources in planned SKA-Mid and SKA-Low surveys. It derives numerical forecasts showing that approximately 50,000 mid-frequency RM measurements paired with high-precision redshifts are required to constrain magnetization in dense environments such as galaxy clusters, while low-frequency observations combined with at least 17,000 spectroscopic redshifts could yield initial constraints on weakly magnetized filaments.
Significance. If the underlying simulation pipeline, priors on coherence lengths, and source-density assumptions hold, the work supplies concrete observational targets that can directly inform SKAO Magnetism Science Working Group survey design and data-analysis strategies. The explicit forward-modeling of contributions from clusters, filaments, and voids, together with the hierarchical Bayesian separation, represents a strength that allows falsifiable predictions for required sample sizes.
minor comments (2)
- Abstract: the text contains typographical errors ('enviroments', 'redhifts') that should be corrected prior to publication.
- The presentation of the numerical thresholds (50,000 and 17,000) would be strengthened by an explicit statement, perhaps in the methods or results section, of how variations in the assumed spatial distribution of sources affect the final counts.
Simulated Author's Rebuttal
We thank the referee for their supportive review, positive assessment of the significance of our Bayesian hierarchical framework for SKA RM surveys, and recommendation for minor revision. No specific major comments were raised in the report.
Circularity Check
No significant circularity; forward-modeling forecasts are self-contained
full rationale
The manuscript performs forward-modeling of expected Faraday RM contributions from clusters, filaments and voids under an explicit Bayesian hierarchical model. The quoted thresholds (50 000 mid-frequency RMs with high-precision z; 17 000 spectroscopic redshifts at low frequency) are numerical outputs of that pipeline given stated priors on coherence lengths and source densities. No equation reduces a claimed prediction to a fitted parameter from the same dataset, no load-bearing self-citation chain is invoked, and the derivation does not rename known results or smuggle ansatzes. The work is therefore internally consistent and externally falsifiable against independent RM surveys and simulations.
Axiom & Free-Parameter Ledger
axioms (1)
- domain assumption Magnetic field properties and source distributions in clusters, filaments, and voids follow models that permit statistical separation via Bayesian inference.
Reference graph
Works this paper leans on
-
[1]
doi: 10.1093/mnras/133.1.67. E. Carretti et al.MNRAS, 512(1):945–959, May
-
[2]
doi: 10.1093/mnras/stac384. E. Carretti et al.MNRAS, 518(2):2273–2286, Jan
-
[3]
doi: 10.1093/mnras/stac2966. E. Carretti et al.A&A, 693:A208, Jan
-
[4]
doi: 10.1051/0004-6361/202451333. T. E. Clarke.Journal of Korean Astronomical Society, 37(5):337–342, Dec
-
[5]
doi: 10.5303/ JKAS.2004.37.5.337. T. A. Enßlin, M. Frommert, and F. S. Kitaura.Physical Review D, 80(10):105005, Nov
2004
-
[6]
doi: 10.1103/PhysRevD.80.105005. P. Frank, R. Leike, and T. A. Enßlin.Entropy, 23(7):853, July
-
[7]
GeometricVariationalInference.Entropy, 23(7):853, July 2021
doi: 10.3390/e23070853. F.GovoniandL.Feretti.InternationalJournalofModernPhysicsD,13(8):1549–1594,Jan.2004. doi: 10.1142/S0218271804005080. F. Govoni et al.Science, 364(6444):981–984, June
-
[8]
doi: 10.1126/science.aat7500. A. M. Hammond, T. Robishaw, and B. M. Gaensler.arXiv e-prints, art. arXiv:1209.1438, Sept
-
[9]
doi: 10.48550/arXiv.1209.1438. G. Heald et al.Galaxies, 8(3):53, July
-
[10]
doi: 10.3390/galaxies8030053. B. Hugo and R. Perley. art. SSA-0004E-001, Jan
-
[11]
doi: 10.1051/0004-6361/ 201935479. S. Hutschenreuter et al.A&A, 657:A43, Jan
-
[12]
doi: 10.1051/0004-6361/202140486. S. Hutschenreuter et al.A&A, 690:A314, Oct
-
[13]
doi: 10.1051/0004-6361/202346740. P. P. Kronberg et al.ApJ, 676(1):70–79, Mar
-
[14]
J.Linetal.RASTechniquesandInstruments,3(1):737–747,Jan.2024
doi: 10.1086/527281. J.Linetal.RASTechniquesandInstruments,3(1):737–747,Jan.2024. doi: 10.1093/rasti/rzae051. F. Loi et al.A&A, 694:A125, Feb
-
[15]
doi: 10.1051/0004-6361/202451711. V. Mainieri et al.arXiv e-prints, art. arXiv:2403.05398, Mar
-
[16]
doi: 10.48550/arXiv.2403. 05398. N. Mauri et al. InJournal of Physics Conference Series, volume 1342 ofJournal of Physics Conference Series, page 012122. IOP, Jan
-
[17]
doi: 10.1088/1742-6596/1342/1/012122. J. A. Newman and D. Gruen.ARA&A, 60:363–414, Aug
-
[18]
doi: 10.1051/0004-6361/201423995. S. P. O’Sullivan et al.MNRAS, 519(4):5723–5742, Mar
-
[19]
doi: 10.1093/mnras/stac3820. S.P.O’Sullivanetal. InAdvancingAstrophysicswiththeSKA–II(AASKAII).2026. arXivsearch: Report number AASKAII/OSullivan01. S. Piras et al.A&A, 687:A267, July
-
[20]
doi: 10.1051/0004-6361/202349085. L. Rudnick and F. N. Owen.ApJ, 785(1):45, Apr
-
[21]
doi: 10.1088/0004-637X/785/1/45. D. H. F. M. Schnitzeler.MNRAS, 409(1):L99–L103, Nov
-
[22]
doi: 10.1111/j.1745-3933.2010. 00957.x. J. M. Stil.ApJ, 987(2):173, July
-
[23]
doi: 10.3847/1538-4357/add69e. J. M. Stil, B. W. Keller, S. J. George, and A. R. Taylor.ApJ, 787(2):99, June
-
[24]
doi: 10.3847/1538-3881/ad4150. A. R. Taylor, J. M. Stil, and C. Sunstrum.ApJ, 702(2):1230–1236, Sept
-
[25]
doi: 10.3847/1538-4357/ ad22dd. V. Vacca et al. InAdvancing Astrophysics with the Square Kilometre Array (AASKA14), page 114, Apr
-
[26]
doi: 10.22323/1.215.0114. V. Vacca et al.A&A, 591:A13, June
-
[27]
DEFROST: Detecting Excess in Faraday Rotation thrOugh Sophisticated analysis Techniques
doi: 10.1051/0004-6361/201527291. V.Vaccaetal.arXive-prints,art.arXiv:2605.13605,May2026. doi: 10.48550/arXiv.2605.13605. 14 Application of Bayesian statistical tools to SKA telescopes polarization surveys Vacca et al. C. L. Van Eck et al.ApJSS, 267(2):28, Aug
work page internal anchor Pith review Pith/arXiv arXiv doi:10.1051/0004-6361/201527291
-
[28]
doi: 10.3847/1538-4365/acda24. T. Vernstrom et al.Science Advances, 9(7):eade7233, Feb
-
[29]
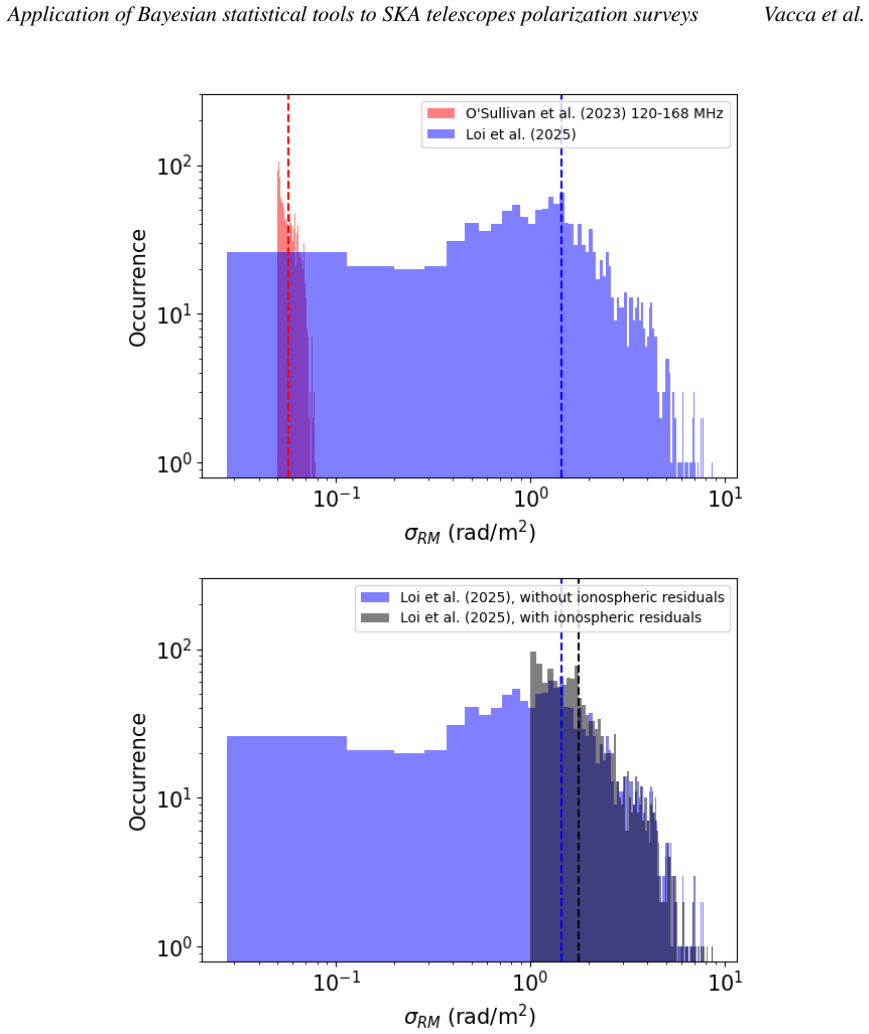
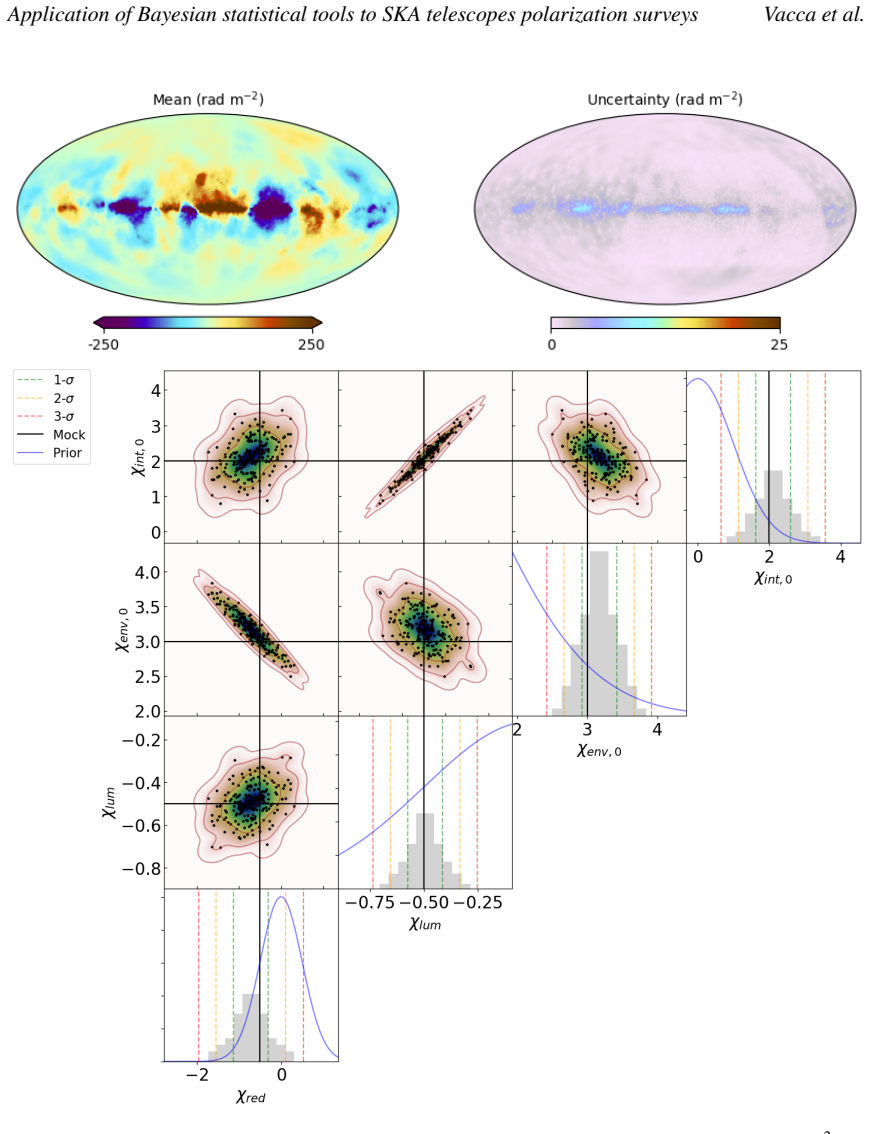
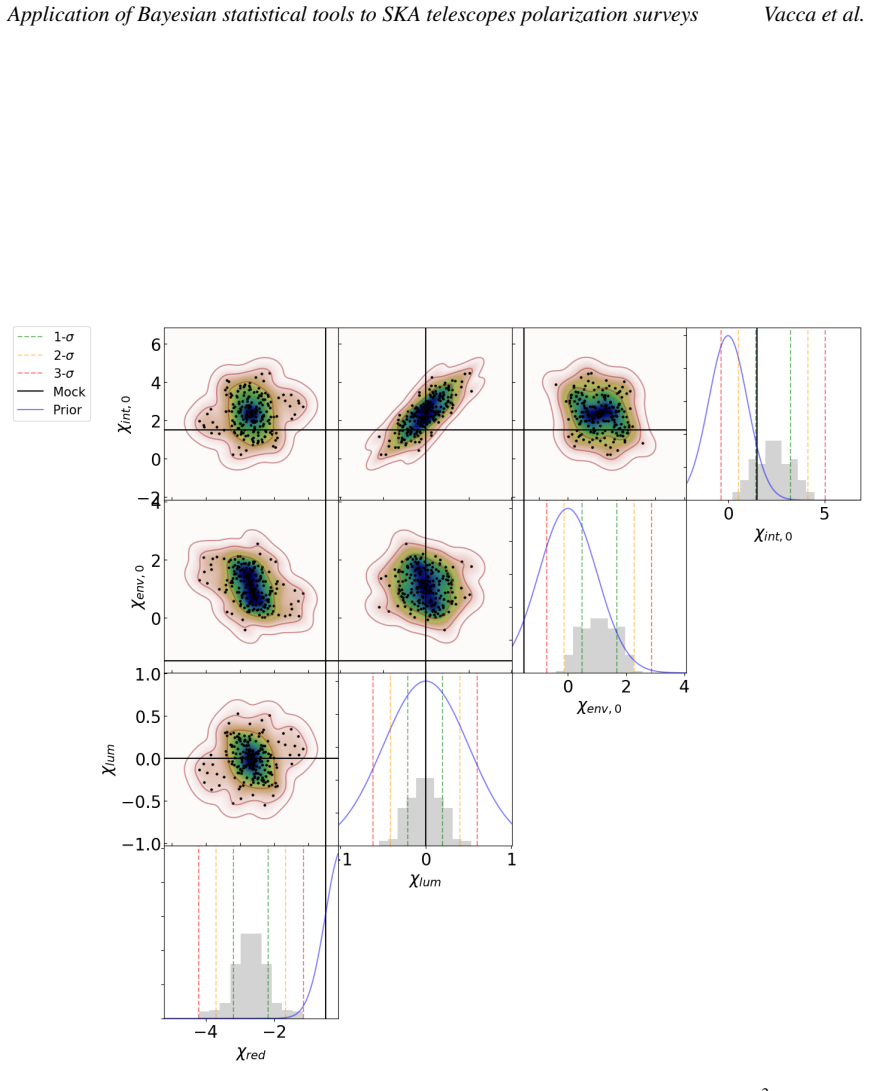
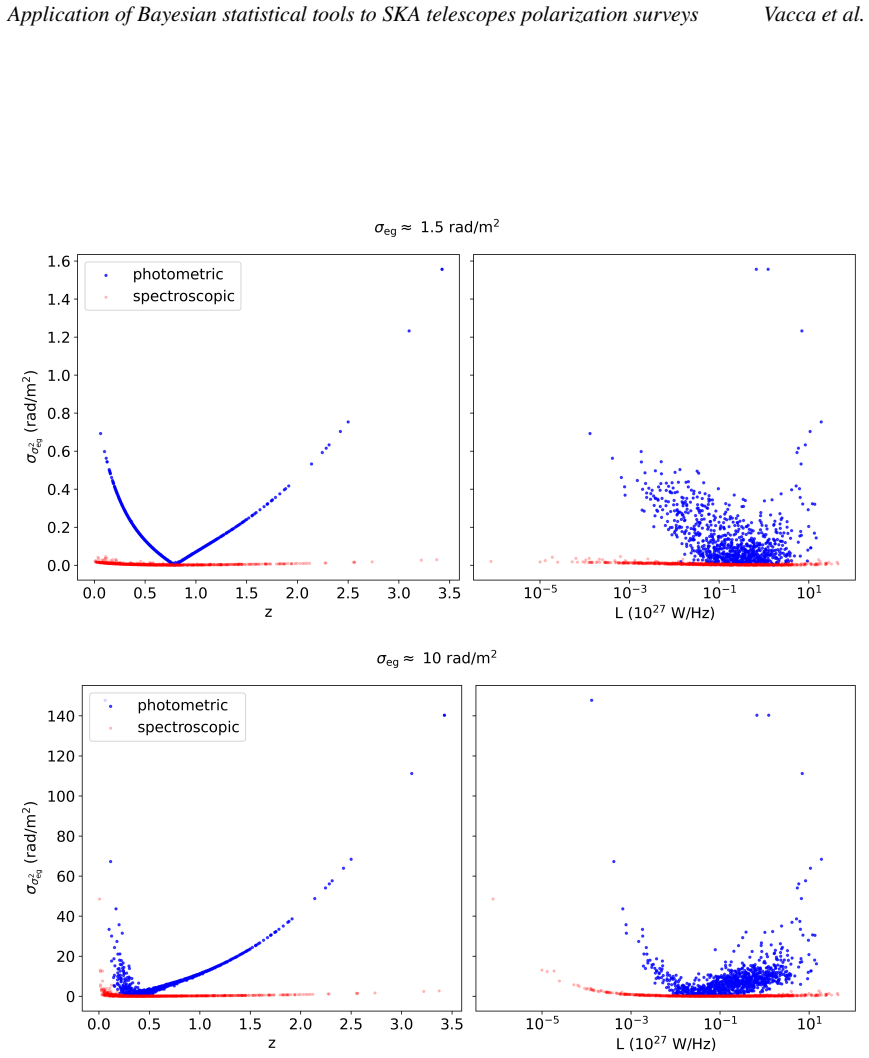
doi: 10.1126/sciadv.ade7233. 15 Application of Bayesian statistical tools to SKA telescopes polarization surveys Vacca et al. Figure3:ResultsobtainedassuminganextragalacticFaradayrotationstandarddeviationof≈10rad/m 2 and using a rotation measure catalogue based on observations at mid-frequencies.Top panels:Reconstructed meananduncertaintyoftheGalacticFara...
discussion (0)
Sign in with ORCID, Apple, or X to comment. Anyone can read and Pith papers without signing in.