REVIEW 4 major objections 6 minor 30 references
AI Analyst: Framework and Comprehensive Evaluation of Large Language Models for Financial Time Series Report Generation
T0 review · 4 major / 6 minor · reviewed 2026-08-06 · deepseek-v4-flash
Pith's one-line read This paper claims that LLMs can generate consistent and fluent financial reports directly from price tables and technical indicators, and proposes an end-to-end pipeline—prompt engineering, model selection, G-Eval scoring, and…
desk verdict Solid applied framework with a genuinely useful highlighting idea, but the paper's own tables undercut its ranking claims and the segment classification table appears misaligned. read the letter →
The pith
A machine-rendered reading of the paper's core claim, the machinery that carries it, and where it could break.
The reading
What carries the argument
The load-bearing mechanism is a three-stage framework. First, report generation: prompts that feed either a table of closing prices, a table of prices plus computed technical indicators (SMA, RSI, MACD, volatility), or the same tables plus indicator plots, with instructions to write a one-paragraph short report or a two-to-three-paragraph technical report. Second, evaluation: G-Eval, an LLM-based judge, here GPT-4o, scores each report on consistency, coherence, and fluency using the input time series as the source of truth, alongside human expert scoring on a sample. Third, segment source classification: GPT-4o labels each sentence as Direct Reference (a number or trend from the input), Financial Interpretation (analysis grounded only in the data), or External Knowledge (context from outside the series). The synthetic time series, generated by Geometric Brownian Motion both inside and beyond the models' training period, serve as the counterfactual probe that tests generalization and the effects of knowledge cutoff.
What would settle it
Have a panel of financial analysts, blinded to model identity, score a larger sample of reports from GPT-4o, GPT-4o-mini, Gemini, and Llama3.2 on consistency against the source tables; if GPT-4o is not ranked highest, or if the ordering changes when a non-GPT judge replaces GPT-4o in G-Eval, the paper's central performance claim is falsified.
Extended reading notes
Core claim
The paper's claim, stated on its own terms, is that LLMs equipped with a robust framework of prompt engineering, model selection, and evaluation metrics can effectively utilize time series data from major stock market indices to produce consistent and fluent financial reports. Among five tested models, GPT-4o consistently receives the highest G-Eval and human scores across short reports, technical-indicator reports, and plot-based reports, while Phi-3 is weakest and is excluded for repetitive prose and data-point errors. The paper also claims that its automated segment source classifier—assigning each sentence to Direct Reference, Financial Interpretation, or External Knowledge—achieves 80% accuracy and reveals that reports on data past the model's training cutoff contain less external knowledge and more direct data reference. Finally, the paper claims G-Eval is usable in finance but notes that human alignment is moderate: Spearman correlations are 0.33 for consistency, 0.57 for coherence, and 0.22 for fluency.
Load-bearing premise
The central claim depends on the assumption that GPT-4o's own scores reliably measure report quality; the paper's human checks agree with those scores only weakly on consistency (Spearman 0.33) and fluency (0.22), so if the judge is biased toward its own family, the model rankings and the temporal trends could be artifacts.
Editorial extensions
If this is right
- Financial institutions could use this framework to draft first-pass market commentary from price data alone, leaving human analysts to verify and edit.
- The highlighting system gives users a quick way to see which sentences are grounded in the data and which rely on outside facts, lowering the risk of silently passing off hallucinations as analysis.
- The post-cutoff decline in external knowledge suggests models can be steered toward data-grounded reasoning when world knowledge is stale, which is directly relevant for long-horizon or synthetic data.
- G-Eval's moderate human correlation warns that automated rankings should be treated as a screening tool rather than a final quality verdict, so end-to-end adoption should include human sampling.
- Smaller models like Phi-3 are not currently adequate for this task, so the framework's model-selection step is not optional.
Reading between the lines
- Beyond the paper, the weak consistency and fluency correlations (Spearman 0.33 and 0.22) imply that the specific model ordering would likely shift under a non-GPT judge; this is a directly testable corollary of the paper's own numbers.
- The segment classifier at 80% accuracy could be reused as a lightweight hallucination detector in any data-to-text setting, not just finance, by flagging claims that fall in the external-knowledge category when the source should suffice.
- The synthetic future-index design (2024–2029 data) is a reusable protocol for testing whether a model is truly reading the time series or pattern-matching to its training memory; applying it to other domains such as health metrics could separate reading from recall.
- The framework's focus on report generation rather than prediction means its quality bar is plausibility and auditability, not forecast accuracy; downstream users should evaluate the economics of human review time saved against the cost of catching hallucinations.
Editorial analysis
A structured set of objections, weighed in public.
Referee Report
Summary. The paper introduces AI Analyst, an end-to-end framework for generating financial reports from time series data. The framework comprises data preparation (real and synthetic indices), prompt engineering, model selection across five LLMs, automated evaluation with G-Eval and human expert evaluation, and a novel segment source classification system that labels report segments as Direct Reference, Financial Interpretation, or External Knowledge. Experiments on S&P 500, Nasdaq, DJIA, Nikkei 225, and synthetic series are used to claim that LLMs can produce consistent, fluent, and informative financial reports, with GPT-4o reported as the best model. The paper also presents linguistic analyses, hedging-word trends, temporal analyses around the training-data cutoff, and an error analysis of common failure modes.
Significance. If its evaluation were fully validated, the paper would be a useful contribution to an understudied task: generating analyst-style narratives directly from price tables and technical indicators. The framework is concrete and covers the full pipeline, and the automated highlighting of Direct Reference / Financial Interpretation / External Knowledge segments is a sensible interpretability tool with a practical audit value. The authors also make a good-faith effort to include human evaluation, to acknowledge the G-Eval self-family bias, and to test on synthetic data beyond the training cutoff. However, the evaluation evidence is not strong enough to support the paper's strongest ranking claims: the human sample is small, the reported human scores contradict several 'GPT-4o highest' statements, the automated judge is from the same model family as the top generator, and the G-Eval/human correlations are weak. The central capability claim is plausible and partially supported, but the specific model-ranking and post-cutoff temporal conclusions need substantial revision.
major comments (4)
- [§4.1, Table 1] The statement that 'Human Evaluation consistently rate GPT-4o as the highest-performing model across all dimensions' is not supported by Table 1. For real Short reports, GPT-4o-mini scores higher than GPT-4o on Consistency (3.96 vs 3.83) and Llama3.2 scores higher on Coherence (4.50 vs 4.33); for real TI reports, GPT-4o-mini scores higher on Consistency (4.17 vs 4.04); for synthetic Short reports, Gemini scores higher on Consistency (4.75 vs 4.33). Since the human evaluation sample is only 4 reports per model and report type and no significance tests are reported, the text overstates the ranking. Please either soften the claim to 'among the best models' or support it with appropriate statistical testing.
- [§3.3, §4.1, Table 2] The automated evaluation uses GPT-4o as the G-Eval judge while GPT-4o is also the top-scoring generator, and the paper's own correlations between G-Eval and human scores are weak (Spearman 0.33 for Consistency, 0.22 for Fluency). Consequently the model rankings, the statement that human evaluation 'largely aligns' with G-Eval, and the post-cutoff temporal analysis in Appendix E all rest on an evaluation whose validity for the financial domain is not established. Please either validate G-Eval with a different judge model family on at least a subset, or restrict the ranking and temporal conclusions to human-evaluated data and present G-Eval results as exploratory.
- [§4.1] The manual filtering of Llama3.2 'word salad' outputs before scoring introduces selection bias and breaks comparability across models. The manuscript does not report how many outputs were removed, what criteria defined 'word salad', or whether similar truncation artifacts occurred in other models. Please report the exclusion counts, apply the same screening procedure to all models, and discuss how this filtering affects the comparative scores in Table 1.
- [§4.4, Table 4] The segment source classifier obtains only 0.30 recall and 0.46 precision for Financial Interpretation, yet the temporal category proportions in Figure 4 and the corresponding claims about DR/FI/EK shifts are computed with this classifier. Because FI is one of the three categories driving those claims, the 80% overall accuracy is not sufficient to support the quantitative proportions. Please provide per-category reliability estimates for the temporal analysis, or validate the category proportions on a manually labeled sample of the temporal data, and temper the conclusions in §4.4 accordingly.
minor comments (6)
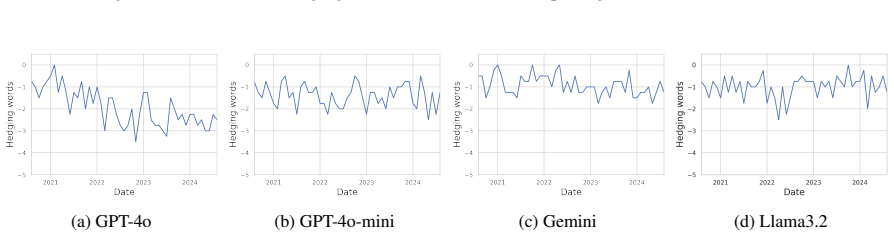
- [Figure 16] Subplot (d) is labeled 'Gemini' in both panels, but it appears to be intended for Llama3.2; please correct the label.
- [Appendix E] The text contains a typo: 'coference' should be 'coherence'.
- [§4.4] The word 'presedential' should be spelled 'presidential'.
- [Table 1] Phi-3 is shown only for the Short report rows, while the TI and TI(plots) rows omit it; since the exclusion is described only in prose, the table should either include those rows with a footnote or state the omission in the caption.
- [Table 5] The column header 'Retracemt.' is a typo for 'Retracement'.
- [§3.3] Please state the annotation instructions and inter-annotator agreement for the human evaluation; the current text says each report is scored by 3 annotators but does not report agreement, which would help interpret the human score variability.
Circularity Check
Partial circularity: GPT-4o's top ranking rests on G-Eval scores assigned by GPT-4o itself, with human validation that Table 1 contradicts.
-
other
[Section 3.3 and Section 4.1 (Table 1/Table 2); Section 6 Limitations]
"GPT-4o consistently generated the highest quality reports across all report types and evaluation metrics. [...] It is important to acknowledge a potential evaluation bias in G-Eval since it uses GPT-4o as the evaluator. Prior studies have shown that LLM-based evaluation tends to favor generations from the same model family, leading to systematically higher scores for GPT-4o-generated reports (Liu et al., 2023). While human evaluation largely aligns with G-Eval’s ranking, this potential bias should be considered when interpreting the results."
The ranking conclusion is load-bearing for the model-selection recommendation and the post-cutoff analysis. That ranking is generated by G-Eval, which uses GPT-4o as the evaluator; the paper itself cites prior evidence that such LLM evaluators favor their own model family. The human evaluation that could break the loop does not: Table 2 reports Spearman correlations of only 0.33 (consistency) and 0.22 (fluency), and Table 1 shows several human scores where GPT-4o is not highest (real Short consistency 3.83 vs 3.96 for GPT-4o-mini; synthetic Short consistency 4.33 vs 4.75 for Gemini; real TI consistency 4.04 vs 4.17 for GPT-4o-mini). Thus 'GPT-4o consistently highest' is not independent of the self-evaluation loop.
full rationale
The paper's core capability claim—that LLMs can produce coherent financial reports from time-series and technical-indicator inputs—is not circular: it is supported by concrete report examples, human expert scores on sampled reports, and linguistic analyses that do not depend on the model being evaluated. The segment-source highlighting system is also externally checked against a single expert annotator (Table 4, 80% accuracy), so it is not a self-validating definition. The only significant circularity is in the comparative model-ranking claim: G-Eval is performed by GPT-4o, the same family that generates the reports, and the paper acknowledges this same-family bias. The attempted human validation is weak (Table 2) and internally contradicted by Table 1, so the loop is not fully broken. This is a partial, not total, circularity; the paper's own Limitations section discloses the bias. Self-citations (e.g., Fons et al. 2024) are incidental and not load-bearing. The manual exclusion of Llama3.2 truncation artifacts is a fairness concern, not circularity.
Assumptions & free parameters
assumptions (4)
- domain assumption LLMs can meaningfully process numerical time series when values are rendered as text tables or plots.
- domain assumption G-Eval scores by GPT-4o correlate sufficiently with human judgment to guide model and prompt selection.
- domain assumption The three-way segment classification (Direct Reference, Financial Interpretation, External Knowledge) is well-defined and accurately recoverable by GPT-4o.
- domain assumption Synthetic GBM data for 2024-2029 represents a genuine out-of-distribution test of generalization.
invented entities (1)
-
Direct Reference / Financial Interpretation / External Knowledge segment categories
Cite this review
Pith. "Pith review of AI Analyst: Framework and Comprehensive Evaluation of Large Language Models for Financial Time Series Report Generation." pith.science (2026). https://pith.science/paper/GTTZ6FUW
@misc{pith2026250700718,
  author       = {Pith},
  title        = {Pith review of: AI Analyst: Framework and Comprehensive Evaluation of Large Language Models for Financial Time Series Report Generation},
  year         = {2026},
  howpublished = {\url{https://pith.science/paper/GTTZ6FUW}},
  note         = {Machine review of arXiv:2507.00718}
}
read the original abstract
This paper explores the potential of large language models (LLMs) to generate financial reports from time series data. We propose a framework encompassing prompt engineering, model selection, and evaluation. We introduce an automated highlighting system to categorize information within the generated reports, differentiating between insights derived directly from time series data, stemming from financial reasoning, and those reliant on external knowledge. This approach aids in evaluating the factual grounding and reasoning capabilities of the models. Our experiments, utilizing both data from the real stock market indices and synthetic time series, demonstrate the capability of LLMs to produce coherent and informative financial reports.
Figures


Figures from the paper (24 more)




Reference graph
Works this paper leans on
-
[2]
Large language models as finan- cial data annotators: A study on effectiveness and efficiency. InProceedings of the 2024 Joint In- ternational Conference on Computational Linguis- tics, Language Resources and Evaluation (LREC- COLING 2024), pages 10124–10145. Gerald Appel. 2005.Technical analysis: power tools for active investors, first edition. FT Press....
work page 2024
-
[3]
Analysis of material facts on financial assets: a generative ai approach. InProceedings of the Joint Workshop of the 7th Fi- nancial Technology and Natural Language Process- ing, the 5th Knowledge Discovery from Unstructured Data in Financial Services, and the 4th Workshop on Economics and Natural Language Processing@ LREC-COLING 2024, pages 103–118. Sata...
work page 2024
-
[5]
BADGE: BADminton report Generation and Evaluation with LLM
Badge: Badminton report generation and evaluation with llm.arXiv preprint arXiv:2406.18116. Abhimanyu Dubey, Abhinav Jauhri, Abhinav Pandey, Abhishek Kadian, Ahmad Al-Dahle, Aiesha Letman, Akhil Mathur, Alan Schelten, Amy Yang, Angela Fan, et al
-
[6]
The llama 3 herd of models.arXiv preprint arXiv:2407.21783. Elizabeth Fons, Rachneet Kaur, Soham Palande, Zhen Zeng, Tucker Balch, Manuela Veloso, and Svitlana Vyetrenko
-
[7]
Evaluating large language mod- els on time series feature understanding: A compre- hensive taxonomy and benchmark.arXiv preprint arXiv:2404.16563. Federal Reserve Bank of St. Louis FRED
-
[8]
Masayuki Kawarada, Tatsuya Ishigaki, and Hiroya Taka- mura
Llm-based nlg evaluation: Current status and challenges.arXiv preprint arXiv:2402.01383. Masayuki Kawarada, Tatsuya Ishigaki, and Hiroya Taka- mura
-
[9]
Prompting for numerical sequences: A case study on market comment generation. InPro- ceedings of the 2024 Joint International Conference on Computational Linguistics, Language Resources and Evaluation (LREC-COLING 2024), pages 13190– 13200. Xiang Li, Zhenyu Li, Chen Shi, Yong Xu, Qing Du, Mingkui Tan, and Jun Huang
work page 2024
-
[10]
Alphafin: Benchmarking financial analysis with retrieval- augmented stock-chain framework. InProceedings of the 2024 Joint International Conference on Compu- tational Linguistics, Language Resources and Evalu- ation (LREC-COLING 2024), pages 773–783. Xianzhi Li, Samuel Chan, Xiaodan Zhu, Yulong Pei, Zhiqiang Ma, Xiaomo Liu, and Sameena Shah
work page 2024
Show all 30 references
-
[11]
InProceedings of the 2023 Conference on Empirical Methods in Natural Language Processing: Industry Track, pages 408–422
Are chatgpt and gpt-4 general-purpose solvers for financial text analytics? a study on several typical tasks. InProceedings of the 2023 Conference on Empirical Methods in Natural Language Processing: Industry Track, pages 408–422. Chin-Yew Lin
2023
-
[12]
Yang Liu, Dan Iter, Yichong Xu, Shuohang Wang, Ruochen Xu, and Chenguang Zhu
Findabench: Benchmarking financial data analysis ability of large language models.Preprint, arXiv:2401.02982. Yang Liu, Dan Iter, Yichong Xu, Shuohang Wang, Ruochen Xu, and Chenguang Zhu
-
[13]
InProceedings of the 2023 Conference on Empirical Methods in Natural Language Processing, pages 2511–2522
G-eval: Nlg evaluation using gpt-4 with better human align- ment. InProceedings of the 2023 Conference on Empirical Methods in Natural Language Processing, pages 2511–2522. Burton. G. Malkiel. 1973.A Random Walk Down Wall Street. Norton, New York. Amaury Mantion, Melvin Kianma...
2023
-
[15]
Shunsuke Nishida, Yuki Zenimoto, Xiaotian Wang, Takuya Tamura, and Takehito Utsuro
A survey of large language models for financial applications: Progress, prospects and challenges.arXiv preprint arXiv:2406.11903. Shunsuke Nishida, Yuki Zenimoto, Xiaotian Wang, Takuya Tamura, and Takehito Utsuro
-
[16]
Kishore Papineni, Salim Roukos, Todd Ward, and Wei- Jing Zhu
Gpt-4 technical report.Preprint, arXiv:2303.08774. Kishore Papineni, Salim Roukos, Todd Ward, and Wei- Jing Zhu
-
[17]
Gemini: a family of highly capable multimodal models.arXiv preprint arXiv:2312.11805. Hugo Touvron, Louis Martin, Kevin Stone, Peter Al- bert, Amjad Almahairi, Yasmine Babaei, Nikolay Bashlykov, Soumya Batra, Prajjwal Bhargava, Shruti Bhosale, Dan Bikel, Lukas Blecher, Cristia...
-
[18]
Shijie Wu, Ozan Irsoy, Steven Lu, Vadim Dabravolski, Mark Dredze, Sebastian Gehrmann, Prabhanjan Kam- badur, David Rosenberg, and Gideon Mann
Llama 2: Open foundation and fine- tuned chat models.Preprint, arXiv:2307.09288. Shijie Wu, Ozan Irsoy, Steven Lu, Vadim Dabravolski, Mark Dredze, Sebastian Gehrmann, Prabhanjan Kam- badur, David Rosenberg, and Gideon Mann
-
[19]
arXiv preprint arXiv:2303.17564
Bloomberggpt: A large language model for finance. arXiv preprint arXiv:2303.17564. Hao Xue and Flora D Salim
-
[20]
Tian Zhou, Peisong Niu, Liang Sun, Rong Jin, et al
Temporal data meets llm–explainable financial time series forecast- ing.arXiv preprint arXiv:2306.11025. Tian Zhou, Peisong Niu, Liang Sun, Rong Jin, et al
-
[21]
Closing Prices: Date Close 2020-04-28 8607.7 2020-04-29 8914.7 2020-04-30 8889.6 2020-05-01 8605.0 Task: Long report generation with numerical technical indicators
One fits all: Power general time series analysis by pretrained lm.Advances in neural information processing systems, 36:43322–43355. 11 A Prompts We present the prompts used for the following tasks below. A.1 Report generation prompts Task: Short report generation "You are a f...
2020
-
[22]
This period demonstrated sustained growth momentum, driven by post - pandemic recovery expectations and strong corporate earnings . However, the index entered a volatile phase marked by significant fluctuations , influenced by concerns over inflation, interest rate adjustments...
2022
-
[23]
Despite these challenges, occasional recoveries occurred, indicating investor resilience
Key support levels around 3900 were tested repeatedly, with lows reaching 3666.8 on June 16, 2022, reflecting a more bearish sentiment as market participants grappled with economic uncertainties. Despite these challenges, occasional recoveries occurred, indicating investor res...
2022
-
[24]
This bullish trend was characterized by consistent gains with only minor pullbacks until early January 2022 . However, starting in January 2022, the index began to experience increased volatility , with significant declines, particularly observed in May and June 2022, where pr...
2022
-
[25]
From July 2021 to December 2021, the index experienced a general upward trajectory, increasing from approximately 4250 to 4800
**S&P Index Review** Based on the provided closing prices, the S&P index exhibited a moderate trend throughout the analyzed period, with some nota ble oscillations. From July 2021 to December 2021, the index experienced a general upward trajectory, increasing from approximatel...
2021
-
[27]
The index then experienced a sharp decline from October 11 to October 13, followed by a recovery and a gradual increase from October 13 to October 21 . The index then experienced a sharp Gemini Short Phi3 Short Issues: inaccurate description of upward trend from July 2021 thro...
2021
-
[28]
However, a modest recovery began in early December , as the index rebounded to close at 94.2 by December 25, 2024
This pattern reflects a broader market correction, indicating investor caution amid macroeconomic uncertainties . However, a modest recovery began in early December , as the index rebounded to close at 94.2 by December 25, 2024 . In the first half of 2025, the GMI's performanc...
2024
-
[29]
Despite this, the GMI remains relatively stable, exhibiting a volatility coefficient of 1.21 , indicating moderate price fluctuations
In addition, the rapid increase in the index prices from August to September 2025, which reached a 12.5% rise , highlights the volatility in the market. Despite this, the GMI remains relatively stable, exhibiting a volatility coefficient of 1.21 , indicating moderate price flu...
2025
-
[30]
From January 1 to January 10, the index saw a gradual increase in closing prices, reaching a peak of 94.1
The index then experienced a sharp decline from December 26 to December 31, reaching a low of 90.0 . From January 1 to January 10, the index saw a gradual increase in closing prices, reaching a peak of 94.1 . From January 11 to January 18, the index experienced a sharp decline...
2024
-
[2021]
The index then experienced a correction, dropping below 4,300 by the end of November
GPT-4o Short GPT-4o-mini Short Llama Short Issues: hallucination of numbers and months; mentioned data outside of the observed interval The S&P 500 index displayed a strong upward trend from July 2021 through October 2021, reaching a peak above 4,600 . The index then experienc...
2021
-
[2022]
A survey on deep learning and explainability for auto- matic report generation from medical images.ACM Computing Surveys (CSUR), 54(10s):1–40. John J. Murphy and John J. Murphy. 1999.Technical analysis of the financial markets. New York Institute of Finance, Fishkill, N.Y . Yu...
1999
-
[2023]
Shang-Hsuan Chiang, Lin-Wei Chao, Kuang-Da Wang, Chih-Chuan Wang, and Wen-Chih Peng
Can gpt models be financial analysts? an evalua- tion of chatgpt and gpt-4 on mock cfa exams.arXiv preprint arXiv:2310.08678. Shang-Hsuan Chiang, Lin-Wei Chao, Kuang-Da Wang, Chih-Chuan Wang, and Wen-Chih Peng
-
[2024]
Toyin D Aguda, Suchetha Siddagangappa, Elena Kochk- ina, Simerjot Kaur, Dongsheng Wang, and Charese Smiley
Phi-3 technical report: A highly capable language model locally on your phone.Preprint, arXiv:2404.14219. Toyin D Aguda, Suchetha Siddagangappa, Elena Kochk- ina, Simerjot Kaur, Dongsheng Wang, and Charese Smiley
Reviewed August 6, 2026 · model on record in the stance chip above.
Discussion (0). Sign in to comment.