REVIEW 3 major objections 5 minor 1 cited by
Uncovering Correlations and Biases in Parameter Inference from Neutron-Star Pulse Profile Modeling
T0 review · 3 major / 5 minor · reviewed 2026-08-11 · deepseek-v4-flash
Pith's one-line read Systematic errors in pulse-profile radius measurements reach about 1.5 km for neutron stars whose polar-cap temperature falls below the observed X-ray band.
desk verdict A useful reparameterization and a plausible warning about cool polar caps, but the headline bias is a self-consistency check of the analytic model rather than a calibrated systematic. read the letter →
The pith
A machine-rendered reading of the paper's core claim, the machinery that carries it, and where it could break.
The reading
What carries the argument
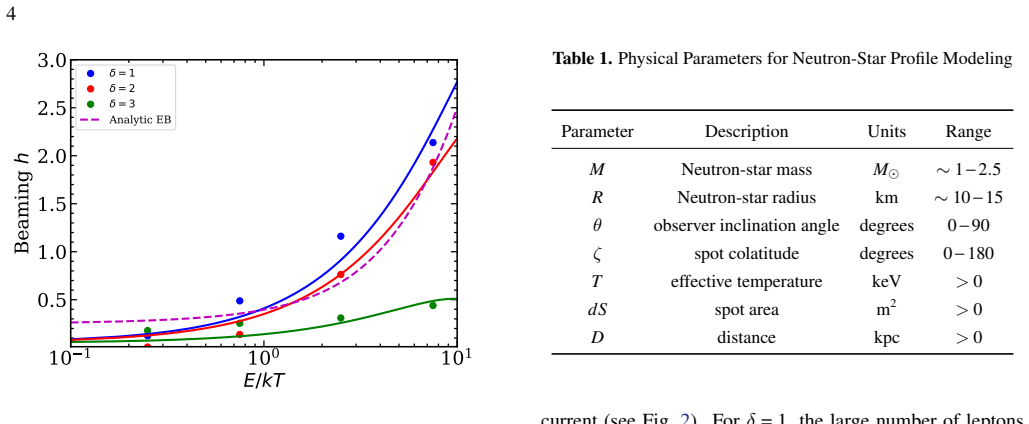
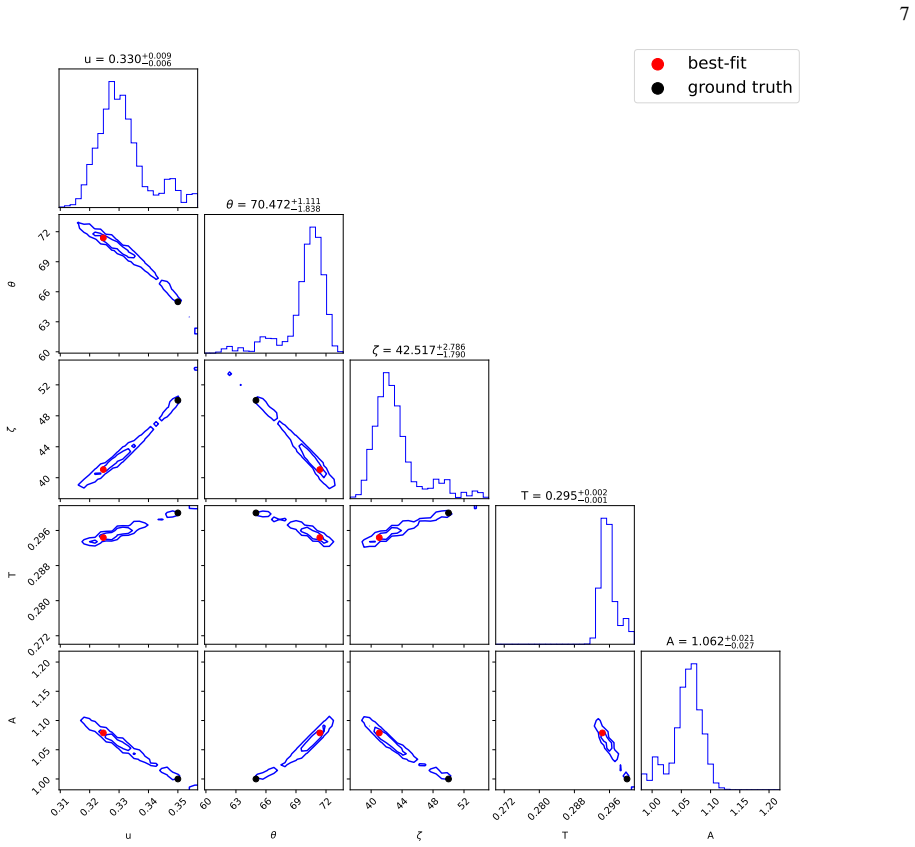
The load-bearing tool is an analytic Schwarzschild-plus-Doppler pulse profile model built on the approximate light-bending relation $\cos\alpha \approx u + (1-u)\cos\psi$, which lets the flux be written in closed form and expanded in Fourier harmonics. From that expansion the paper constructs a reparameterization — $q = u + (1-u)\cos\theta\cos\zeta$, $s = u - (1-u)\cos\theta\cos\zeta$, $p = (1-u)\sin\theta\sin\zeta$, $T_\infty = T'\sqrt{1-u}$, and $A = dS/D^2$ — that removes the strongest correlations and makes MCMC sampling efficient. The Fourier expressions show directly that for isotropic beaming the flux depends on the geometric parameters only through $p/q$, $p/s$, and $qA$, explaining the degeneracy analytically. The beaming factor $h(E',T')$ is fit to atmosphere models as a quadratic in $E'/kT'$, and the observed energy range then enters through the temperature dependence of the blackbody spectrum.
What would settle it
Generate synthetic NICER-like observations with a fully numerical ray-tracing code, including time delays and finite spot sizes, for stars with $T = 0.15$ keV and a range of geometries, then fit them with the paper's analytic model and MCMC pipeline; if the distribution of $u_{\rm fit} - u_{\rm syn}$ remains centered with width near 0.05, the energy-band bias is confirmed, whereas if the width drops to the formal statistical error, the claimed bias is an artifact of the analytic approximation.
Extended reading notes
Core claim
The central claim is that the systematic uncertainty in the inferred compactness $u = 2GM/Rc^2$ for neutron stars with effective temperatures $\lesssim 0.15$ keV can be as large as about 0.05, and up to about 0.1 depending on geometry, even when the total photon number is held fixed and the fitting model is the same one used to generate the data. This corresponds to a radius error of roughly 1.5 km for a typical neutron star. The paper also claims that isotropic beaming ($h=0$) creates a complete degeneracy in which only $p/q$, $p/s$, and $qA$ can be constrained, while $q$ is unconstrained, and that non-isotropic beaming is what allows $q$ to be measured. The implication is that a priori knowledge of the surface beaming and an energy range covering the spectral peak are prerequisites for trustworthy radius measurements from pulse profiles.
Load-bearing premise
The bias numbers come from fitting synthetic data that were generated with the same analytic model used for the fits; the model is checked against numerical ray tracing to within a few percent in flux, but a few percent model error is comparable to the roughly 0.05 compactness bias, so the magnitude or sign of the real-world bias could shift if the true light bending, time delays, or beaming differ.
Editorial extensions
If this is right
- For NICER-like observations of stars with $T \lesssim 0.15$ keV, the compactness inferred from a single pulse profile can be off by up to about 0.05, so any single-star radius claim should carry a systematic error budget of order 1 km, not just the formal MCMC error.
- Because the bias appears without any dependence on geometry or visibility class, averaging over multiple stars or geometries will not remove it; only observing a wider energy band or a hotter source would.
- With isotropic beaming the parameter $q$ is unconstrained, meaning that pulse profiles alone cannot fix the combination of compactness, inclination, and spot colatitude; a theory of surface beaming is needed to break the degeneracy.
- The new parameterization using $q$, $p/q$, $s/p$, $T_\infty$, and $Aq$ should make posterior sampling far more efficient in future analyses, potentially avoiding the multimodal sampling failures reported in earlier NICER reanalyses.
Reading between the lines
- If the claimed bias is real, then the published NICER radii for PSR J0030+0451 and PSR J0740+6620, both cool sources, may need corrections of order a kilometer, with the direction depending on the geometry of the spots.
- A natural extension the paper leaves implicit is to generate the synthetic data with a fully numerical ray-tracing code and fit them with the analytic model; if the ~0.05 compactness bias persists, it is a property of the energy band, whereas if it disappears, the analytic light-bending approximation is the source.
- The same reparameterization logic could be applied to more complex spot geometries, where non-antipodal or unequal spots introduce additional degeneracies; a Fourier analysis would likely reveal new invariant combinations of parameters.
- The paper's focus on the spectral peak suggests a concrete mission-level test: for a given target, verify that the observed energy band brackets the peak of the time-averaged spectrum before trusting a radius measurement from pulse profiles.
Signed reviews
Editorial analysis
A structured set of objections, weighed in public.
Referee Report
Summary. The paper constructs an analytic Schwarzschild+Doppler model for X-ray pulse profiles from a neutron star with two antipodal hot spots, introduces a reparametrization (q, s, p, T∞, A) intended to reduce parameter correlations, and studies, via MCMC fits to synthetic NICER-like data, how beaming and the observed energy range affect parameter recovery. The main quantitative result is that for cool effective temperatures (T ≈ 0.15 keV), where the spectral peak falls at or outside the low-energy edge of the NICER band, the recovered compactness scatters by up to about 0.05–0.1 depending on geometry and noise realization (Section 6, Figures 7–8). The analytic model is compared to numerical ray tracing in Appendix A, with flux residuals below about 0.5% for a small spot at 1 Hz and about 2.5% at 200 Hz.
Significance. The reparametrization in Section 3 is a genuinely useful contribution: it makes degeneracies analytically transparent and can accelerate posterior exploration in pulse-profile modeling. The demonstration that non-isotropic beaming breaks the q-degeneracy and that the location of the spectral peak relative to the observed band strongly affects parameter constraints is relevant to interpreting current NICER results. The beaming coefficients are anchored to external Salmi et al. (2020) atmosphere models rather than tuned to the paper's own outputs, which is a methodological strength. The main limitation is that the headline quantitative bias is measured under the same analytic forward model used to generate the data, so its real-world applicability depends on the model-validation step that is currently only performed at the flux level.
major comments (3)
- [§6, Figs. 7–8] The central claim that cool stars incur compactness systematics as large as ~0.05–0.1 is obtained by generating and fitting synthetic pulse profiles with the same analytic S+D model (Section 4). This measures the scatter of the posterior mode under the assumed forward model, not the systematic error that would arise from model misspecification. Appendix A validates the analytic model only at the level of flux residuals (≲2.5% at 200 Hz, ~10% at 500 Hz) for a limited set of geometries and spot sizes, and does not propagate those residuals into parameter posteriors. Because a flux error of ~2.5% is comparable to the claimed compactness shift (Δu ≈ 0.05 is ~11% of u = 0.45), the magnitude and even the sign of the effect could change if the true light bending, time delays, finite spot size, or beaming differ from the analytic treatment. I request a validation in which numerical ray-tracing profiles (or at least an approximate model-error injection at the 2–3% level) are fitted with the analytic model and the ufit−usyn distributions are recomputed; alternatively, the claims in Section 6 should be explicitly restricted to 'bias under the analytic model.'
- [§2.2 vs. Appendix A] The main analysis assumes δD = γ = 1 and neglects Doppler effects (Section 2.2), yet Appendix A validates the analytic model against numerical ray tracing at 200 Hz and 500 Hz using an analytic calculation in which the Doppler factor was retained. Consequently the model used for the Section 5.3 bias study is not exactly the model validated in Appendix A. Since the primary NICER targets spin at 170–270 Hz and the Doppler factor enters as the fourth power in flux, the paper should either include Doppler effects in the synthetic data and the fitting model, or explicitly state that the bias study excludes them and justify that the omission does not change the conclusions.
- [§5.1, Fig. 3; §6, Fig. 8] The single-realization shift Δu = −0.02 reported in Section 5.1 is a finite-noise fluctuation of the posterior mode, not a demonstrated systematic bias. In the same vein, the distributions in Figure 8 are centered near zero (median 0.003 and −0.002 for the two temperatures), so the quantity being reported is an inflation of the scatter of the point estimate rather than a persistent offset. The text should consistently distinguish 'increased scatter' from 'systematic bias' when discussing ufit−usyn, since the abstract and summary currently use 'systematics' and 'biases' interchangeably.
minor comments (5)
- [Table 2] In the row for s, the range is given as '-1 < q < 1'; it should presumably read '-1 < s < 1.'
- [§5.3] The scan is described as 'for 10° ≤ θ ≤ 80° and 10° ≤ θ ≤ 80°'; the second variable should be ζ, the spot colatitude.
- [Fig. 8] The solid 'cumulative distributions' are computed over a prescribed grid of θ and ζ values rather than draws from a specified prior. Calling them cumulative distributions and quoting quantiles assumes a weighting that is not described; please specify the exact grid and weighting used.
- [Appendix A, Figs. 9–11] The residual panels in Figures 9–11 use different vertical scales; please state the scales explicitly in the captions so that the reader can compare the magnitudes of the residuals.
- [§4] The paper does not report convergence diagnostics for the MCMC chains (e.g., Gelman-Rubin statistics, chain lengths, acceptance rates) or a statement on code availability; adding these would improve reproducibility.
Circularity Check
No significant circularity: degeneracy claims are derived algebraically from the paper's own Fourier expansions, beaming coefficients are fitted to external Salmi et al. (2020) models, and the compactness-bias numbers are Monte Carlo outputs under a stated forward model rather than fitted inputs.
full rationale
The paper's derivation chain is non-circular. The analytic flux model in Section 2 comes from the external Beloborodov (2002) and Poutanen & Beloborodov (2006) S+D framework; the one self-cited correction (Psaltis et al. 2019, the 1/gamma factor) is explicitly set to unity for the calculations and is therefore not load-bearing. The 'weakly degenerate' parameters q, s, p, T_inf, and A introduced in Table 2 are algebraic combinations of the physical parameters, and the claimed degeneracies follow from the paper's own Fourier amplitudes (eqs. 16-35), not from any fitted value. The beaming-function coefficients (Table 3) are obtained by fitting Equation (B1) to the external Salmi et al. (2020) atmosphere models and then fixed; they are inputs to the forward model, not quantities the paper claims to predict. The headline compactness bias of ~0.05 for cool stars (Section 6, Figures 7-8) is the result of generating synthetic data with the analytic model and fitting those data with the same model; this is a controlled Monte Carlo estimate of estimator bias under a stated generative model, so the output is not equivalent by construction to an input (the fitted u is not a parameter used to generate the data). Appendix A compares the analytic model to numerical ray tracing and explicitly reports residuals of <=2.5% at 200 Hz and up to ~10% at 500 Hz; this is an acknowledged model-validity limitation, not a circular step, because the bias calculation is conditional on the analytic model and the numerical check is not a fitted input. The caveat that the real-world bias could differ if the forward model is inaccurate is a model-validity concern, not circular reasoning.
Assumptions & free parameters
free parameters (2)
- Beaming fit coefficients a, b, c =
a=0.0500, b=0.3695/0.3106/0.0955, c=-0.00976 for delta=1,2,3
- Effective temperature of beaming fits Teff =
0.4 keV
assumptions (6)
- domain assumption Schwarzschild+Doppler spacetime with Beloborodov light-bending approximation (eq. 3)
- domain assumption Two antipodal hot spots of equal size and temperature
- domain assumption Blackbody spectrum with beaming factor normalization eq. (7)
- domain assumption Doppler effects neglected (delta_D = gamma = 1)
- domain assumption Spot treated as infinitesimally small
- domain assumption Flat-top priors over model parameters
Cite this review
Pith. "Pith review of Uncovering Correlations and Biases in Parameter Inference from Neutron-Star Pulse Profile Modeling." pith.science (2026). https://pith.science/paper/HPF5X6PK
@misc{pith2026241212283,
  author       = {Pith},
  title        = {Pith review of: Uncovering Correlations and Biases in Parameter Inference from Neutron-Star Pulse Profile Modeling},
  year         = {2026},
  howpublished = {\url{https://pith.science/paper/HPF5X6PK}},
  note         = {Machine review of arXiv:2412.12283}
}
read the original abstract
Modeling of X-ray pulse profiles from millisecond pulsars offers a promising method of inferring the mass-to-radius ratios of neutron stars. Recent observations with NICER resulted in measurements of radii for three neutron stars using this technique. In this paper, we explore correlations between model parameters and the degree to which individual parameters can be inferred from pulse profiles, using an analytic model that allows for an efficient and interpretable exploration. We introduce a new set of model parameters that reduce the most prominent correlations and allow for an efficient sampling of posteriors. We then demonstrate that the degree of beaming of radiation emerging from the neutron star surface has a large impact on the uncertainties in the inferred model parameters. Finally, we show that the uncertainties in the model parameters for neutron stars for which the polar cap temperature falls outside of the NICER energy range are significantly degraded.
Figures

Figures from the paper (7 more)


Forward citations
Cited by 1 Pith paper
-
Constraining Pulsar Radiative Geometry via Multi-wavelength Modeling
Joint X-ray pulse-profile and radio RVM modeling can locate the polarization focus and test whether propagation effects dominate pulsar radio polarization.
Reference graph
Works this paper leans on
-
[1]
Abbott, B. P., Abbott, R., Abbott, T. D., et al. 2018, PhRvL, 121, 161101 Bauböck, M., Psaltis, D., & Özel, F. 2015a, ApJ, 811, 144 —. 2015b, ApJ, 811, 144 —. 2019, ApJ, 872, 162
work page 2018
-
[2]
Beloborodov, A. M. 2002, ApJL, 566, L85
work page 2002
-
[3]
2013, ApJ, 762, 96
Bogdanov, S. 2013, ApJ, 762, 96
2013
-
[4]
E., & Rybicki, G
Bogdanov, S., Grindlay, J. E., & Rybicki, G. B. 2008, ApJ, 689, 407
2008
-
[5]
B., & Grindlay, J
Bogdanov, S., Rybicki, G. B., & Grindlay, J. E. 2007, ApJ, 670, 668
2007
- [6]
- [7]
-
[8]
M., Leahy, D., & Campbell, S
Cadeau, C., Morsink, S. M., Leahy, D., & Campbell, S. S. 2007, ApJ, 654, 458
2007
Show all 36 references
-
[9]
2024, ApJL, 971, L20
Choudhury, D., Salmi, T., Vinciguerra, S., et al. 2024, ApJL, 971, L20
2024
-
[10]
T., Fonseca, E., Ransom, S
Cromartie, H. T., Fonseca, E., Ransom, S. M., et al. 2020, Nature Astronomy, 4, 72
2020
-
[11]
Hessels, J. W. T. 2010, Nature, 467, 1081 Güver, T., Özel, F., Cabrera-Lavers, A., & Wroblewski, P. 2010a, ApJ, 712, 964 Güver, T., Wroblewski, P., Camarota, L., & Özel, F. 2010b, ApJ, 719, 1807
2010
-
[12]
O., Edmonds, P
Heinke, C. O., Edmonds, P. D., Grindlay, J. E., et al. 2003, ApJ, 590, 809
2003
-
[13]
O., Rybicki, G
Heinke, C. O., Rybicki, G. B., Narayan, R., & Grindlay, J. E. 2006, ApJ, 644, 1090
2006
-
[14]
E., Özel, F., & Psaltis, D
Lockhart, W., Gralla, S. E., Özel, F., & Psaltis, D. 2019, MNRAS, 490, 1774
2019
-
[15]
1978, Stellar atmospheres
Mihalas, D. 1978, Stellar atmospheres
1978
-
[16]
C., Lamb, F
Miller, M. C., Lamb, F. K., Dittmann, A. J., et al. 2019, ApJL, 887, L24 —. 2021, ApJL, 918, L28
2019
-
[17]
1983, ApJ, 270, 119
Morrison, R., & McCammon, D. 1983, ApJ, 270, 119
1983
-
[18]
M., & Leahy, D
Morsink, S. M., & Leahy, D. A. 2011, ApJ, 726, 56 Özel, F., Baym, G., & Güver, T. 2010, PhRvD, 82, 101301 Özel, F., & Freire, P. 2016, ARA&A, 54, 401 Özel, F., Güver, T., & Psaltis, D. 2009, ApJ, 693, 1775 Özel, F., Psaltis, D., Arzoumanian, Z., Morsink, S., & Bauböck, M. 2016...
2011
-
[19]
R., Ftaclas, C., & Cohen, J
Pechenick, K. R., Ftaclas, C., & Cohen, J. M. 1983, ApJ, 274, 846
1983
-
[20]
2020, A&A, 640, A24
Poutanen, J. 2020, A&A, 640, A24
2020
-
[21]
Poutanen, J., & Beloborodov, A. M. 2006, MNRAS, 373, 836
2006
-
[22]
2014, ApJ, 792, 87
Psaltis, D., & Özel, F. 2014, ApJ, 792, 87
2014
-
[23]
2019, Physical Set-Up and Approximations for Light Curve Modeling, doi:10.5281/zenodo.3534254
Psaltis, D., Ozel, F., Baubock, M., & Chan, C.-K. 2019, Physical Set-Up and Approximations for Light Curve Modeling, doi:10.5281/zenodo.3534254
2019 doi
-
[24]
2014, ApJ, 787, 136
Psaltis, D., Özel, F., & Chakrabarty, D. 2014, ApJ, 787, 136
2014
-
[25]
2022, ApJ, 928, 55
Psaltis, D., Özel, F., Medeiros, L., et al. 2022, ApJ, 928, 55
2022
-
[26]
A., Özel, F., & Psaltis, D
Raithel, C. A., Özel, F., & Psaltis, D. 2018, ApJL, 857, L23 —. 2021, ApJ, 908, 103
2018
-
[27]
E., Watts, A
Riley, T. E., Watts, A. L., Bogdanov, S., et al. 2019, ApJL, 887, L21
2019
-
[28]
E., Watts, A
Riley, T. E., Watts, A. L., Ray, P. S., et al. 2021, ApJL, 918, L27
2021
-
[29]
2018, A&A, 618, A161
Salmi, T., Nättilä, J., & Poutanen, J. 2018, A&A, 618, A161
2018
-
[30]
F., Nättilä, J., & Poutanen, J
Salmi, T., Suleimanov, V . F., Nättilä, J., & Poutanen, J. 2020, A&A, 641, A15
2020
-
[31]
2023, ApJ, 956, 138
Salmi, T., Vinciguerra, S., Choudhury, D., et al. 2023, ApJ, 956, 138
2023
-
[32]
2024, arXiv e-prints, arXiv:2406.14466
Salmi, T., Choudhury, D., Kini, Y ., et al. 2024, arXiv e-prints, arXiv:2406.14466
2024 arXiv
-
[33]
W., Lattimer, J
Steiner, A. W., Lattimer, J. M., & Brown, E. F. 2010, ApJ, 722, 33 —. 2013, ApJL, 765, L5
2010
-
[34]
N., & Arons, J
Timokhin, A. N., & Arons, J. 2013, MNRAS, 429, 20
2013
-
[35]
L., et al
Vinciguerra, S., Salmi, T., Watts, A. L., et al. 2023, ApJ, 959, 55 —. 2024, ApJ, 961, 62
2023
-
[36]
2024, ApJ, submitted
Zhao, T., Psaltis, D., & Özel, F. 2024, ApJ, submitted
2024
Reviewed August 11, 2026 · model on record in the stance chip above.
Discussion (0). Continue with ORCID to comment.