REVIEW 4 major objections 6 minor 66 references
Time-varying Parameter Tensor Vector Autoregression
T0 review · 4 major / 6 minor · reviewed 2026-08-15 · deepseek-v4-flash
Pith's one-line read A plug-in conditional DIC reliably selects the configuration and rank of a time-varying tensor VAR.
desk verdict A credible, workmanlike extension of tensor VARs to time-varying coefficients; the DIC selection story holds within its stated model family and the paper deserves peer review with requests for robustness checks and code. read the letter →
The pith
A machine-rendered reading of the paper's core claim, the machinery that carries it, and where it could break.
The reading
What carries the argument
The central object is the third-order coefficient tensor $A_t \in \mathbb{R}^{N\times N\times P}$ in the VAR $\boldsymbol{y}_t = A_{t,(1)}\boldsymbol{x}_t + \boldsymbol{\epsilon}_t$, subject to a CP decomposition in which one of the three factor families is time-varying, for example $A_t = \sum_{r=1}^R \boldsymbol{\beta}^{(r)}_{1,t} \circ \boldsymbol{\beta}^{(r)}_2 \circ \boldsymbol{\beta}^{(r)}_3$. The vectorized time-varying loading follows a random walk, giving a state-space model sampled by a Gibbs sampler with forward-filtering backward-sampling. Model selection is carried by $DIC_{c,1}$, which plugs in the posterior mean of $A_t$ itself, and by the 'kneedle' knee-point detector applied to the sequence of $DIC_{c,1}$ values across ranks. The machinery works because the composite tensor is identified even though its margins are not, so the plug-in deviance is computed from a well-mixing, identifiable quantity.
What would settle it
Simulate 100 data sets from a TVP-TVAR in which two loadings (say response and predictor) both follow random walks, then run the paper's four-configuration comparison: if $DIC_{c,1}$ selects one of the restricted configurations with high confidence rather than flagging misspecification, the criterion's configuration choice is not reliable for multi-loading dynamics. A cheaper check is to fit a model allowing all three loadings to vary on the fMRI data and see whether the time-varying connectivity pattern or the parameter reduction survives.
Extended reading notes
Core claim
The paper's central claim is that a specific conditional DIC, $DIC_{c,1}$, solves model selection for TVP-TVARs by scoring the identified composite tensor rather than the weakly identified loading factors. Because CP loadings are identifiable only up to sign switching and permutation, their MCMC chains mix poorly, and DIC variants that plug in loading means inherit large Monte Carlo error; $DIC_{c,1}$ avoids this by plugging in the posterior mean of the coefficient tensor $A_t$ itself. Simulations over 100 data sets per configuration show that $DIC_{c,1}$ selects the true configuration in nearly all cases and, combined with knee point detection on the DIC-versus-rank curve, recovers the true rank instead of defaulting to the maximum. The paper therefore recommends $DIC_{c,1}$ with the 'kneedle' algorithm for configuration and rank choice. On 32 fMRI data sets from story reading, the selected model is most often TVP-TVAR(4,1), meaning a time-varying response loading, with parameter reductions above 90%, and Granger causality counts rise and fall with the narrative.
Load-bearing premise
The load-bearing assumption is that the true data-generating process has a fixed-rank CP tensor form with exactly one time-varying loading; if real dynamics involve several loadings changing together, all four compared configurations are misspecified and the selected one is only the best of a restricted family.
Editorial extensions
If this is right
- Practitioners can select both the configuration and the rank of a TVP-TVAR from a modest number of MCMC runs, using $DIC_{c,1}$ plus knee point detection rather than fitting the full model space exhaustively.
- The number of estimated parameters scales as $(2N+P)R$ instead of $N^2P$, so high-dimensional VARs become feasible; the fMRI application reports over 90% parameter reduction.
- The finding that the response loading is time-varying for most subjects implies that Granger-causal connectivity patterns are time-dependent and that static VAR estimates would miss narrative-linked structure.
- Knee point detection should be used rather than minimum DIC when rank is the target, because DIC underpenalizes overfitted tensor ranks.
- Conditional DICs based on identified composite quantities can outperform marginal DICs in state-space models whose latent components are only weakly identified.
Reading between the lines
- The same logic suggests a general principle: in any Bayesian latent-variable model where a low-rank or compressed parameter is identified while its factors are not, model selection criteria should be evaluated on the identified composite parameter rather than on the factors themselves.
- A natural stress test is to generate data from a TVP-TVAR with two or three loadings varying jointly; if $DIC_{c,1}$ then confidently prefers one of the three restricted configurations, the fMRI conclusion that connectivity dynamics are time-varying may be an artifact of the restricted model family.
- The knee-point procedure's performance may depend on the chosen maximum rank $R^*$ and on the number of ranks evaluated; a systematic sensitivity check would clarify when the improvement is robust.
- The Granger causality interpretation could be validated out-of-sample by checking whether the narrative-linked rise and fall in connectivity counts reproduces across subjects or across chapters.
Signed reviews
Editorial analysis
A structured set of objections, weighed in public.
Referee Report
Summary. This paper proposes a time-varying parameter tensor vector autoregression (TVP-TVAR) in which the VAR coefficient tensor has a CP decomposition and exactly one of the three loadings evolves as a random walk; the other two loadings remain time-invariant. Posterior inference is carried out with a Gibbs sampler using forward-filtering backward-sampling and closed-form full conditionals. The paper compares conditional and marginal DIC variants, recommends the conditional variant DIC_c,1, and uses the kneedle algorithm to select the CP rank. A Monte Carlo study with 3-variable, 200-observation data sets generated from TVAR(3) and TVP-TVAR(3,j), j=1,2,3, reports configuration recovery around 90% or better and improved rank selection with knee-point detection. The method is applied to 32 fMRI runs from the Wehbe et al. (2014) story-reading data, selecting TVP-TVAR(4,1) for most runs and reporting time-varying Granger causality networks. The paper claims over 90% reduction in parameters relative to standard VARs and argues that the empirical results support time-varying brain connectivity.
Significance. If the selection and rank procedures are reliable, the paper offers a practical way to fit high-dimensional TVP-VARs with strong parameter reduction and interpretable dynamic connectivity. The paper is clear about the state-space representation and provides explicit full conditionals, making the sampler implementable. The Monte Carlo study uses an external synthetic-data benchmark with known true configuration and rank, and the confusion matrix in Table 1 is encouraging. The knee-point idea addresses a real overfitting tendency of DIC for rank selection. The main significance is conditional on the restricted one-time-varying-loading CP family; the evidence does not yet establish that the selected configuration is meaningful under misspecification.
major comments (4)
- [Section 5 (Table 1) and Section 2.2] The configuration-selection evidence is confined to data generated from exactly the four model classes considered, with rank fixed at 3. Section 2.2 explicitly states that multiple time-varying loadings are possible but are not modeled. The fMRI conclusion that brain connectivity dynamics are time-varying rests on comparing TVAR with three one-time-varying-loading CP models; a data-generating process with two or three time-varying loadings, or an unrestricted TVP-VAR, could be best approximated by TVP-TVAR(4,1) without that model being true. To support the abstract's claim that DIC_c,1 'accurately identifies true model configurations' outside the correctly specified family, the authors should add Monte Carlo scenarios with multiple time-varying loadings and with a full TVP-VAR, and report configuration selection and DIC gaps for those scenarios.
- [Section 5.2 (Figure 2)] The claim that DIC_c,1 has lower Monte Carlo error than DIC_c,2 and DIC_m is demonstrated only for data generated from TVP-TVAR(3,1) with rank 3, and the histograms in panels (b) and (c) exclude several data sets by truncation. The text says the truncated panels 'account for 93 data sets,' but the behavior of the remaining 7 data sets is not described. Please provide Monte Carlo error comparisons for all four true configurations and a range of ranks, or explicitly qualify the reliability claim to the single scenario examined.
- [Section 4 and Figure 5] Knee-point detection is used as the primary rank-selection device, but no distributional or consistency justification is given. The method assumes the DIC curve is monotone decreasing and selects the point of maximum curvature; the paper does not report how often this assumption fails or how sensitive the selected rank is to the normalization step. In Figure 5a, even with knee-point detection, fewer than 60 of 100 data sets recover the true rank 3, with most errors at ranks 2 and 4. The authors should report rank-selection accuracy numerically for all configurations and compare the knee-point rule with alternatives such as marginal-likelihood-based selection or a formal penalized criterion.
- [Section 6.3 (Figures 7-8)] The fMRI narrative-alignment conclusion is based on one subject-run data set, with Granger causality thresholds delta=0.01 and p*=99.9% set without sensitivity analysis. The temporal pattern in Figure 7 and the network interpretation in Figure 8 could change materially under small threshold perturbations, so a robustness check across thresholds and across the 32 data sets is needed before the narrative-progression claim can be accepted as a general empirical finding.
minor comments (6)
- [Equation (2.3)] The third margin in the CP decomposition is written as beta_3 twice; it should be beta_1 outer beta_2 outer beta_3.
- [Table 1] The last two column headers are both labeled TVP-TVAR(3,2); the final column should read TVP-TVAR(3,3).
- [Figure 2 caption] The caption says the middle and right panels restrict display to maxima of 350 and 500 and account for 93 data sets, but the number of excluded data sets and their Monte Carlo errors are not stated; please clarify whether the excluded values are extreme outliers or truncation artifacts.
- [Table 3] The entry for TVP-TVAR(4,3) is '/', but the configuration is fitted in the selection step; please explain why no parameter count is reported, and state how the averaged counts are computed across data sets of different length.
- [Section 6.3 and Appendix D] The text refers to 'Nievell' and 'Precental gyrus'; these should be 'Neville' and 'Precentral gyrus'. Also, the threshold p*=99.9% should be motivated or cited.
- [General] No code or data availability statement is included; releasing the sampler and simulation scripts would strengthen reproducibility, which is particularly valuable given the high computational cost of the MCMC implementation.
Circularity Check
No significant circularity: DIC_c,1 is validated on external synthetic benchmarks, and the paper's self-citations are not load-bearing.
full rationale
The central methodological claim is that the conditional DIC variant DIC_c,1, combined with knee-point detection, reliably selects configuration and rank for TVP-TVAR models. This claim is established by an external Monte Carlo benchmark in Section 5: datasets are simulated from TVAR(3) and TVP-TVAR(3,j) with known rank 3, and the DIC-based selections are scored against those known true configurations and ranks. The true model is an input to the data generator, not to the DIC formula, so the reported success is an empirical finding rather than an identity or a fitted parameter renamed as a prediction. The preference for DIC_c,1 over DIC_c,2 and DIC_m is supported by Monte Carlo errors computed from 10 parallel MCMC runs and by trace plots showing that coefficient chains mix better than margin chains; the paper reproduces these phenomena in its own simulations, so the argument does not rest solely on the cited prior work. The self-citations to Luo and Griffin (2025) concern loading interpretation and the scaling indeterminacy of CP decompositions; these are contextual and are independently supported by the paper's own trace plots and simulation results, so they are not load-bearing in a circular sense. The restriction to a single time-varying loading is an acknowledged modeling assumption, stated in Section 2.2, and while it limits the interpretation of the fMRI application by making model comparison within a restricted family, that is a misspecification/robustness concern, not a circularity. No equation in the paper is used both as input and as output, and no fitted parameter is presented as an independent prediction. The score is 1 rather than 0 only because there are minor self-citations; none of them carries the central claim.
Assumptions & free parameters
free parameters (8)
- CP rank R =
R=3 in simulation truth; R=4 to 6 in fMRI selection
- Prior variance scale sigma^2 =
0.5 (simulation), 0.1 (fMRI)
- Granger effect threshold delta =
0.01
- Granger posterior threshold p* =
0.999
- Random walk innovation variance Q_j =
0.01 (simulation DGP)
- Lag order P =
3 (simulation), 4 (fMRI)
- IG hyperparameters a_k = b_k =
0.01
- Rank upper bound R* =
9 (simulation), 10 (fMRI)
assumptions (5)
- domain assumption The true coefficient process is representable as a CP decomposition with fixed rank and exactly one time-varying loading.
- standard math With known sigma^2, the loadings are identifiable up to sign switching and permutation, avoiding scaling indeterminacy.
- domain assumption The MCMC sampler (FFBS plus collapsed Gibbs steps) converges to the target posterior despite sign and permutation multimodality.
- standard math DIC computed with plug-in posterior means is a valid model selection criterion for state-space models.
- domain assumption The kneedle maximum-curvature point corresponds to the true rank when DIC under-penalizes overfitting.
Cite this review
Pith. "Pith review of Time-varying Parameter Tensor Vector Autoregression." pith.science (2026). https://pith.science/paper/I2EGT33S
@misc{pith2026250507975,
  author       = {Pith},
  title        = {Pith review of: Time-varying Parameter Tensor Vector Autoregression},
  year         = {2026},
  howpublished = {\url{https://pith.science/paper/I2EGT33S}},
  note         = {Machine review of arXiv:2505.07975}
}
read the original abstract
Time-varying parameter vector autoregression provides a flexible framework to capture structural changes within time series. However, when applied to high-dimensional data, this model encounters challenges of over-parametrization and computational burden. We address these challenges by building on recently proposed Tensor VAR models to represent the time-varying coefficient matrix as a third-order tensor with CANDECOMP/PARAFAC (CP) decomposition, yielding three model configurations where different sets of components are specified as time-varying, each offering distinct interpretations. To select the model configuration and the decomposition rank, we evaluate multiple variants of Deviance Information Criterion (DIC) corresponding to the conditional and marginal DICs. Our simulation demonstrates that a specific conditional DIC variant provides more reliable results and accurately identifies true model configurations. We improve the accuracy of rank selection by applying knee point detection to the DICs, rather than defaulting to the minimum DIC value. Upon analyzing functional magnetic resonance imaging data from story reading tasks, our selected model configurations suggest time-varying dynamics while reducing the number of parameters by over 90% relative to standard VARs. Granger causality analysis reveals directional brain connectivity patterns that align with narrative progression, with various regions functioning as signal emitters or receivers at different time points.
Figures


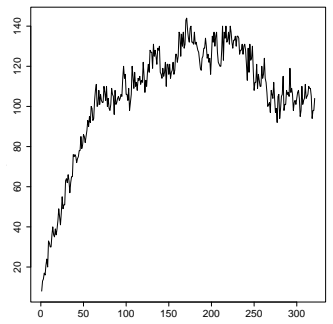
Figures from the paper (8 more)




Reference graph
Works this paper leans on
-
[1]
Ariyo, O., Lesaffre, E., Verbeke, G., and Quintero, A. (2022). Model selection for B ayesian linear mixed models with longitudinal data: sensitivity to the choice of priors. Communications in Statistics-simulation and Computation , 51(4):1591--1615
work page 2022
-
[2]
Ariyo, O., Quintero, A., Mu \ n oz, J., Verbeke, G., and Lesaffre, E. (2020). Bayesian model selection in linear mixed models for longitudinal data. Journal of Applied Statistics , 47(5):890--913
work page 2020
-
[3]
Bai, J. and Wang, P. (2015). Identification and B ayesian estimation of dynamic factor models. Journal of Business & Economic Statistics , 33(2):221--240
work page 2015
-
[4]
A., Koop, G., and Korobilis, D
Belmonte, M. A., Koop, G., and Korobilis, D. (2014). Hierarchical shrinkage in time-varying parameter models. Journal of Forecasting , 33(1):80--94
work page 2014
-
[5]
Bigler, E. D., Mortensen, S., Neeley, E. S., Ozonoff, S., Krasny, L., Johnson, M., Lu, J., Provencal, S. L., McMahon, W., and Lainhart, J. E. (2007). Superior temporal gyrus, language function, and autism. Developmental Neuropsychology , 31(2):217--238
work page 2007
-
[6]
Billio, M., Casarin, R., Iacopini, M., and Kaufmann, S. (2023). Bayesian dynamic tensor regression. Journal of Business & Economic Statistics , 41(2):429--439
work page 2023
-
[7]
Brune, B., Scherrer, W., and Bura, E. (2022). A state-space approach to time-varying reduced-rank regression. Econometric Reviews , 41(8):895--917
work page 2022
-
[8]
Carriero, A., Kapetanios, G., and Marcellino, M. (2011). Forecasting large datasets with B ayesian reduced rank multivariate models. Journal of Applied Econometrics , 26(5):735--761
work page 2011
Show all 66 references
-
[9]
Carter, C. K. and Kohn, R. (1994). On G ibbs sampling for state space models. Biometrika , 81(3):541--553
1994
-
[10]
P., and Titterington, D
Celeux, G., Forbes, F., Robert, C. P., and Titterington, D. M. (2006). Deviance information criteria for missing data models . Bayesian Analysis , 1(4):651 -- 673
2006
-
[11]
Chan, J. C. (2023). Large hybrid time-varying parameter VAR s. Journal of Business & Economic Statistics , 41(3):890--905
2023
-
[12]
Chan, J. C. and Eisenstat, E. (2018). Bayesian model comparison for time-varying parameter VAR s with stochastic volatility. Journal of Applied Econometrics , 33(4):509--532
2018
-
[13]
C., Eisenstat, E., and Strachan, R
Chan, J. C., Eisenstat, E., and Strachan, R. W. (2020). Reducing the state space dimension in a large TVP-VAR . Journal of Econometrics , 218(1):105--118
2020
-
[14]
Chan, J. C. and Grant, A. L. (2016a). Fast computation of the deviance information criterion for latent variable models. Computational Statistics & Data Analysis , 100:847--859
2016
-
[15]
Chan, J. C. and Grant, A. L. (2016b). On the observed-data deviance information criterion for volatility modeling. Journal of Financial Econometrics , 14(4):772--802
2016
-
[16]
Chan, J. C. and Qi, Y. (2024). Large B ayesian T ensor VAR s with stochastic volatility. arXiv preprint arXiv:2409.16132
2024 arXiv
-
[17]
Chen, X., Zhang, C., Chen, X., Saunier, N., and Sun, L. (2023). Discovering dynamic patterns from spatiotemporal data with time-varying low-rank autoregression. IEEE Transactions on Knowledge and Data Engineering , 36(2):504--517
2023
-
[18]
Clark, T. E. and Mertens, E. (2023). Stochastic volatility in B ayesian vector autoregressions. Oxford University Press
2023
-
[19]
and Sargent, T
Cogley, T. and Sargent, T. J. (2001). Evolving post-world war II US inflation dynamics. NBER Macroeconomics Annual , 16:331--373
2001
-
[20]
and Sargent, T
Cogley, T. and Sargent, T. J. (2005). Drifts and volatilities: monetary policies and outcomes in the post WWII US . Review of Economic dynamics , 8(2):262--302
2005
-
[21]
Cubadda, G., Grassi, S., and Guardabascio, B. (2025). The time-varying multivariate autoregressive index model. International Journal of Forecasting , 41(1):175--190
2025
-
[22]
C., and Strachan, R
Eisenstat, E., Chan, J. C., and Strachan, R. W. (2016). Stochastic model specification search for time-varying parameter VAR s. Econometric Reviews , 35(8-10):1638--1665
2016
-
[23]
Fana, J., Sitekb, K., Chandrasekaranb, B., and Sarkara, A. (2022). Bayesian tensor factorized mixed vector autoregressive models for inferring G ranger causality patterns from high-dimensional multi-subject panel neuroimaging data. arXiv preprint arXiv:2206.10757 , 3
2022 arXiv
-
[24]
M., Hauzenberger, N., Huber, F., and Pfarrhofer, M
Fischer, M. M., Hauzenberger, N., Huber, F., and Pfarrhofer, M. (2023). General B ayesian time-varying parameter vector autoregressions for modeling government bond yields. Journal of Applied Econometrics , 38(1):69--87
2023
-
[25]
Fr \"u hwirth-Schnatter, S. (1994). Data augmentation and dynamic linear models. Journal of Time Series Analysis , 15(2):183--202
1994
-
[26]
and Wagner, H
Fr \"u hwirth-Schnatter, S. and Wagner, H. (2010). Stochastic model specification search for G aussian and partial non- G aussian state space models. Journal of Econometrics , 154(1):85--100
2010
-
[27]
Gaschler-Markefski, B., Baumgart, F., Tempelmann, C., Schindler, F., Stiller, D., Heinze, H.-J., and Scheich, H. (1997). Statistical methods in functional magnetic resonance imaging with respect to nonstationary time-series: auditory cortex activity. Magnetic Resonance in Medi...
1997
-
[28]
Geraci, M. V. and Gnabo, J.-Y. (2018). Measuring interconnectedness between financial institutions with B ayesian time-varying vector autoregressions. Journal of Financial and Quantitative Analysis , 53(3):1371--1390
2018
-
[29]
Guhaniyogi, R., Qamar, S., and Dunson, D. B. (2017). Bayesian tensor regression. Journal of Machine Learning Research , 18(79):1--31
2017
-
[30]
and Spencer, D
Guhaniyogi, R. and Spencer, D. (2021). Bayesian tensor response regression with an application to brain activation studies. Bayesian Analysis , 16(4):1221--1249
2021
-
[31]
D., Aravkin, A., Rao, R., and Brunton, B
Harris, K. D., Aravkin, A., Rao, R., and Brunton, B. W. (2021). Time-varying autoregression with low-rank tensors. SIAM Journal on Applied Dynamical Systems , 20(4):2335--2358
2021
-
[32]
Havlicek, M., Jan, J., Brazdil, M., and Calhoun, V. D. (2010). Dynamic G ranger causality based on K alman filter for evaluation of functional network connectivity in f MRI data. Neuroimage , 53(1):65--77
2010
-
[33]
Huber, F., Koop, G., and Onorante, L. (2021). Inducing sparsity and shrinkage in time-varying parameter models. Journal of Business & Economic Statistics , 39(3):669--683
2021
-
[34]
Jeffreys, H. (1935). Some tests of significance, treated by the theory of probability. In Mathematical Proceedings of the Cambridge Philosophical Society , volume 31, pages 203--222. Cambridge University Press
1935
-
[35]
Kiers, H. A. (2000). Towards a standardized notation and terminology in multiway analysis. Journal of Chemometrics: A Journal of the Chemometrics Society , 14(3):105--122
2000
-
[36]
Kolda, T. G. and Bader, B. W. (2009). Tensor decompositions and applications. SIAM review , 51(3):455--500
2009
-
[37]
Korobilis, D. (2013). Assessing the transmission of monetary policy using time-varying parameter dynamic factor models. Oxford Bulletin of Economics and Statistics , 75(2):157--179
2013
-
[38]
and Zhang, X
Li, L. and Zhang, X. (2017). Parsimonious tensor response regression. Journal of the American Statistical Association , 112(519):1131--1146
2017
-
[39]
Li, X., Xu, D., Zhou, H., and Li, L. (2018). Tucker tensor regression and neuroimaging analysis. Statistics in Biosciences , 10(3):520--545
2018
-
[40]
Li, Y., Yu, J., and Zeng, T. (2020). Deviance information criterion for latent variable models and misspecified models. Journal of econometrics , 216(2):450--493
2020
-
[41]
Liakakis, G., Nickel, J., and Seitz, R. (2011). Diversity of the inferior frontal gyrus—a meta-analysis of neuroimaging studies. Behavioural Brain Research , 225(1):341--347
2011
-
[42]
Litterman, R. B. et al. (1979). Techniques of forecasting using vector autoregressions. Working Paper 115, Federal Reserve Bank of Minneapolis
1979
-
[43]
and Griffin, J
Luo, Y. and Griffin, J. E. (2025). Bayesian inference of vector autoregressions with tensor decompositions. Journal of Business & Economic Statistics , 0(0):1--29
2025
-
[44]
K., Basu, S., and Ghosh, S
Maity, A. K., Basu, S., and Ghosh, S. (2021). Bayesian criterion-based variable selection. Journal of the Royal Statistical Society Series C: Applied Statistics , 70(4):835--857
2021
-
[45]
C., Furr, D., and Rabe-Hesketh, S
Merkle, E. C., Furr, D., and Rabe-Hesketh, S. (2019). Bayesian comparison of latent variable models: Conditional versus marginal likelihoods. Psychometrika , 84(3):802--829
2019
-
[46]
Millar, R. B. (2009). Comparison of hierarchical B ayesian models for overdispersed count data using DIC and B ayes' factors. Biometrics , 65(3):962--969
2009
-
[47]
Mitchell, T. J. and Beauchamp, J. J. (1988). Bayesian variable selection in linear regression. Journal of the American Statistical Association , 83(404):1023--1032
1988
-
[48]
Nakajima, J. (2011). Time-Varying Parameter VAR Model with Stochastic Volatility: An Overview of Methodology and Empirical Applications . IMES Discussion Paper Series 11-E-09, Institute for Monetary and Economic Studies, Bank of Japan
2011
-
[49]
Primiceri, G. E. (2005). Time varying structural vector autoregressions and monetary policy. The Review of Economic Studies , 72(3):821--852
2005
-
[50]
Pr \"u ser, J. (2021). The horseshoe prior for time-varying parameter VAR s and monetary policy. Journal of Economic Dynamics and Control , 129:104188
2021
-
[51]
Reinsel, G. (1983). Some results on multivariate autoregressive index models. Biometrika , 70(1):145--156
1983
-
[52]
Robert, C. P. (2014). On the J effreys- L indley paradox. Philosophy of Science , 81(2):216--232
2014
-
[53]
Rowling, J. (2012). Harry Potter and the Sorcerer's Stone . Pottermore Limited
2012
-
[54]
kneedle
Satopaa, V., Albrecht, J., Irwin, D., and Raghavan, B. (2011). Finding a" kneedle" in a haystack: Detecting knee points in system behavior. In 2011 31st International Conference on Distributed Computing Systems Workshops , pages 166--171. IEEE
2011
-
[55]
Schwarz, G. (1978). Estimating the dimension of a model. The annals of statistics , pages 461--464
1978
-
[56]
Seghier, M. L. (2013). The angular gyrus: multiple functions and multiple subdivisions. The Neuroscientist , 19(1):43--61
2013
-
[57]
K., Barrett, A
Seth, A. K., Barrett, A. B., and Barnett, L. (2015). Granger causality analysis in neuroscience and neuroimaging. Journal of Neuroscience , 35(8):3293--3297
2015
-
[58]
Spencer, D., Guhaniyogi, R., and Prado, R. (2022). Parsimonious B ayesian sparse tensor regression using the T ucker decomposition. arXiv preprint arXiv:2203.04733
2022 arXiv
-
[59]
J., Best, N
Spiegelhalter, D. J., Best, N. G., Carlin, B. P., and Van Der Linde, A. (2002). Bayesian measures of model complexity and fit. Journal of the Royal Statistical Society: Series B (Statistical Methodology) , 64(4):583--639
2002
-
[60]
Wang, D., Zheng, Y., Lian, H., and Li, G. (2022). High-dimensional vector autoregressive time series modeling via tensor decomposition. Journal of the American Statistical Association , 117(539):1338--1356
2022
-
[61]
Wehbe, L., Murphy, B., Talukdar, P., Fyshe, A., Ramdas, A., and Mitchell, T. (2014). Simultaneously uncovering the patterns of brain regions involved in different story reading subprocesses. PloS one , 9(11):e112575
2014
-
[62]
Weiner, K. S. and Zilles, K. (2016). The anatomical and functional specialization of the fusiform gyrus. Neuropsychologia , 83:48--62
2016
-
[63]
and Cribben, I
Xiong, X. and Cribben, I. (2023). Beyond linear dynamic functional connectivity: a vine copula change point model. Journal of Computational and Graphical Statistics , 32(3):853--872
2023
-
[64]
Zhang, W., Cribben, I., and Guindani, M. (2021). Bayesian time-varying tensor vector autoregressive models for dynamic effective connectivity. arXiv preprint arXiv:2106.14083
2021 arXiv
-
[65]
Zhao, Q., Hautamaki, V., and Fr \"a nti, P. (2008). Knee point detection in BIC for detecting the number of clusters. In International Conference on Advanced Concepts for Intelligent Vision Systems , pages 664--673. Springer
2008
-
[66]
Zhou, H., Li, L., and Zhu, H. (2013). Tensor regression with applications in neuroimaging data analysis. Journal of the American Statistical Association , 108(502):540--552
2013
Reviewed August 15, 2026 · model on record in the stance chip above.
Discussion (0). Continue with ORCID to comment.