REVIEW 4 major objections 6 minor 3 cited by
On the nature of buckling instability in galactic bars
T0 review · 4 major / 6 minor · reviewed 2026-08-10 · deepseek-v4-flash
Pith's one-line read This paper argues that the buckling instability of galactic bars is not a fire-hose effect but a two-stage vertical resonance: a bar-locked distortion grows at the 2:1 resonance, then winds up as a bending wave into a boxy/peanut bulge.
desk verdict Lokas offers a plausible, clearly written two-phase mechanism for bar buckling, but the decisive resonance crossing is inferred rather than measured, and the fire-hose exclusion is asserted rather than tested. read the letter →
The pith
A machine-rendered reading of the paper's core claim, the machinery that carries it, and where it could break.
The reading
What carries the argument
The argument is carried by the driven harmonic oscillator equation $\ddot{z} + \omega^2 z = F_0(1-e^{-\alpha t})\cos(\omega_f t)$ for vertical stellar motion, combined with the resonance condition $f'_z = 2f_x$ and the post-buckling frequency relation $f'_z = (4/3)(f'_x + f_p)$. The bending-wave pattern speed $\omega_p = f_x + f_p - f'_z/2$ is the quantity that stays equal to the bar pattern speed during growth and then decreases with radius after buckling, and Lissajous curves of the form $(x,y,z) = [a\cos\phi, b\sin\phi, c\cos(m\phi+\phi_0)]$ turn banana orbits ($m=2$) into pretzel orbits ($m = 2 - 1/n$).
What would settle it
Track instantaneous orbital frequencies continuously through a buckling event in a similar N-body simulation (for example, with short-time Fourier transforms or wavelet analysis at roughly 0.05 Gyr cadence). If $f_x$ changes appreciably before orbits cross $f_z = 2f_x$, or if the vertical distortion fails to grow when stars are at the resonance, the resonance-driven two-phase scenario is falsified. Conversely, the fire-hose alternative is falsified if buckling occurs when the vertical-to-horizontal velocity dispersion ratio is well above 0.3.
Extended reading notes
Core claim
The paper's central claim is that buckling is triggered by the vertical resonance $f_z = 2f_x$ of bar-supporting orbits, not by the low ratio of vertical to horizontal velocity dispersion invoked by the fire-hose hypothesis. The event separates into a growth phase, in which a driven harmonic oscillator describes how the distortion lowers vertical frequencies while horizontal frequencies stay put, and a winding phase, in which increased horizontal frequencies raise the distortion's pattern speed to $\Omega'/3$, producing a bending wave that turns banana orbits into pretzel orbits. The post-buckling state is characterized by the tight relation $f'_z = (4/3)(f'_x + f_p)$, equivalently $3\nu' = 4\Omega'$, which the paper shows also holds in other published simulations once the bar pattern speed is included.
Load-bearing premise
The entire two-phase split rests on the assumption that during the growth phase the horizontal oscillation frequency of each bar star stayed unchanged while its vertical frequency fell toward the 2:1 resonance, even though that crossing was never directly measured in the simulation—the 'during buckling' histogram actually pairs frequencies taken before and after the event.
Editorial extensions
If this is right
- Buckling can be predicted and timed from the evolution of orbital frequencies rather than from the vertical-to-horizontal velocity dispersion ratio.
- During the growth phase the vertical distortion is stationary in the bar's co-rotating frame, and after buckling its pattern speed decreases with radius and equals $\Omega'/3$.
- The winding of the bending wave converts banana orbits into pretzel orbits with vertical-to-horizontal frequency ratios $f'_z/f'_x = 3/2, 5/3, 7/4, 9/5$, in that order.
- At radii where $f'_x = 2 f_p$ the banana orbits and the distortion survive, so buckling quietly continues in the outer bar.
- In bars with a massive bulge the vertical resonance still appears but the second phase is suppressed, so buckling remains a milder, resonance-only event.
Reading between the lines
- The claimed phase split is never directly observed: the simulation excludes $t=4.2$ to $4.8$ Gyr from spectral analysis, so a continuous frequency track through the resonance would either confirm or refute the assumption that $f_x$ stays fixed while $f_z$ falls.
- If the resonance-driven feedback loop is generic, any seed vertical asymmetry in a bar should be able to trigger buckling, which could be tested by artificially perturbing a stable bar in controlled simulations.
- The post-buckling relation $3\nu' = 4\Omega'$ might serve as an observational diagnostic to identify post-buckling bars from stellar kinematics if the pattern speed and circular frequency can be measured independently.
- The two-phase timescale predicts that the duration of the growth phase should depend on the force growth parameter $\alpha$, so bars with different mass distributions should show systematically different buckling durations.
Editorial analysis
A structured set of objections, weighed in public.
Referee Report
Summary. This paper uses a collisionless N-body simulation of an isolated Milky Way-like galaxy (introduced in Łokas 2019) to argue that bar buckling is a two-phase phenomenon. In the first phase, a small vertical distortion is amplified by the 2:1 vertical resonance of bar-supporting orbits; the author models this as a driven harmonic oscillator with a growing force, in which the vertical frequency f_z decreases while the horizontal frequency f_x stays roughly constant. In the second phase, the distortion becomes a kinematic bending wave whose pattern speed is no longer the bar pattern speed but approximately one third of the local circular frequency; the wave winds up, increases f_x, and turns banana orbits into pretzel-like orbits, producing the boxy/peanut shape and weakening the bar. The paper concludes that buckling is triggered by the vertical resonance and is not related to the fire-hose instability.
Significance. The proposed two-phase mechanism is attractive and connects several recent results (Li et al. 2023; McClure et al. 2025; Zozulia et al. 2024). The paper has genuine strengths: it analyzes orbits in the live, evolving bar rather than in a frozen potential; it states clear limitations (the intermediate spectral interval is not measured, and the green histogram in Fig. 2 is a composite); and it derives a quantitative post-buckling frequency relation, Eq. (1), that appears in other simulations. If the resonance-crossing premise could be directly measured, this would be an important contribution to the buckling debate. In its present form, however, the central empirical evidence is indirect, and the strongest claim—that fire-hose instability is excluded—is not backed by a quantitative test.
major comments (4)
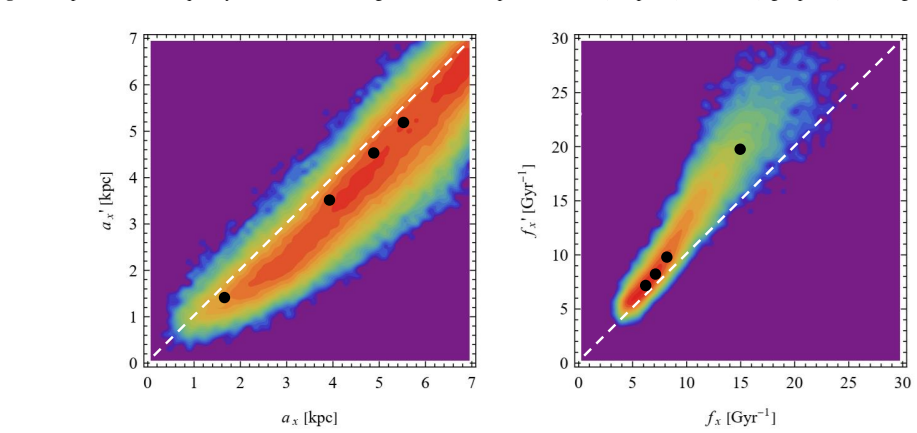
- [Section 2, Figs. 1 and 2] The load-bearing premise of the two-phase split is that during the growth phase only f_z changes while f_x remains approximately constant. This is not measured: Section 2 explicitly excludes t = 4.2–4.8 Gyr from spectral analysis because 'the orbits vary strongly, and the spectral analysis of stellar orbits is not reliable', and the green histogram in Fig. 2 is admitted to be a combination of pre-buckling f_x and post-buckling f'_z. The middle panel of Fig. 1 (f'_z vs f_x) is therefore compatible with, but does not prove, the claim that f_x is constant up to the resonance; it would also result if both frequencies evolved during the growth phase and the post-buckling f'_z happened to end up near twice the pre-buckling f_x. The author should either measure the frequencies during the growth phase with a method that does not require long spectral windows (e.g., instantaneous frequencies as in Li et al. 2023), or explicitly label the constancy of f_x as an assumption and test the sensitivity of the phase split to simultaneous changes in f_x.
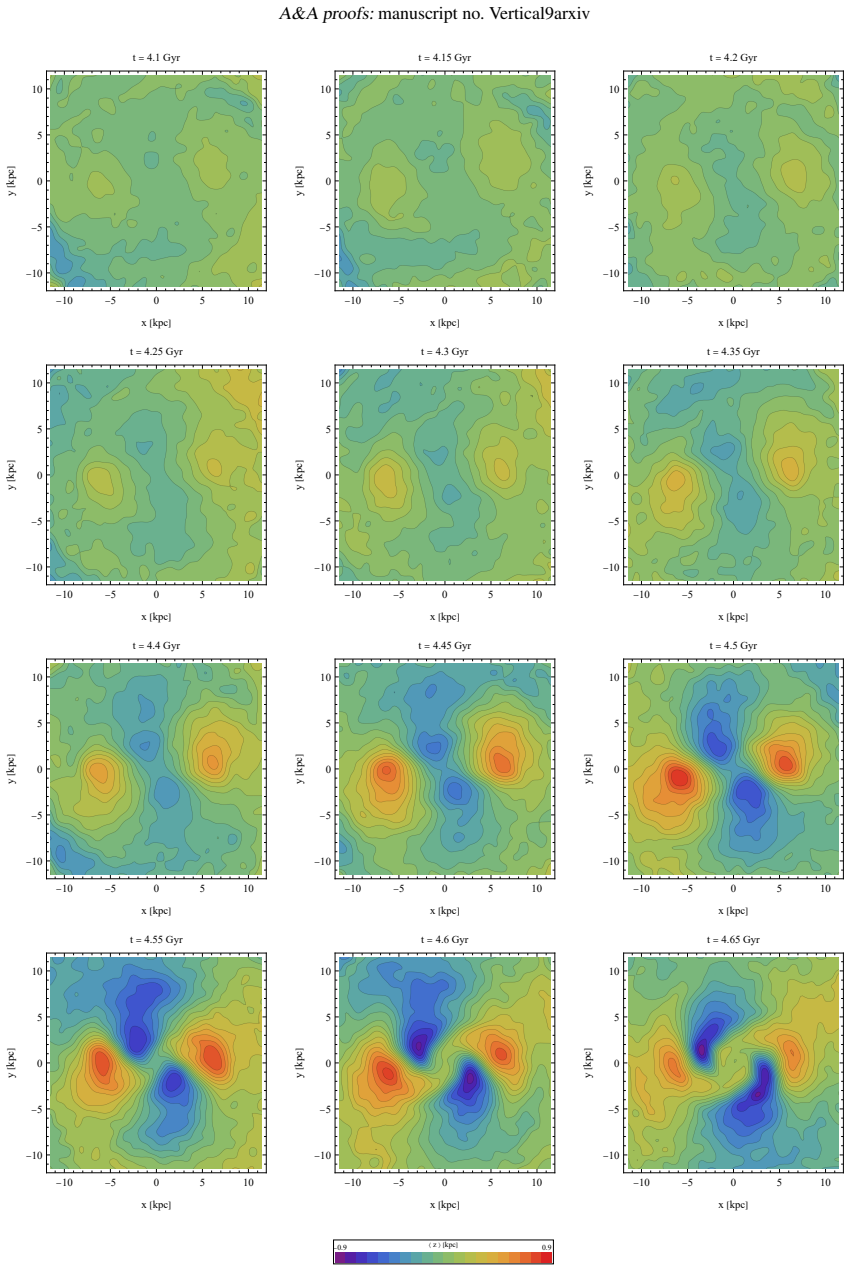
- [Section 4, Eq. (1) and Fig. 7] The right panel of Fig. 7 is not an independent check of the pattern-speed claim. Equation (1), f'_z = (4/3)(f'_x + f_p), is fitted to the post-buckling data used in the same figure, and the equality f'_x + f_p − f'_z/2 = (f'_x + f_p)/3 is exactly the rearrangement of Eq. (1) that the paper states. Consequently the agreement between the middle and right panels is guaranteed by construction up to the scatter of the fit. To support the claim that the pattern speed of the distortion becomes one third of the circular frequency, the author should measure the winding rate of the distortion pattern directly from the maps in Figs. 3 and A.1 as a function of radius and time, and compare that measured pattern speed with (f'_x+f_p)/3.
- [Section 6] The concluding sentence that buckling is 'not related to the fire-hose instability' goes beyond what is shown. The paper presents no measurement of the vertical-to-horizontal velocity dispersion ratio in the bar, no comparison with the Toomre/Merritt–Sellwood criterion, and no growth-rate test against an anisotropic-dispersion-driven instability. A successful resonance scenario is consistent with the simulation, but it does not by itself exclude a fire-hose contribution. I recommend either adding a direct diagnostic (e.g., σ_z/σ_R before and during the growth phase, or a comparison of the growth rate with the dispersion-based stability threshold) or softening the claim to state that the resonance mechanism provides a complete description of the event in this simulation.
- [Section 5, Table 1 and Fig. 12] The pretzel-orbit transformation is not directly observed in the simulation; Fig. 12 is constructed from Lissajous curves with m = 2 − 1/n, where n is derived from the assumed relation Eq. (3) and the already-questioned Eq. (1). Table 1 selects f'_x values and then reconstructs the other frequencies from these same relations. While this is a useful illustration, the paper should either show actual simulated orbital tracks before and after buckling (as is possible with the 'in vivo' orbit sample) or clearly present Fig. 12 as an illustrative model that remains to be checked against the simulation.
minor comments (6)
- [Abstract and Section 6] The abstract says the results 'strongly suggest' the mechanism, while Section 6 says the work 'demonstrates' it; the wording should be aligned with the actual evidence presented.
- [Section 3, Eq. (2)] Equation (2) is dimensionally ambiguous: ω is defined as f_z/f_x (a dimensionless ratio), but the equation mixes ω and ω_f with time derivatives; please specify the units of time and how the normalization to the horizontal frequency is applied.
- [Section 2] The statement that Eq. (1) is also obeyed by the results of Sellwood & Gerhard (2020), Li et al. (2023), and McClure et al. (2025) would benefit from a quantitative example or a panel reproducing the relation; 'one can easily demonstrate' is not enough for the reader to check.
- [Fig. 7 caption] The caption could state explicitly that the right panel is a restatement of Eq. (1), not an independent measurement.
- [Section 4] The sentence about Li et al. (2023) ('traces Ω (black curve) so that approximately Ω−ν_z/2 = Ω/3') is confusing; the notation and the comparison should be clarified.
- [Data availability] No data for the fits shown in Figs. 1 and 7 are provided; releasing the frequency-amplitude tables or the fitted relation with uncertainties would aid reproducibility.
Circularity Check
The post-buckling 'one-third circular frequency' pattern speed is the fitted Eq. (1) rewritten; the right panel of Fig. 7 is therefore not an independent check.
-
fitted input called prediction
[Section 4 (paragraph after Fig. 7; Eq. (1) introduced in Section 2)]
"Interestingly, this combination of frequencies turns out to behave almost exactly the same way as ( f′x + fp)/3 (or Ω′/3 in the standard notation), which is shown in the right panel of Fig. 7. ... The equality between these two expressions, f′x + fp− f′z/2 = ( f′x + fp)/3, immediately leads to Equation (1) after rearrangement of the terms."
Equation (1) was introduced as an empirical fit to the same post-buckling frequencies: f′z = (4/3)(f′x + fp), with fp identified as the bar pattern speed (Section 2). The Section 4 equality is algebraically equivalent to Eq. (1): f′x + fp − f′z/2 = (f′x + fp)/3 iff f′z = (4/3)(f′x + fp). Thus the 'pattern speed after buckling equals one third of the circular frequency' and the right panel of Fig. 7 are not independent predictions; they are the fitted relation expressed in another form. Describing the equality as 'immediately leading to Equation (1)' reverses the logical order and makes the derived pattern speed forced by the fit by construction.
full rationale
The most defensible circularity is the reuse of Eq. (1). It is fit to post-buckling frequency data, and Section 4 then presents an algebraically identical relation as a new finding that 'leads to' Eq. (1); accordingly the claimed post-buckling bending-wave pattern speed of Ω′/3 is not independently inferred but is a restatement of the fit. The resonance-crossing evidence is weaker than claimed for a different, non-circular reason: Section 2 explicitly excludes t = 4.2–4.8 Gyr from spectral analysis because 'the orbits vary strongly', and the green histogram in Fig. 2 is acknowledged to be a combination of pre-buckling fx and post-buckling f′z. This weakens the two-phase decomposition but is not itself a circular step because the composite ratio is not forced to peak at 2 by an equation; it is a mixed measurement. I do not score the extensive citation of L19 as circularity: the fundamental frequency relation is also presented in this paper's Fig. 1, and the simulation is an external dynamical experiment, so the self-citation is evidentiary rather than a uniqueness theorem. The pretzel-orbit sequence (Section 5) is largely a Lissajous parametrization chosen to match the measured f′z/f′x ratios; it is descriptive rather than a derivation, but it does not add a second independent circular prediction. Overall, one load-bearing quantity (post-buckling pattern speed) is forced by the fitted relation, amounting to partial circularity; the central resonance/fire-hose distinction retains independent content from the shift of the frequency distribution and from external simulations (Li et al. 2023; McClure et al. 2025).
Assumptions & free parameters
free parameters (5)
- slope 4/3 in Eq. (1) =
1.333
- fp (bar pattern speed) =
2.5 Gyr^-1
- F0 (force amplitude) =
10
- alpha (force growth rate) =
0.1
- psi parameterization =
psi = (fx - 2fp)/(2fx)
assumptions (5)
- domain assumption Horizontal frequencies fx are constant during the first phase of buckling.
- domain assumption The vertical resonance condition f'_z = 2 fx holds during buckling for most bar-supporting orbits.
- ad hoc to paper A small vertical distortion can be treated as a growing harmonic driving force with frequency 2 fx.
- domain assumption The vertical distortion has m=2 and evolves as a kinematic bending wave with pattern speed Omega - nu/2.
- domain assumption The x1-type orbits remain elliptical in the horizontal plane during buckling.
Cite this review
Pith. "Pith review of On the nature of buckling instability in galactic bars." pith.science (2026). https://pith.science/paper/I2QRU3JY
@misc{pith2026250112308,
  author       = {Pith},
  title        = {Pith review of: On the nature of buckling instability in galactic bars},
  year         = {2026},
  howpublished = {\url{https://pith.science/paper/I2QRU3JY}},
  note         = {Machine review of arXiv:2501.12308}
}
read the original abstract
Many strong simulated galactic bars experience buckling instability, which manifests itself as a vertical distortion out of the disk plane, and later dissipates. Using a simulation of an isolated Milky Way-like galaxy, I demonstrate that the phenomenon can be divided into two distinct phases. In the first one, the distortion grows and its pattern speed remains equal to the pattern speed of the bar, so that the distortion remains stationary in the reference frame of the bar. The growth can be described with the mechanism of a driven harmonic oscillator with time-dependent force, which decreases the vertical frequencies of the stars. At the end of this phase, most bar-supporting orbits have banana-like shapes with a resonant vertical-to-horizontal frequency ratio close to two. The increase of amplitudes of vertical oscillations leads to the decrease of the amplitudes of horizontal oscillations and the shrinking of the bar. The mass redistribution causes the harmonic oscillators to respond adiabatically and increase the horizontal frequencies. In the following second phase of buckling, the pattern speed of the distortion increases - reaching one third of the circular frequency - but it decreases with radius. The distortion propagates as a kinematic bending wave and winds up, leaving behind a pronounced boxy/peanut shape. The increased horizontal frequencies cause the weakening of the bar and the transformation of banana-like orbits into pretzel-like ones, except in the outer part of the bar, where the banana-like orbits and the distortion survive. The results strongly suggest that the buckling of galactic bars is not related to the fire-hose instability, but it can be fully explained by the mechanism of vertical resonance creating the distortion that later winds up.
Figures


Figures from the paper (8 more)



Forward citations
Cited by 3 Pith papers
-
GalPort: Investigation of the bar in action-angle space
GalPort computes multi-timescale action-angle variables and orbital classifications for evolving barred galaxy simulations, with specialised bar phase-space analysis tools.
-
Secular Attrition of Classical Bulges by Stellar Bars
Stellar bars can convert up to 50% of a classical bulge's stars into bar-supporting disk-like orbits, potentially explaining the scarcity of classical bulges.
-
Phase-space distortion as a key to unraveling galactic bar buckling
During bar buckling, a distorted resonant phase space with only one stable point channels flat orbits into banana-shaped librating or heated orbits, producing vertical asymmetry.
Reference graph
Works this paper leans on
-
[1]
R., Gough-Kelly, S., Debattista, V
Anderson, S. R., Gough-Kelly, S., Debattista, V . P., et al. 2024, MNRAS, 527, 2919
work page 2024
-
[2]
2003, MNRAS, 341, 1179
Athanassoula, E. 2003, MNRAS, 341, 1179
2003
-
[3]
2005, MNRAS, 358, 1477
Athanassoula, E. 2005, MNRAS, 358, 1477
2005
-
[4]
Athanassoula, E., Machado, R. E. G., & Rodionov, S. A. 2013, MNRAS, 429, 1949
2013
-
[5]
Berentzen, I., Shlosman, I., Martinez-Valpuesta, I., & Heller, C. H. 2007, ApJ, 666, 189
2007
- [6]
-
[7]
2008, Galactic Dynamics, 2nd edn
Binney, J., & Tremaine, S. 2008, Galactic Dynamics, 2nd edn. (Princeton Univ
work page 2008
-
[8]
Ciambur, B. C., Graham, A. W., & Bland-Hawthorn, J. 2017, MNRAS, 471, 3988
work page 2017
Show all 34 references
-
[9]
2020, MNRAS, 492, 2241
Collier, A. 2020, MNRAS, 492, 2241
2020
-
[10]
Combes, F., & Sanders, R. H. 1981, A&A, 96, 164
1981
-
[11]
1990, A&A, 233, 82
Combes, F., Debbasch, F., Friedli, D., & Pfenniger, D. 1990, A&A, 233, 82
1990
-
[12]
1980, A&A, 92, 33
Contopoulos, G., & Papayannopoulos, T. 1980, A&A, 92, 33
1980
-
[13]
P., Mayer, L., Carollo, C
Debattista, V . P., Mayer, L., Carollo, C. M., et al. 2006, ApJ, 645, 209
2006
-
[14]
Erwin, P., & Debattista, V . P. 2017, MNRAS, 468, 2058
2017
-
[15]
1990, Bulges of galaxies, in ESO Conference and Workshop Proceedings, ed
Friedli, D., & Pfenniger, D. 1990, Bulges of galaxies, in ESO Conference and Workshop Proceedings, ed. B. J. Jarvis, & D. M. Terndrup (ESO, Garching), 35, 265
1990
-
[16]
1990, A&A, 230, 37
Gerin, M., Combes, F., & Athanassoula, E. 1990, A&A, 230, 37
1990
-
[17]
Kataria, S. K. 2024, MNRAS, 534, 3565
2024
-
[18]
P., & Lintott, C
Kruk, S., Erwin, P., Debattista, V . P., & Lintott, C. 2019, MNRAS, 490, 4721
2019
-
[19]
2023, MNRAS, 520, 1243 Łokas, E
Li, X., Shlosman, I., Pfenniger, D., & Heller, C. 2023, MNRAS, 520, 1243 Łokas, E. L. 2018, ApJ, 857, 6 Łokas, E. L. 2019, A&A, 629, A52 (L19) Łokas, E. L. 2020, A&A, 634, A122 Łokas, E. L., Athanassoula, E., Debattista, V . P., et al. 2014, MNRAS, 445, 1339 Łokas, E. L., Ebro...
2023
-
[20]
2006, ApJ, 637, 214
Martinez-Valpuesta, I., Shlosman, I., & Heller, C. 2006, ApJ, 637, 214
2006
-
[21]
L., Beane, A., D’Onghia, E., Filion, C
McClure, R. L., Beane, A., D’Onghia, E., Filion, C. & Daniel, K. J. 2025, MN- RAS, 537, 1475
2025
-
[22]
Merritt, D., & Sellwood, J. A. 1994, ApJ, 425, 551
1994
-
[23]
F., Frenk, C
Navarro, J. F., Frenk, C. S., & White, S. D. M. 1997, ApJ, 490, 493
1997
-
[24]
1996, ApJ, 469, 605
Noguchi, M. 1996, ApJ, 469, 605
1996
-
[25]
P., & Peebles, P
Ostriker, J. P., & Peebles, P. J. E. 1973, ApJ, 186, 467
1973
-
[26]
Peschken, N., & Łokas, E. L. 2019, MNRAS, 483, 2721
2019
-
[27]
1991, A&A, 252, 75
Pfenniger, D., & Friedli, D. 1991, A&A, 252, 75
1991
-
[28]
2015, MNRAS, 450, L66
Portail, M., Wegg, C., & Gerhard, O. 2015, MNRAS, 450, L66
2015
-
[29]
A., James, R
Raha, N., Sellwood, J. A., James, R. A., & Kahn, F. D. 1991, Nat, 352, 411
1991
-
[30]
A., & Gerhard, O
Sellwood, J. A., & Gerhard, O. 2020, MNRAS, 495, 3175
2020
-
[31]
A., & Athanassoula, E
Skokos, Ch., Patsis, P. A., & Athanassoula, E. 2002, MNRAS, 333, 847 Toomre A. 1966, in Geophys. Fluid Dyn., No. 66-46, 111
2002
-
[32]
2010, ApJ, 719, 1470
Villa-Vargas, J., Shlosman, I., & Heller, C. 2010, ApJ, 719, 1470
2010
-
[33]
L., Arendt, R
Weiland, J. L., Arendt, R. G., Berriman, G. B., et al. 1994, ApJ, 425, L81
1994
-
[34]
D., Smirnov, A
Zozulia, V . D., Smirnov, A. A., Sotnikova, N. Ya., & Marchuk, A. A. 2024, A&A, 692, A145 Article number, page 11 A&A proofs: manuscript no. Vertical9arxiv Appendix A: Later evolution of the distortion pattern This appendix presents the continuation of Fig. 3 and shows the evo...
2024
Reviewed August 10, 2026 · model on record in the stance chip above.
Discussion (0). Continue with ORCID to comment.