A nanoscale magnetic spectrum analyzer based on qubit dressed states
Pith reviewed 2026-06-28 04:07 UTC · model grok-4.3
The pith
A microwave dressing field applied to an NV qubit during dynamical decoupling mixes arbitrary-frequency magnetic signals into the protocol's detection band.
A machine-rendered reading of the paper's core claim, the machinery that carries it, and where it could break.
Core claim
The dressed states of the NV qubit, produced by the microwave dressing field, act as an internal frequency mixer that translates magnetic signals at arbitrary frequencies into the narrow detection window of a dynamical decoupling sequence, thereby enabling broadband nanoscale magnetometry of both coherent and noisy spin dynamics in a YIG thin film.
What carries the argument
The microwave dressing field applied concurrently with dynamical decoupling, which creates dressed qubit states that perform the frequency mixing and amplification of the target signal.
If this is right
- Spin-wave spectra in thin magnetic films become accessible to NV sensors over frequency ranges previously outside the dynamical-decoupling band.
- Both coherent precession and stochastic fluctuations can be recorded with the same sequence.
- The approach is stated to generalize directly to other qubit platforms used for nanoscale sensing.
Where Pith is reading between the lines
- The same dressing technique could be combined with other control sequences to extend bandwidth in molecular or defect spectroscopy.
- If the mixing remains linear, the method supplies a route to calibrated spectral density measurements without separate calibration of each frequency bin.
Load-bearing premise
The dressing field can be applied without adding decoherence, crosstalk, or calibration errors large enough to hide the mixed target signals.
What would settle it
A measurement in which the observed signal frequencies do not shift linearly with the dressing-field frequency or in which the effective detection bandwidth fails to expand as predicted by the dressed-state model.
Figures


read the original abstract
Magnetic field fluctuations on nanometer length scales manifest in a diverse range of phenomena -- electron and spin dynamics in materials and devices, quantum many-body systems, and molecular chemistry. Measuring these phenomena requires sensors with a challenging combination of broad spectral bandwidth, high sensitivity, and nanoscale spatial resolution. Nitrogen-vacancy (NV) centers, atom-like quantum sensors in diamond, possess the requisite sensitivity and nanoscale sensing volume, but are typically limited in bandwidth by the practical speed of the applied quantum control sequence. Here, we overcome this limitation by exposing the NV qubit to a microwave dressing field during a dynamical decoupling sequence, which both amplifies and frequency-mixes target signals at arbitrary frequencies into the detection band of the dynamical decoupling protocol. We demonstrate this approach by using NV centers to detect both coherent and noisy nanoscale spin wave dynamics in a magnetic yttrium-iron-garnet (YIG) thin film over a broad frequency range. Our technique generalizes to other qubit platforms, providing a versatile framework for nanoscale spectroscopy across diverse physical and chemical systems.
Editorial analysis
A structured set of objections, weighed in public.
Referee Report
Summary. The manuscript describes a technique for extending the bandwidth of NV-center quantum sensors by applying a microwave dressing field concurrently with a dynamical decoupling sequence. This dresses the qubit states to both amplify and frequency-mix target magnetic signals at arbitrary frequencies into the DD detection window, enabling detection of coherent and noisy nanoscale spin-wave dynamics in a YIG thin film across a broad frequency range. The approach is presented as generalizable to other qubit platforms.
Significance. If the central mechanism is experimentally validated with quantitative controls, the work would provide a practical route to broadband nanoscale magnetic spectroscopy, addressing a key limitation of dynamical decoupling protocols while preserving the spatial resolution of NV centers. The dressed-state mixing concept builds on established quantum-control ideas and could find use in diverse condensed-matter and chemical systems.
major comments (2)
- [Abstract / Results] The central claim that the dressing field 'both amplifies and frequency-mixes' arbitrary-frequency signals rests on the untested premise that the field introduces neither significant decoherence nor crosstalk into the detection band; no control data (e.g., T2 measurements with/without the dressing field, or spectra showing absence of spurious peaks) are referenced to substantiate this.
- [Demonstration section] The demonstration on YIG spin waves is described qualitatively but supplies no error bars, signal-to-noise ratios, or direct quantitative comparison against conventional DD sequences at the same frequencies, leaving the claimed performance gain unsubstantiated.
minor comments (1)
- [Theory] Notation for the dressed-state frequencies and the mixing condition should be defined explicitly with an equation early in the text rather than left implicit.
Simulated Author's Rebuttal
We thank the referee for the constructive comments and positive overall assessment of our work. We address each major comment below and will revise the manuscript to incorporate the requested controls and quantitative analysis.
read point-by-point responses
-
Referee: [Abstract / Results] The central claim that the dressing field 'both amplifies and frequency-mixes' arbitrary-frequency signals rests on the untested premise that the field introduces neither significant decoherence nor crosstalk into the detection band; no control data (e.g., T2 measurements with/without the dressing field, or spectra showing absence of spurious peaks) are referenced to substantiate this.
Authors: We agree that dedicated control data would strengthen the central claim. Although the original manuscript and supplementary information contain supporting measurements of the dressed-state dynamics, we will add explicit T2 measurements comparing coherence times with and without the dressing field, along with spectra confirming the absence of spurious peaks or crosstalk within the detection band. These controls will be included in the revised manuscript and supplementary information. revision: yes
-
Referee: [Demonstration section] The demonstration on YIG spin waves is described qualitatively but supplies no error bars, signal-to-noise ratios, or direct quantitative comparison against conventional DD sequences at the same frequencies, leaving the claimed performance gain unsubstantiated.
Authors: We acknowledge that the demonstration would benefit from more quantitative presentation. In the revised manuscript we will add error bars to the relevant data, report signal-to-noise ratios for the detected spin-wave signals, and include a direct side-by-side comparison of signal strength and sensitivity obtained with the dressed-state protocol versus conventional dynamical decoupling at matched frequencies. This will better substantiate the performance improvement. revision: yes
Circularity Check
No circularity detected; derivation self-contained
full rationale
The provided abstract and description contain no equations, fitted parameters, or self-citations that reduce any claimed prediction or result to its inputs by construction. The technique is presented as an experimental application of standard dynamical decoupling with an added dressing field to achieve frequency mixing, without any self-definitional loops, renamed empirical patterns, or load-bearing uniqueness theorems from prior author work. The central demonstration of detecting YIG spin-wave dynamics rests on physical implementation rather than tautological redefinition of inputs. This matches the most common honest finding of a self-contained paper.
Axiom & Free-Parameter Ledger
Reference graph
Works this paper leans on
-
[1]
R. Xue, N. Maksimovic, P. E. Dolgirev, L.-Q. Xia, A. M¨ uller, R. Kitagawa, F. Machado, D. R. Klein, D. MacNeill, K. Watanabe, T. Taniguchi, P. Jarillo- Herrero, M. D. Lukin, E. Demler, and A. Yacoby, Magnon hydrodynamics in an atomically-thin ferro- magnet (2025), arXiv:2403.01057 [cond-mat]
arXiv 2025
-
[2]
X. Xiao, M. O. Takahashi, P. Stevenson, S. Fuji- moto, and A. Bansil, Signatures of Non-Abelian Ki- taev quantum spin liquids in noise magnetormetry (2025), arXiv:2501.19165 [cond-mat]
arXiv 2025
-
[3]
P. A. Lee and S. Morampudi, Proposal to detect emergent gauge field and its Meissner effect in spin liquids using NV centers, Physical Review B107, 195102 (2023)
2023
-
[4]
J. B. Curtis, N. Maksimovic, N. R. Poniatowski, A. Yacoby, B. Halperin, P. Narang, and E. Dem- ler, Probing the Berezinskii-Kosterlitz-Thouless vor- tex unbinding transition in two-dimensional super- conductors using local noise magnetometry, Physi- cal Review B110, 144518 (2024), arXiv:2404.06147 [cond-mat]
arXiv 2024
-
[5]
Z. Liu, R. Gong, J. Kim, O. K. Diessel, Q. Xu, Z. Rehfuss, X. Du, G. He, A. Singh, Y. S. Eo, E. A. Henriksen, G. D. Gu, N. Y. Yao, F. Machado, S. Ran, S. Chatterjee, and C. Zu, Quantum noise spectroscopy of superconducting dynamics in thin film Bi$ 2$Sr$ 2$CaCu$ 2$O$ {8+}$(2025), arXiv:2502.04439 [cond-mat]
arXiv 2025
-
[6]
B. I. Halperin and P. C. Hohenberg, Hydrodynamic Theory of Spin Waves, Physical Review188, 898 (1969)
1969
-
[7]
Aslam, H
N. Aslam, H. Zhou, E. K. Urbach, M. J. Turner, R. L. Walsworth, M. D. Lukin, and H. Park, Quan- tum sensors for biomedical applications, Nature Re- views Physics5, 157 (2023)
2023
-
[8]
D. R. Glenn, D. B. Bucher, J. Lee, M. D. Lukin, H. Park, and R. L. Walsworth, High-resolution mag- netic resonance spectroscopy using a solid-state spin sensor, Nature555, 351 (2018)
2018
-
[9]
Bar-Gill, L
N. Bar-Gill, L. Pham, C. Belthangady, D. Le Sage, P. Cappellaro, J. Maze, M. Lukin, A. Yacoby, and R. Walsworth, Suppression of spin-bath dynamics for improved coherence of multi-spin-qubit systems, Nature Communications3, 858 (2012)
2012
-
[10]
Hauke, M
P. Hauke, M. Heyl, L. Tagliacozzo, and P. Zoller, Measuring multipartite entanglement through dy- namic susceptibilities, Nature Physics12, 778 (2016)
2016
-
[11]
J. F. Barry, J. M. Schloss, E. Bauch, M. J. Turner, C. A. Hart, L. M. Pham, and R. L. Walsworth, Sen- sitivity optimization for NV-diamond magnetome- try, Reviews of Modern Physics92, 015004 (2020)
2020
-
[12]
E. L. Hahn, Spin Echoes, Physical Review80, 580 (1950)
1950
-
[13]
De Lange, Z
G. De Lange, Z. H. Wang, D. Rist` e, V. V. Dobrovit- ski, and R. Hanson, Universal Dynamical Decou- pling of a Single Solid-State Spin from a Spin Bath, Science330, 60 (2010)
2010
-
[14]
J. M. Taylor, P. Cappellaro, L. Childress, L. Jiang, D. Budker, P. R. Hemmer, A. Yacoby, R. Walsworth, and M. D. Lukin, High-sensitivity diamond magnetometer with nanoscale resolution, Nature Physics4, 810 (2008)
2008
-
[15]
Meinel, M
J. Meinel, M. Kwon, R. Maier, D. Dasari, H. Sumiya, S. Onoda, J. Isoya, V. Vorobyov, and J. Wrachtrup, High-resolution nanoscale NMR for arbitrary magnetic fields, Communications Physics 6, 302 (2023)
2023
-
[16]
Cronenberger, D
S. Cronenberger, D. Scalbert, D. Ferrand, H. Boukari, and J. Cibert, Atomic-like spin noise in solid-state demonstrated with manganese in cadmium telluride, Nature Communications6, 8121 (2015)
2015
-
[17]
H. S. Jung, J. Cremer, A. Zhang, S. Fan, S. Kim, G. Yang, R. L. Walsworth, and D. Ham, Impedance- Tuned Microwave Loop for Fast, Homogeneous Rabi Oscillations of a Dense Ensemble of NV-Diamond Electronic Spins, Nano Letters25, 15566 (2025)
2025
-
[18]
G. D. Fuchs, V. V. Dobrovitski, D. M. Toyli, F. J. Heremans, and D. D. Awschalom, Gigahertz Dy- namics of a Strongly Driven Single Quantum Spin, Science326, 1520 (2009)
2009
-
[19]
F. Foroughi, J.-M. Mol, T. Mueller, J. R. Kirt- ley, K. A. Moler, and H. Bluhm, A micro-SQUID with dispersive readout for magnetic scanning mi- croscopy, Applied Physics Letters112, 252601 (2018), arXiv:1803.07636 [cond-mat]
Pith/arXiv arXiv 2018
-
[20]
Wang, Y.-X
G. Wang, Y.-X. Liu, J. M. Schloss, S. T. Alsid, D. A. Braje, and P. Cappellaro, Sensing of Arbitrary- Frequency Fields Using a Quantum Mixer, Physical Review X12, 021061 (2022)
2022
-
[21]
Z. Yin, J. J. Welter, C. A. Hart, P. V. Petruzzi, and R. L. Walsworth, High-resolution and wide- frequency-range magnetic spectroscopy with solid- state spin ensembles, npj Quantum Information11, 190 (2025)
2025
-
[22]
C. Wei, A. S. M. Windsor, and N. B. Manson, A strongly driven two-level atom revisited: Bloch - Siegert shift versus dynamic Stark splitting, Jour- nal of Physics B: Atomic, Molecular and Optical Physics30, 4877 (1997)
1997
-
[23]
J. R. Maze, P. L. Stanwix, J. S. Hodges, S. Hong, J. M. Taylor, P. Cappellaro, L. Jiang, M. V. G. Dutt, E. Togan, A. S. Zibrov, A. Yacoby, R. L. Walsworth, and M. D. Lukin, Nanoscale magnetic sensing with an individual electronic spin in dia- mond, Nature455, 644 (2008). 9
2008
-
[24]
Machado, E
F. Machado, E. A. Demler, N. Y. Yao, and S. Chat- terjee, Quantum Noise Spectroscopy of Dynamical Critical Phenomena, Physical Review Letters131, 070801 (2023)
2023
-
[25]
C. Du, T. Van Der Sar, T. X. Zhou, P. Upadhyaya, F. Casola, H. Zhang, M. C. Onbasli, C. A. Ross, R. L. Walsworth, Y. Tserkovnyak, and A. Yacoby, Control and local measurement of the spin chemical potential in a magnetic insulator, Science357, 195 (2017)
2017
-
[26]
T. X. Zhou, J. J. Carmiggelt, L. M. G¨ achter, I. Es- terlis, D. Sels, R. J. St¨ ohr, C. Du, D. Fernan- dez, J. F. Rodriguez-Nieva, F. B¨ uttner, E. Demler, and A. Yacoby, A magnon scattering platform, Pro- ceedings of the National Academy of Sciences118, e2019473118 (2021)
2021
-
[27]
Bertelli, J
I. Bertelli, J. J. Carmiggelt, T. Yu, B. G. Simon, C. C. Pothoven, G. E. W. Bauer, Y. M. Blanter, J. Aarts, and T. Van Der Sar, Magnetic resonance imaging of spin-wave transport and interference in a magnetic insulator, Science Advances6, eabd3556 (2020)
2020
-
[28]
Liu, Y.-R
G.-Q. Liu, Y.-R. Zhang, Y.-C. Chang, J.-D. Yue, H. Fan, and X.-Y. Pan, Demonstration of entanglement-enhanced phase estimation in solid, Nature Communications6, 6726 (2015)
2015
-
[29]
X. Zhou, M. Wang, X. Ye, H. Sun, Y. Guo, H. Shuo, Z. Chai, W. Ji, K. Xia, F. Shi, Y. Wang, and J. Du, Entanglement-Enhanced Nanoscale Single- Spin Sensing (2025), arXiv:2504.21715 [quant-ph]
arXiv 2025
-
[30]
R. R. Allen, F. Machado, I. L. Chuang, H.-Y. Huang, and S. Choi, Quantum Computing En- hanced Sensing (2025), arXiv:2501.07625 [quant- ph]
arXiv 2025
-
[31]
Van Der Sar, F
T. Van Der Sar, F. Casola, R. Walsworth, and A. Yacoby, Nanometre-scale probing of spin waves using single electron spins, Nature Communications 6, 7886 (2015). Appendix A nanoscale magnetic spectrum analyzer based on qubit dressed states June 5, 2026 11 CONTENTS I. Introduction 1 II. results 2 A. Demonstration on a test signal 2 B. Measurements on a YIG ...
2015
-
[32]
Optical 12 b
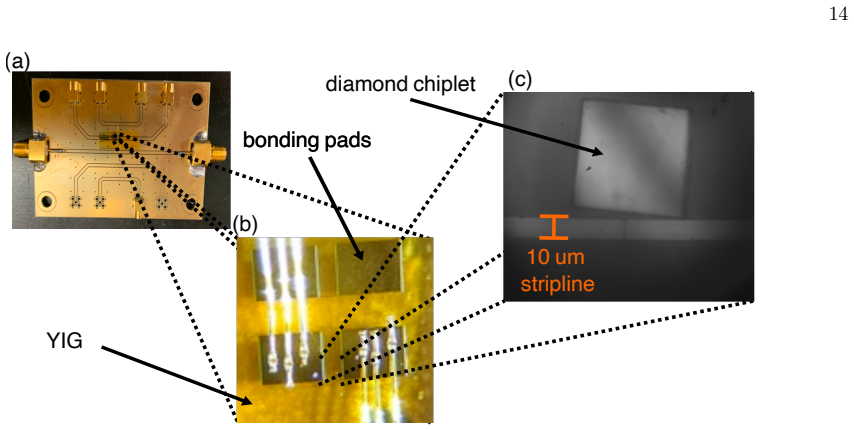
Experimental setup 12 a. Optical 12 b. Microwave (MW) 13 c. NV-Diamond pillar sample 13 d. YIG sample 14
-
[33]
Theoretical framework 16
Measurement sequence 15 B. Theoretical framework 16
-
[34]
Three level model 17
AC Stark shift and three-level dressed state picture 16 a. Three level model 17
-
[35]
Qubit dressed state spectrum analyzer 18
-
[36]
Characterization results 22
Scaling for broadband noise 21 C. Characterization results 22
-
[37]
Probe field amplitude and NV phase variance 23 b.τdependence 24 c
Experimental parameter calibrations and systematic dependencies 23 a. Probe field amplitude and NV phase variance 23 b.τdependence 24 c. ∆ dependence 24 D. YIG 25
-
[38]
Damon-Eshbach magnons 25
-
[39]
Characterization by NV ODMR and T 1 measurements 25
-
[40]
Scanning confocal microscope setup used for the NV characterization measurements
Fits 26 12 532nmLaser Objective Attenuation wheel Flipable mirrorMirror Lens APD 594nmlongpassfilter Waveplate Fiber Dichroic Polarizing Beamsplitter Galvanic Mirror WhitelightCCD Pinhole AOM in out Figure 5. Scanning confocal microscope setup used for the NV characterization measurements. Appendix A: Experimental Details
-
[41]
Optical The excitation is done with a 532 nm, Cobolt Samba laser operated at 25 mW
Experimental setup a. Optical The excitation is done with a 532 nm, Cobolt Samba laser operated at 25 mW. Optical initialization and readout pulses are generated using an acousto-optic modulator (AOM, Isomet 1250C-848) in a double-pass configuration. Half- and quarter-wave plates set the beam polarization, and a single-mode fiber serves as a spatial filte...
-
[42]
Visualisation of artificial noise time traces uploaded to the AWG
Noise creation To generate the RF noise signals in order to characterize the dressed state DD spectrum analyzer we use the fact that providing a RF signal at frequencyf IF on both the I and Q channels of an IQ mixer will create two sidebands according to: cos (fLOt)·cos (f IFt) (A1) = 1 2 [cos ((fLO −f IF)t) + cos ((fLO +f IF)t)] (A2) 15 (a) (b) Figure 8....
-
[43]
We drive the NV electronic spin with MW pulses of frequencyf 0→+1 equal to the splitting between the|0⟩and|+ 1⟩spin states
Measurement sequence Initialization of NV centers tom s = 0 is done by applying a laser pulse of 2.1µs length. We drive the NV electronic spin with MW pulses of frequencyf 0→+1 equal to the splitting between the|0⟩and|+ 1⟩spin states. Applying a pulse withf 0→+1 the for one quarter of the Rabi cycle duration rotates the NV spin from the state|0⟩to a coher...
-
[44]
Fig.9 shows details of the dressed state spin echo sequence used to aquire the experimental results shown in Fig
Typical Rabi rates of the setup are 2 MHz. Fig.9 shows details of the dressed state spin echo sequence used to aquire the experimental results shown in Fig. 1. After NV spin state initialization via a green laser (A), a π 2 MW pulse prepares the NV spin into 16 init. probe tone meas. PL A B B C C D D E E F F +x -x-y +y A Figure 9. Visualization of spin ec...
-
[45]
AC Stark shift and three-level dressed state picture For a two-level system with an applied the Hamiltonian ˆHcan be written as: ˆH=h γB 0 ˆSz +h γB probe cos (2πfprobet+ϕ) ˆSx.(B1) Let the eigenstates of ˆSz be|0⟩,|+ 1⟩; Eq. B1 can then be expressed as: ˆH= h γ 2 0B probe cos(2πfprobet+ϕ) Bprobe cos(2πfprobet+ϕ) 2B 0 .(B2) 17 The state Ψ of the system ev...
-
[46]
Qubit dressed state spectrum analyzer The functionality of the qubit dressed state spectrum analyzer arises from four key physical effects or points:
-
[47]
Applying an off resonant MW field to a two (or three) level system changes the energy difference of the eigenstates byδE≈ Ω2 2∆
-
[48]
A relative shif in qubit eigenenergies leads to phase accumulation over time if the qubit is in a super- position state
-
[49]
Decoherence of a qubit follows the variance of the phase via Λ(T) = exp − 1 2 ⟨ϕ2(T)⟩ .[24]
-
[50]
19 full model simple 2 level model Figure 10
A non linear mixing element, including the response of the qubit to RF fields arising from the AC stark shift enables downconversion of a noise spectrum by an arbitrary LO frequency. 19 full model simple 2 level model Figure 10. Magnitude Λ and frequency shift with respect to the detuning of the probe field. Close to resonance the magnitude decreases due ...
-
[51]
B35 is straight-forward
Scaling for broadband noise When the noise width ofS s(ω) is much larger then the width of the filter functionW τ(θ) (≈1/τ) analysis of Eq. B35 is straight-forward. In this case we can assume that the noise distribution is an effective constant Ss(f) =S s and calculate: ⟨ϕ2⟩= Ss 2 Bprobeγ2 c2∆ 2Z ∞ −∞ d f 16 (2πf) 2 sin4 πf τ 2 = Ss 2 Bprobeγ2 c2∆ 2 τ(B37...
-
[52]
Dressed state spin echo and reference spin echo measurements for the probe field on and off, with application of a Lorentzian noise signal
Spectra probe tone on off mw switches (a) (b) Figure 12. Dressed state spin echo and reference spin echo measurements for the probe field on and off, with application of a Lorentzian noise signal. Data is expressed in terms of the unnormalized NV ensemble spin (a) magnitude Λ and (b) phaseϕ. For the dressed state spin echo measurement, mixing of the probe...
-
[53]
Probe field amplitude and NV phase variance (a) (b) = 30 MHz = 10 MHz Figure 13
Experimental parameter calibrations and systematic dependencies a. Probe field amplitude and NV phase variance (a) (b) = 30 MHz = 10 MHz Figure 13. Calibration of the probe field. (a)B probe as a function of the voltage applied on the I and Q channels of the I-Q mixer and connected to MW2 to generate the probe field, for two values of probe field detuning...
-
[54]
Damon-Eshbach magnons Consistent with the literature for similar samples we find that the most relevant magnons for our measure- ment are Damon-Eshbach modes within the YIG film. The dispersion relation of Damon-Eshbach magnons in a film of thicknesslcan be written, in the magnetostatic limit, as fDE(k) =γ s Bext + Ms 2 2 − Ms 2 2 e−2kl,(D1) wheref DE(k) ...
-
[55]
This is crucial as the noise of the thermal magnons would otherwise directly decohere the NV spins
Characterization by NV ODMR and T 1 measurements From previous NV measurements on a similar YIG film [26]B ext ≈303 G along the NV sensing axis is required for the FMR to have a higher frequency than the NVf 0→−1 transition. This is crucial as the noise of the thermal magnons would otherwise directly decohere the NV spins. For this bias magnetic field, th...
2020
-
[56]
Fits a. Spin EchoFor the fit of the magnon spectra measured using the dressed state spin echo sequence, the following equation is used: Ss(f)≈ Z dk·n(f, µ)F(k, d)D(f, k)≈n(f, µ) Z dk′ ·δ k′−k(f) k′ e−2dk′ 1−e −2tyigk′ .(D2) Heren(f, µ) = kB T hf−µ is the Rayleigh-Jeans distribution for which we estimateµ= 0 as the probe field driving the magnons is relati...
discussion (0)
Sign in with ORCID, Apple, or X to comment. Anyone can read and Pith papers without signing in.