REVIEW 4 major objections 4 minor 29 references
Glitches in solar-like oscillating F-type stars: Possible contribution of non-linear terms
T0 review · 4 major / 4 minor · reviewed 2026-08-11 · deepseek-v4-flash
Pith's one-line read F-type star glitch fits need a term at twice the acoustic depth to locate the convective envelope correctly.
desk verdict A well-motivated, honestly limited proposal that F-star glitch fits need a 2τ harmonic; the supporting evidence is partly circular and statistically weak. read the letter →
The pith
A machine-rendered reading of the paper's core claim, the machinery that carries it, and where it could break.
The reading
What carries the argument
The central object is the glitch signature: the oscillatory frequency perturbation caused by a sharp change in temperature and composition gradients at the base of the convective envelope, normally modelled as a sinusoid in $4\pi\nu\tau_{cz}$. The load-bearing addition is a first-harmonic term oscillating at twice the acoustic depth, which models the non-sinusoidal shape of the F-type star signature and is what allows the three seismic indicators to point to the same $\tau_{cz}$.
What would settle it
Take the highest signal-to-noise F-type star and compute the Fourier transform of the observed $r_{010}$ residuals after subtracting the standard (sinusoidal) fit: the harmonic hypothesis predicts a narrow peak at exactly twice the fitted acoustic depth (~8300 s for KIC6679371), whereas the alternative that this is an independent structural feature predicts that the peak should persist at the same period even when the assumed BSCZ term is moved.
Extended reading notes
Core claim
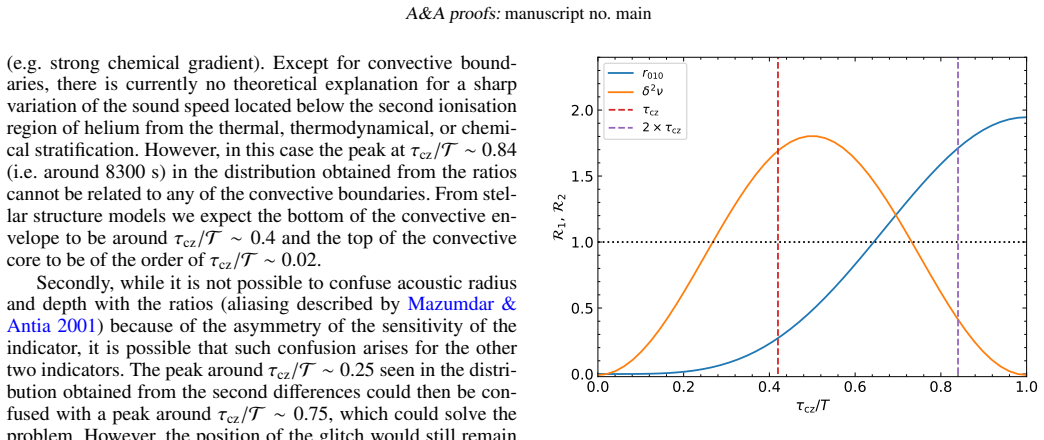
The paper claims that in F-type stars the acoustic glitch produced by the base of the convective envelope is not the quasi-sinusoidal signal seen in G-type stars, and that the standard first-order glitch formula is incomplete for these stars. Fitting the frequencies, second differences, and $r_{010}$ ratios with the usual expression gives inconsistent acoustic depths for the same star; fits that add a term oscillating at twice the acoustic depth, $k A_2(\tilde\nu/\nu)\cos(8\pi\nu\tau_{cz}+2\phi_2)$ (or $\cos(4\pi\nu(T-2\tau_{cz})+2\phi_2)$ for the ratios), bring the three indicators into agreement and place the measured BSCZ close to stellar-model predictions. The most dramatic case is KIC6679371, whose BSCZ acoustic depth becomes $\tau_{cz}/T = 0.422\pm0.016$ instead of $0.850\pm0.021$. The authors emphasize that the standard expression already fits the data within current uncertainties and that the physical origin of the extra term is not yet established; they interpret the result as evidence that the convective-to-radiative transition differs between G- and F-type stars.
Load-bearing premise
The load-bearing premise is that the peak near twice the acoustic depth in the $r_{010}$ distributions is the harmonic of the BSCZ glitch signal, not an independent structural feature, and that it is correctly modelled by the added cosine term; if that premise fails, the three-indicator agreement is coincidence.
Editorial extensions
If this is right
- For KIC6679371, the BSCZ moves from $\tau_{cz}/T = 0.850 \pm 0.021$ to $0.422 \pm 0.016$, agreeing with stellar evolution models instead of requiring an implausibly deep convective envelope.
- The $r_{010}$ ratios become a reliable BSCZ indicator for F-type stars, at least as useful as second differences, when the harmonic term is included.
- G-type measurements are unaffected by the extra term, so previously published G-type BSCZ values remain valid; only hotter F-type stars are affected.
- The fitted amplitude ratio $k$ grows with effective temperature around $T_{\rm eff} \sim 6000$ K, marking a regime change consistent with the G/F boundary.
- Reconciling the three indicators removes the need for penetrative convection deeper than about $2\,H_p$, consistent with the modest extensions expected from 3D simulations.
Reading between the lines
- Editorial extension: if the harmonic interpretation is correct, published F-type BSCZ depths derived from standard fits may be systematically too large by roughly a factor of two; reanalysing existing Kepler targets with the non-sinusoidal expression could sharpen constraints on convective overshoot.
- The same two-period structure should appear in other frequency combinations built from the same modes; checking $r_{02}$ ratios or alternative ratio definitions would provide an independent test without waiting for new data.
- Because the current $\chi^2$ values cannot distinguish the two formulas, the decisive statistical test is higher-precision ratios, which should show a significant $\chi^2$ improvement and a stable $k$ value if the extra term is real.
- The steep rise of $k$ with $T_{\rm eff}$ suggests the boundary sharpens or the mode amplitude relative to the structural discontinuity grows in F stars; this could be tested against 3D simulations of the convective boundary region.
Editorial analysis
A structured set of objections, weighed in public.
Referee Report
Summary. The paper analyzes glitch signatures in nine Kepler solar-like stars and the Sun using frequencies, second differences, and the r010 ratios. For the F-type stars in the sample, standard glitch fits give inconsistent BSCZ acoustic depths across the three indicators, with the r010 ratios yielding depths much larger than stellar evolution model predictions. The authors propose that the glitch signature is non-sinusoidal and add an extra term oscillating at twice the acoustic depth of the standard term (Eqs. 20-22). They report that this non-sinusoidal expression brings the three indicators into better mutual agreement and, for sample A, yields BSCZ positions in better agreement with stellar models (Table 2, Fig. 6). The physical origin of the extra term is discussed: magnetic activity is shown to be negligible, a second-order asymptotic calculation yields too small an amplitude, and a weakly non-linear calculation only matches the observed amplitude if mode amplitudes are inflated by eight orders of magnitude (Sect. 8.3).
Significance. The discrepancy between seismically inferred and model-predicted BSCZ depths for F-type stars is a real and important problem, and the idea that an overlooked harmonic term could resolve it is physically interesting. If confirmed, the result would imply a different structure at the convective/radiative transition in F-type stars than in G-type stars. The paper is commendably transparent: it explicitly states that the standard expression already reproduces the data (Sect. 3.3), that the fit statistics do not favor one expression over the other (Appendix C), and that the theoretical mechanism is not yet understood (Sect. 8.3). The sensitivity analysis of the three indicators (Fig. 3) and the careful discussion of degeneracies are useful contributions. However, the evidence presented does not yet independently support the harmonic interpretation, and the improved agreement with stellar models is partially built into the analysis through the a priori restriction to shallow solutions. The paper is best viewed as an exploratory proposal with a testable prediction for future, higher-precision data, but the abstract and conclusions overstate the current support for the claim.
major comments (4)
- [Sects. 3.4, 4.3, Eqs. 20-22] The synthetic validation of the non-sinusoidal expression is circular. Group 2 synthetic data are generated using the same two-term expression (Eq. 20) that is subsequently used to fit those data. Recovering the input τ_cz therefore only demonstrates that the fitting pipeline can invert the assumed model; it does not independently establish that a 2τ harmonic exists in the observed oscillations. Statements in Sects. 5.6 and 6.3 that a common solution is obtained 'only when the glitch signature is considered as non-sinusoidal' go beyond what these synthetic tests can establish. I recommend treating these tests as consistency checks and rewording the conclusions accordingly.
- [Appendix C] The reduced χ2 values give no statistically significant preference for the non-sinusoidal expression. For KIC6679371 the values are 0.48 (standard) versus 0.47 (non-sinusoidal); for KIC1435467 they are 1.07 versus 0.97; and for KIC10162436 the non-sinusoidal value (0.91) lies close to the two standard solutions (1.15 and 0.99). With such small differences and with the larger number of free parameters in the non-sinusoidal model, the data cannot discriminate between the two formulations. The paper itself states 'we cannot really favour one or the other fitting expression directly from the data' (Appendix C). Given that the central claim rests on the reality of the 2τ term, this lack of discriminating power is a load-bearing weakness and should be acknowledged in the abstract and conclusion.
- [Sect. 8.3, Eq. 23, Fig. 9] The theoretical derivations do not provide a working mechanism for the observed amplitude of the extra term. The weakly non-linear expansion yields k much smaller than 1 for realistic mode amplitudes; only after amplifying the mode amplitude by a factor of 10^8 does the predicted k exceed unity (Fig. 9). Meanwhile, the fitted k for KIC6679371 is about 14.5 (Appendix C). The paper reports this discrepancy but still presents the non-linear origin as 'promising' in the conclusion. As long as no mechanism predicts the observed amplitude, the 2τ term remains an ad hoc fitting device, and this should be stated more prominently in the conclusions.
- [Sects. 4.5, 7, Fig. 6] The improved agreement with stellar evolution models in Fig. 6 is substantially influenced by the a priori restriction to solutions with τ_cz/T < 0.5. Because model predictions for these stars lie in the range τ_cz/T ≈ 0.3-0.5 (Fig. 6), discarding the deeper solutions makes agreement with models partly by construction. For example, for KIC6679371 the standard fit gives τ_cz/T = 0.850 while the non-sinusoidal fit, after this restriction, gives 0.422. A more convincing test would be to show that the non-sinusoidal fit selects the shallow solution without the prior, or to compare the full posterior distributions of both solutions against the model predictions. As presented, Fig. 6 does not constitute independent confirmation of the harmonic hypothesis.
minor comments (4)
- [Sect. 3, first paragraph] The star KIC6679371 is misspelled as 'KIC66679371' in the first paragraph of Sect. 3.
- [Caption of Fig. B.2] The caption reads 'KIC10163436' but the star is KIC10162436.
- [Sect. 4.5] The sentence 'we discuss hereafter only values of τcz/T < 0.5 (tcz/T > 0.5)' could be clarified to state whether this is a hard prior applied during fitting or a post-hoc selection on the posterior distributions; the distinction matters for interpreting the model comparison in Sect. 7.
- [Appendix C] The text states that for KIC10162436 the reduced χ2 of the non-sinusoidal fit is 'slightly larger', but the figure reports 0.91 for that fit versus 1.15 and 0.99 for the standard solutions; please reconcile the text with the figure.
Circularity Check
The central identification of the 2τ glitch feature is partly circular: synthetic data are tuned to the observed peaks, and the shallower BSCZ branch is selected using model predictions that are then quoted as confirmation.
-
fitted input called prediction
[Sect. 3.4 and Sect. 4.3 (Eq. 20, Table 1)]
"The parameters of the synthetic glitches are chosen to best reproduce the main peak of the distribution of τcz obtained from the three indicators of the observed stars ... We tested again all the peaks in the distributions and selected only the values of τcz giving the best agreement with the observed distributions, meaning (τcz/T = 0.42 andτcz/T = 0.84; τcz = 4150 s and 8300 s, respectively)."
The synthetic validation is built with the very model being tested: frequencies are generated from Eq. 20 containing the 2τ term, and are then fit with the non-sinusoidal expression (Eqs. 21-22) that contains the same 2τ term. Moreover, the input acoustic depth in the synthetic data (τcz/T = 0.42, 4150 s) is not an independent prediction; it is explicitly selected to reproduce the dominant peaks already present in the observed distributions. The resulting synthetic distributions therefore agree with the observations by construction, and the recovery of the input τcz cannot independently confirm that the observed peak at twice the acoustic depth is a harmonic of the BSCZ glitch.
-
other
[Sect. 4.5 and Sect. 7 (Fig. 6)]
"Most of the time, the wrong solution is deeper inside the star than the correct one, and for tcz/T < 0.5, that is much deeper than what we expect from theoretical stellar structure models (see Sect. 7). To avoid confusion, we discuss hereafter only values of τcz/T < 0.5."
The non-sinusoidal fit is degenerate: for the r010 ratios it admits two solutions, τ and 2τ. The deeper (2τ) branch is discarded because it conflicts with the stellar-model expectation, and the analysis is restricted to τcz/T < 0.5. Section 7 then reports that the non-sinusoidal measurement is 'in better agreement with the predictions of stellar models'. Since the same model expectations were used to choose which branch to report, the agreement with models is in part a consequence of that selection rather than an independent confirmation of the 2τ-term interpretation.
full rationale
The paper is transparently exploratory: it states that the standard expression already fits the data (Appendix C shows nearly identical reduced χ2 for the two forms), and it does not claim the non-sinusoidal form is statistically preferred. The two circular steps are (1) the synthetic-data test, where the input τcz is chosen from the observed peaks and then recovered with the same functional form, and (2) the branch selection, where the deeper solution of the degenerate fit is excluded using stellar-model priors and the agreement with those same priors is then presented as evidence. These steps make the reported shallower BSCZ depths (e.g. τcz/T = 0.422 for KIC6679371) partly self-validating. However, the central claim is not fully forced: the stellar evolution models are an external benchmark, the Group 1 synthetic test (standard sinusoid) does fail to reproduce the observed pattern in the ratios, and the inferred depths carry uncertainties that are not exactly equal to the model prior. The attempted physical explanations in Sect. 8.3 are honest failures (predicted k remains ≪1 unless mode amplitudes are inflated by 10^8), which further weakens the interpretation but is a correctness issue rather than circularity.
Assumptions & free parameters
free parameters (3)
- k (relative amplitude of the 2τ term in the non-sinusoidal fit) =
e.g. 2.02+2.44−1.10 (KIC1435467), 14.48+47.23−9.77 (KIC6679371), 0.93+1.20−0.48 (KIC10162436)
- A2 (amplitude of the glitch in synthetic data) =
0.15 or 0.25 µHz (Table 1)
- τ_cz (acoustic depth of the BSCZ) =
e.g. KIC6679371: 4168+165−92 s (non-sinusoidal) versus 8397+207−179 s (standard)
assumptions (4)
- domain assumption The BSCZ glitch signature is described by the variational asymptotic expressions of Monteiro et al. (1994) and Roxburgh & Vorontsov (1994) (Eqs. 1, 6, 8).
- domain assumption The transition at the BSCZ produces a sharp variation in the temperature and composition gradients that acts as a localized glitch.
- ad hoc to paper An additional term with twice the acoustic depth (Eqs. 21-22) captures the non-sinusoidal shape of the glitch; its functional form is taken as cos(8πντ_cz).
- domain assumption CESAM2k20 stellar evolution models predict reliable BSCZ positions for the mass and Teff range considered (Sect. 7, Fig. 6).
Cite this review
Pith. "Pith review of Glitches in solar-like oscillating F-type stars: Possible contribution of non-linear terms." pith.science (2026). https://pith.science/paper/L5FZIDPP
@misc{pith2026241215099,
  author       = {Pith},
  title        = {Pith review of: Glitches in solar-like oscillating F-type stars: Possible contribution of non-linear terms},
  year         = {2026},
  howpublished = {\url{https://pith.science/paper/L5FZIDPP}},
  note         = {Machine review of arXiv:2412.15099}
}
abstract
The glitch signatures in $r_{010}$ for F-type stars (higher amplitude and period of the oscillatory component) are very different from those of G-type stars. The aim of this work is to analyse the signatures of these glitches and understand the origin of the differences in these signatures between G-type and F-type stars. We fit the glitch signatures in the frequencies, second differences, and $r_{010}$ ratios while assuming either a sinusoidal variation or a more complex expression. The fit provides the acoustic depth, and hence the position, of the bottom of the convective envelope for nine \textit{Kepler} stars and the Sun. We find that for F-type stars, the most commonly used fitting expressions for the glitch of the bottom of the convective envelope provide different measurements of the position of the bottom of the convective envelope for the three seismic indicators, while it is not the case for G-type stars. When adding an additional term in the fitting expression with twice the acoustic depth of the standard term (a contribution that accounts for the highly non-sinusoidal shape of the signature in the $r_{010}$ ratios), we find better agreement between the three seismic indicators and with the prediction of stellar evolution models. While the origin of this additional term is not yet understood, this may be an indication that the transition between the convective envelope and the underlying radiative zone is different for G- and F-type stars. This outcome brings new insight into the physics in these regions.
Figures


Figures from the paper (6 more)


Reference graph
Works this paper leans on
-
[1]
Anderson, R. I., Reiners, A., & Solanki, S. K. 2010, A&A, 522, A81
work page 2010
- [2]
-
[3]
Cunha, M. S., Avelino, P. P., Christensen-Dalsgaard, J., et al. 2019, MNRAS, 490, 909
work page 2019
-
[4]
Cunha, M. S. & Brandão, I. M. 2011, A&A, 529, A10
work page 2011
-
[5]
Cunha, M. S., Damasceno, Y . C., Amaral, J., et al. 2024, A&A, 687, A100
work page 2024
-
[6]
Cunha, M. S., Stello, D., Avelino, P. P., Christensen-Dalsgaard, J., & Townsend, R. H. D. 2015, ApJ, 805, 127
work page 2015
- [7]
-
[8]
Deheuvels, S., Brandão, I., Silva Aguirre, V ., et al. 2016, A&A, 589, A93
work page 2016
Show all 29 references
-
[9]
Dziembowski, W. A. 1993, in Astronomical Society of the Pacific Conference
1993
-
[10]
Gough, D. O. 1990, Comments on Helioseismic Inference, ed. Y . Osaki & H. Shibahashi, V ol. 367, 283
1990
-
[11]
Lomb, N. R. 1976, Ap&SS, 39, 447
1976
-
[12]
N., Silva Aguirre, V ., Davies, G
Lund, M. N., Silva Aguirre, V ., Davies, G. R., et al. 2017, ApJ, 835, 172
2017
-
[13]
& Antia, H
Mazumdar, A. & Antia, H. M. 2001, A&A, 368, L8
2001
-
[14]
Mazumdar, A., Monteiro, M. J. P. F. G., Ballot, J., et al. 2014, ApJ, 782, 18
2014
-
[15]
Monteiro, M. J. P. F. G., Christensen-Dalsgaard, J., & Thompson, M. J. 1994, A&A, 283, 247
1994
-
[16]
Pereira, L. F. R., Faria, J. P. S., & Monteiro, M. J. P. F. G. 2017, in European Physical Journal Web of Conferences, V ol. 160, European Physical Journal Web of Conferences, 01015
2017
-
[17]
1993, A&A, 274, 595
Provost, J., Mosser, B., & Berthomieu, G. 1993, A&A, 274, 595
1993
-
[18]
Roxburgh, I. W. 2009, A&A, 493, 185
2009
-
[19]
Roxburgh, I. W. & V orontsov, S. V . 1994, MNRAS, 268, 880
1994
-
[20]
Roxburgh, I. W. & V orontsov, S. V . 2003, A&A, 411, 215
2003
-
[21]
Scargle, J. D. 1982, ApJ, 263, 835
1982
-
[22]
M., Marsden, S
Seach, J. M., Marsden, S. C., Carter, B. D., et al. 2020, MNRAS, 494, 5682
2020
-
[23]
2011, in The Impact of Asteroseismology across Stellar Astro- physics, 48
Smolec, R. 2011, in The Impact of Asteroseismology across Stellar Astro- physics, 48
2011
-
[24]
1980, ApJS, 43, 469
Tassoul, M. 1980, ApJS, 43, 469
1980
-
[25]
Thomas, A. E. L., Chaplin, W. J., Basu, S., et al. 2021, MNRAS, 502, 5808
2021
-
[26]
M., et al
Verma, K., Raodeo, K., Antia, H. M., et al. 2017, ApJ, 837, 47
2017
-
[27]
2019, MNRAS, 483, 4678
Verma, K., Raodeo, K., Basu, S., et al. 2019, MNRAS, 483, 4678
2019
-
[28]
S., Bossini, D., et al
Vrard, M., Cunha, M. S., Bossini, D., et al. 2022, Nature Communications, 13, 7553
2022
-
[29]
Zahn, J. P. 1991, A&A, 252, 179 Article number, page 15 of 20 A&A proofs: manuscript no. main Appendix A: Distributions of the glitch signature in the frequencies, second differences, and r010 ratios for sample A 0.25 0.50 0.75 1.00 cz/ KIC9206432: 0.25 0.50 0.75 1.00 cz/ 2 0....
1991
Reviewed August 11, 2026 · model on record in the stance chip above.
Discussion (0). Continue with ORCID to comment.