Calibration and Performance of Germanium High Voltage Detectors for SuperCDMS SNOLAB
Pith reviewed 2026-06-26 00:42 UTC · model grok-4.3
The pith
Germanium high-voltage detectors calibrate low energies with 71Ge peaks and resolve hundreds-of-keV events to better than 3%.
A machine-rendered reading of the paper's core claim, the machinery that carries it, and where it could break.
Core claim
SuperCDMS HV germanium detectors maintain accurate calibration from sub-keV to keV energies via 71Ge electron capture peaks while delivering energy resolution better than 3% at 356 keV under biases up to 90 V.
What carries the argument
Electron capture peaks from 71Ge decay, which supply discrete energy lines for calibrating the detector response across the low-energy range under applied high voltage.
If this is right
- The detectors can record both the low-energy signals targeted by dark matter searches and higher-energy interactions in the same dataset.
- Calibration established at low energies transfers reliably enough to support percent-level resolution at hundreds of keV.
- Performance data from the underground test directly inform the analysis methods planned for the full SuperCDMS SNOLAB run.
Where Pith is reading between the lines
- The same 71Ge calibration approach may prove applicable to the silicon HV detectors tested in the same campaign.
- High-energy resolution opens the possibility of using known gamma lines for in-situ checks during long dark matter exposures.
- Further increases in bias voltage or refinements in pulse-shape analysis could be tested to see whether resolution improves beyond the reported level.
Load-bearing premise
The electron capture peaks from 71Ge decay supply an accurate and unbiased energy calibration for the keV to sub-keV range at the bias voltages and operating conditions used in the test.
What would settle it
A measurement showing that the energy scale fixed by the 71Ge peaks deviates from the known position of the 356 keV line by more than the claimed resolution width.
Figures


read the original abstract
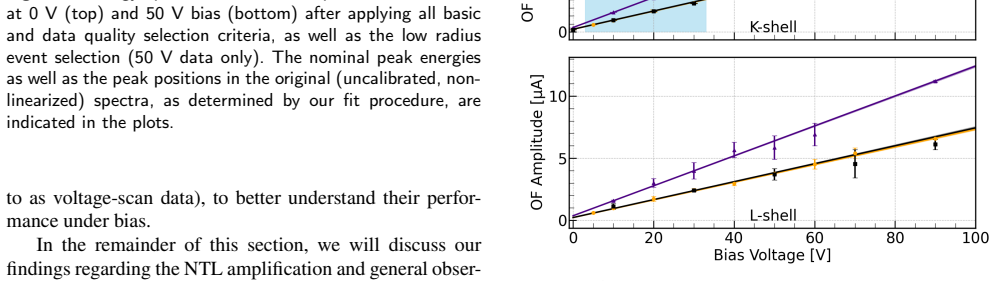
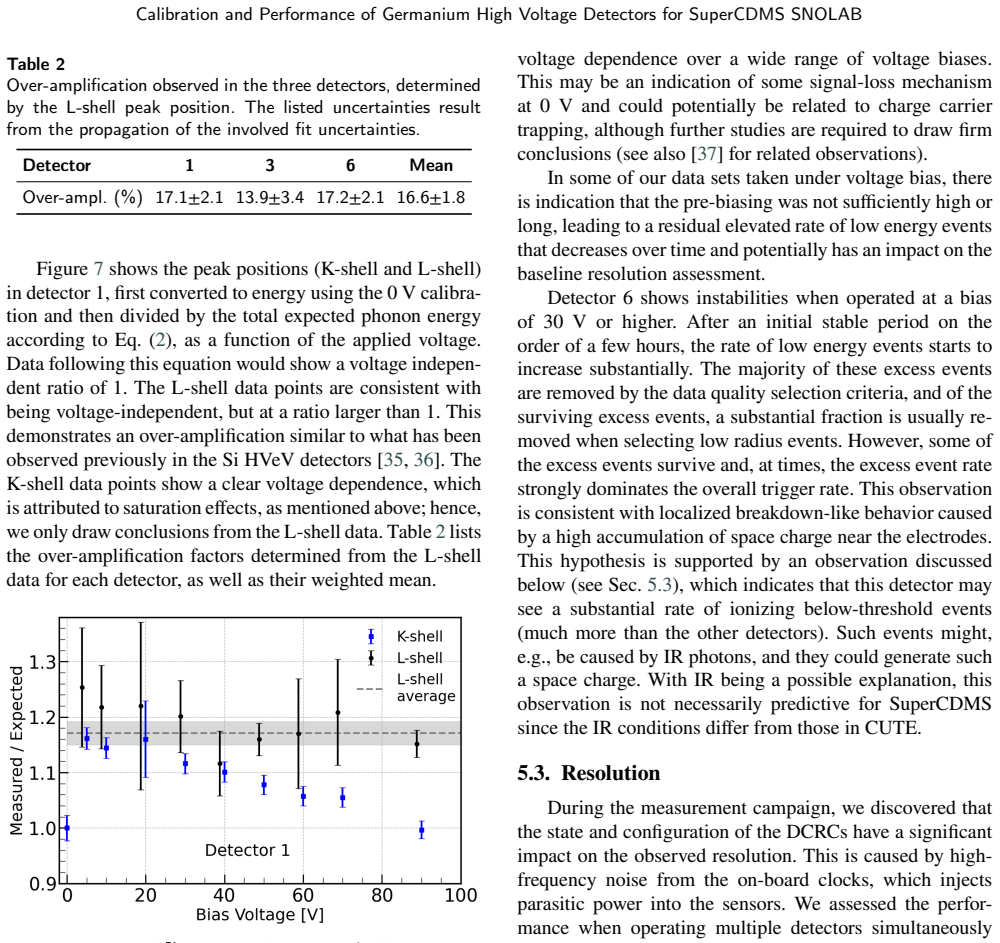
As SuperCDMS SNOLAB is getting ready to search for low mass dark matter particles, using cryogenic Ge and Si detectors, a set of six of the new SuperCDMS High Voltage (HV) detectors (four Ge and two Si) were tested in the Cryogenic Underground TEst facility (CUTE) at SNOLAB. This provided the first opportunity to gain experience with this new detector type and assess their performance thoroughly under low background conditions. Here we describe the SuperCDMS HV detector concept and discuss some of the newly developed analysis methods and approaches. Focusing on the Ge detectors, we investigate the detector performance under voltage bias (up to 90 V), exercise the low energy (keV to sub-keV range) calibration based on the electron capture peaks generated by the decay of $^{71}$Ge, assess the detector resolution, and demonstrate the unexpected (and encouraging) ability of these detectors to also measure high energy interactions in the hundreds of keV range with good resolution (better than 3% at 356 keV).
Editorial analysis
A structured set of objections, weighed in public.
Referee Report
Summary. The manuscript reports on the testing of six SuperCDMS High Voltage detectors (four Ge and two Si) in the CUTE facility at SNOLAB. It describes the HV detector concept, newly developed analysis methods, low-energy calibration in the keV to sub-keV range using 71Ge electron-capture peaks under biases up to 90 V, resolution assessment, and an unexpected high-energy capability with resolution better than 3% at 356 keV.
Significance. If the high-energy resolution result holds under verified calibration, the work supplies important operational data for SuperCDMS SNOLAB and identifies an expanded physics capability for these detectors. As a purely experimental report resting on measured data with no self-referential derivations, it provides direct, falsifiable performance benchmarks.
major comments (2)
- [High-energy performance demonstration (abstract and corresponding results section)] The headline claim of resolution better than 3% at 356 keV (abstract and high-energy performance section) is load-bearing for the central result yet rests on extrapolation from the 71Ge low-energy calibration (few–10 keV). No independent high-energy source, linearity plot versus energy, or charge-collection efficiency check at hundreds of keV is described, leaving open the possibility that HV-induced trapping or field non-uniformity biases the quoted figure.
- [Calibration and resolution assessment sections] The abstract and calibration sections state resolution and performance numbers without accompanying uncertainties, data-exclusion criteria, or explicit fitting procedures. These omissions prevent verification of the quoted figures and must be supplied for the low-energy and high-energy claims.
minor comments (2)
- [Figures and results text] Figure captions and text should explicitly state the number of events and any cuts applied when reporting resolution at 356 keV.
- [Throughout] Notation for bias voltage and energy scale should be made consistent between the low-energy calibration and high-energy sections.
Simulated Author's Rebuttal
We thank the referee for the careful and constructive review of our manuscript. We address each major comment below and will revise the paper accordingly to improve clarity and verifiability.
read point-by-point responses
-
Referee: [High-energy performance demonstration (abstract and corresponding results section)] The headline claim of resolution better than 3% at 356 keV (abstract and high-energy performance section) is load-bearing for the central result yet rests on extrapolation from the 71Ge low-energy calibration (few–10 keV). No independent high-energy source, linearity plot versus energy, or charge-collection efficiency check at hundreds of keV is described, leaving open the possibility that HV-induced trapping or field non-uniformity biases the quoted figure.
Authors: We agree that the 356 keV resolution figure is extrapolated from the low-energy 71Ge calibration assuming linear response across the energy range. The manuscript does not present an independent high-energy calibration, linearity plot, or dedicated charge-collection efficiency measurement at hundreds of keV. We will revise the abstract and high-energy performance section to explicitly state the extrapolation method, discuss the physical basis for assuming linearity in these HV detectors, and address the possible impact of trapping or field non-uniformity. The claim will be qualified to reflect these limitations. revision: partial
-
Referee: [Calibration and resolution assessment sections] The abstract and calibration sections state resolution and performance numbers without accompanying uncertainties, data-exclusion criteria, or explicit fitting procedures. These omissions prevent verification of the quoted figures and must be supplied for the low-energy and high-energy claims.
Authors: We accept that the quoted resolution and performance numbers require supporting details. In the revised manuscript we will add uncertainties to all reported resolution values, describe the event selection and data-exclusion criteria applied in the analysis, and provide explicit descriptions of the fitting procedures (including functional forms and goodness-of-fit metrics) for both the low-energy 71Ge peaks and the high-energy features. revision: yes
Circularity Check
Purely experimental report with no derivations, predictions, or self-referential equations
full rationale
The manuscript is an experimental performance report on Ge HV detectors. It describes hardware testing, data collection in CUTE, calibration via measured 71Ge electron-capture peaks, and direct resolution measurements (including at 356 keV). No equations, fitted parameters relabeled as predictions, uniqueness theorems, or self-citation chains appear. Claims rest on observed spectra and statistics rather than any derivation that reduces to its own inputs by construction. This is the normal case for a detector characterization paper and receives the default non-finding.
Axiom & Free-Parameter Ledger
axioms (1)
- domain assumption Electron capture peaks from 71Ge decay provide accurate energy calibration points in the keV to sub-keV range.
Reference graph
Works this paper leans on
-
[1]
Abusaidiet al.(CDMS Collaboration), Phys
R. Abusaidiet al.(CDMS Collaboration), Phys. Rev. Lett.84, 5699 (2000)
2000
-
[2]
The CDMS II Collaboration, Science327, 1619 (2010)
2010
-
[4]
Agneseet al.(SuperCDMS collaboration), Phys
R. Agneseet al.(SuperCDMS collaboration), Phys. Rev. Lett.112, 041302 (2014). SuperCDMS Collaboration, M.F. Albakry et. al:Preprint submitted to ElsevierPage 15 of 16 Calibration and Performance of Germanium High Voltage Detectors for SuperCDMS SNOLAB
2014
-
[5]
Agneseet al.(SuperCDMS Collaboration), Phys
R. Agneseet al.(SuperCDMS Collaboration), Phys. Rev. Lett.116, 071301 (2016)
2016
-
[6]
Agneseet al.(SuperCDMS Collaboration), Phys
R. Agneseet al.(SuperCDMS Collaboration), Phys. Rev. D99, 062001 (2019)
2019
-
[7]
Camuset al., Frontiers in Physics11, 1319879 (2024)
P. Camuset al., Frontiers in Physics11, 1319879 (2024)
2024
-
[8]
Agneseet al.(SuperCDMS Collaboration), Phys
R. Agneseet al.(SuperCDMS Collaboration), Phys. Rev. Lett.120, 061802 (2018)
2018
-
[9]
Agneseet al.(SuperCDMS Collaboration), Phys
R. Agneseet al.(SuperCDMS Collaboration), Phys. Rev. Lett.112, 241302 (2014)
2014
-
[10]
Agneseet al.(SuperCDMS Collaboration), Phys
R. Agneseet al.(SuperCDMS Collaboration), Phys. Rev. D97, 022002 (2018)
2018
-
[11]
B. S. Neganov and V. N. Trofimov, Otkryt. Izobret.146, 215 (1985), USSR Patent No. 1037771
1985
-
[12]
P. Luke, J. Appl. Phys.64, 6858 (1988)
1988
-
[13]
R. Pehl, F. Goulding, D. Landis, and M. Lenzlinger, Nucl. Instrum. Methods59, 45 (1968)
1968
-
[14]
Kurinsky, P
N. Kurinsky, P. Brink, B. Cabrera, R. Partridge, and M. Pyle, PoS ICHEP2016, 1116 (2017)
2017
-
[15]
thesis, Stanford University (2018)
N.A.Kurinsky,TheLow-MassLimit:DarkMatterDetectorswitheV- Scale Energy Resolution, Ph.D. thesis, Stanford University (2018)
2018
-
[16]
Irwin, S
K. Irwin, S. Nam, B. Cabrera, B. Chugg, and B. Young, Rev. Sci. Instrum.66, 5322 (1995)
1995
-
[17]
T. Saab, R. Clarke, B. Cabrera, R. Abusaidi, and R. Gaitskell, Nucl. Instrum. Methods A444, 300 (2000)
2000
-
[18]
A. E. Szymkowiak, R. L. Kelley, S. H. Moseley, and C. K. Stahle, J. Low Temp. Phys.93, 281 (1993)
1993
-
[19]
Wilsonet al., J
J. Wilsonet al., J. Instrum.17, P07010 (2022)
2022
-
[20]
Hansen, F
S. Hansen, F. DeJongh, J. Hall, B. Hines, M. Huber, T. Kiper, V.Mandic,W.Rau,T.Saab,D.Seitz,andK.Sundqvist,IEEENuclear ScienceSymposium&MedicalImagingConference,Knoxville,TN, USA, 2010 , 1392 (2010)
2010
-
[21]
J. I. Collar and S. G. Yoon, Phys. Rev. C108, L021602 (2023)
2023
-
[22]
E. B. Normanet al., Phys. Rev. C109, 055501 (2024)
2024
-
[23]
Caiet al., Phys
J. Caiet al., Phys. Rev. C113, 014331 (2026)
2026
-
[24]
R. D. Deslatteset al., Rev. Mod. Phys.75, 35 (2003)
2003
-
[25]
Bearden and A
J. Bearden and A. Burr, Rev. Mod. Phys.39, 125 (1967)
1967
-
[26]
Manduchi and G
C. Manduchi and G. Zannoni, Nucl. Phys.36, 497 (1962)
1962
-
[27]
Helmer and C
R. Helmer and C. van der Leun, Nucl. Instrum. Methods A450, 35 (2000)
2000
-
[28]
Khazov, A
Y. Khazov, A. Rodionov, and F. Kondev, Nucl. Data Sheets112, 855 (2011)
2011
-
[29]
Gatti and P
E. Gatti and P. F. Manfredi, Riv. Nuovo Cim.9N1, 1 (1986)
1986
-
[30]
Kelseyet al., Nucl
M. Kelseyet al., Nucl. Instrum. Methods A1055, 168473 (2023)
2023
-
[31]
Agostinelliet al., Nucl
S. Agostinelliet al., Nucl. Instrum. Methods A506, 250 (2003)
2003
-
[32]
Allisonet al., Nucl
J. Allisonet al., Nucl. Instrum. Methods A835, 186 (2016)
2016
-
[33]
Allisonet al., IEEE Trans
J. Allisonet al., IEEE Trans. Nucl. Sci.53, 270 (2006)
2006
-
[34]
Moffatt, R
R.Romani,P.Brink,B.Cabrera,M.Cherry,T.Howarth,N.Kurinsky, R. Moffatt, R. Partridge, F. Ponce, M. Pyle, A. Tomada, S. Yellin, J. Yen, and B. Young, Appl. Phys. Lett.112, 043501 (2018)
2018
-
[35]
Renet al., Phys
R. Renet al., Phys. Rev. D104, 032010 (2021)
2021
-
[36]
M. F. Albakryet al.(SuperCDMS Collaboration), Phys. Rev. D112, 092014 (2025)
2025
-
[37]
Kenyardet al., Nucl
K. Kenyardet al., Nucl. Instrum. Methods1091, 171753 (2026)
2026
-
[38]
M. Albakryet al.(SuperCDMS Collaboration), A Strategy for Low- Mass Dark Matter searches with Cryogenic Detectors in the Super- CDMS SNOLAB Facility, Proceedings of the US Community Study on the Future of Particle Physics (Snowmass 2021) (2023), available from:https://arxiv.org/abs/2203.08463
arXiv 2021
-
[39]
Bilger, Phys
H. Bilger, Phys. Rev.163, 238 (1967)
1967
-
[40]
R. Alig, S. Bloom, and C. Struck, Phys. Rev. B22, 5565 (1980)
1980
-
[41]
Sher and W
A. Sher and W. Keery, IEEE Trans. Nucl. Sci.17, 39 (1970). SuperCDMS Collaboration, M.F. Albakry et. al:Preprint submitted to ElsevierPage 16 of 16
1970
discussion (0)
Sign in with ORCID, Apple, or X to comment. Anyone can read and Pith papers without signing in.