REVIEW 3 major objections 6 minor 40 references
RLInspect: An Interactive Visual Approach to Assess Reinforcement Learning Algorithm
T0 review · 3 major / 6 minor · reviewed 2026-08-12 · deepseek-v4-flash
Pith's one-line read Interactive visualization of state, action, agent architecture, and reward can reveal RL training problems, such as vanishing gradients and policy divergence, that reward curves alone miss.
desk verdict Useful modular RL visualization tool, but the central confidence metric is unjustified and the evaluation is anecdotal. read the letter →
The pith
A machine-rendered reading of the paper's core claim, the machinery that carries it, and where it could break.
The reading
What carries the argument
The load-bearing object is the action-confidence identity $\text{confidence}(s) = 1 - \operatorname{entropy}(\pi(s))$, which compresses the policy distribution into a scalar expected to approach 1 as training converges. The supporting machinery includes the softmax conversion of Q-values to a policy (Eq. 3), entropy normalized by the log of the action-space size (Eq. 4), the TD(0) update (Eq. 2) used in the proof that confidence grows monotonically, Euclidean and Jaccard distances for action convergence, Jensen-Shannon divergence with natural logarithm for policy divergence, incremental PCA for state embedding, and volatility with the coefficient of variation for rewards. These computations are organized as pluggable Analyzer modules that read data through a central DataHandler and emit interactive plots, which the ReportGenerator aggregates into a single HTML report.
What would settle it
Train a tabular agent on a simple two-choice problem where both actions have identical optimal Q-values, and use softmax action selection; because softmax maps equal values to a uniform distribution, the policy entropy stays at its maximum and RLInspect's action confidence remains near zero even though the agent is performing optimally. This directly contradicts the paper's claim that confidence converges to one for a well-behaved algorithm.
Extended reading notes
Core claim
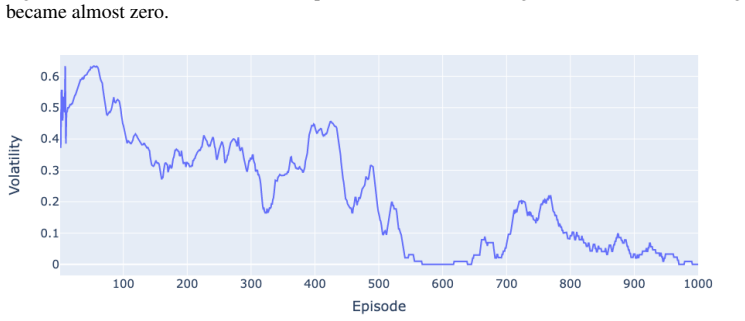
On its own terms, the paper's discovery is a tool organization: RLInspect breaks RL training into four inspectable components. The State Module projects high-dimensional states into two dimensions with incremental PCA and plots state-space coverage, exploration-versus-exploitation splits, and training-versus-non-training states. The Action Module evaluates, over a fixed set of $k$ states, the action confidence of Eq. (1), the distance between action vectors of consecutive updates (Euclidean for continuous, Jaccard for discrete actions), and the Jensen-Shannon divergence between consecutive policy distributions. The Agent Architecture Module plots weight, bias, and gradient distributions to expose problems like vanishing gradients, and the Reward Module computes volatility and the coefficient of variation after removing outliers. The paper's Cartpole case study ties the modules together: from roughly episode 650 onward confidence drops, action convergence rises, policy divergence spikes, gradients nearly vanish during episodes 666–672, and reward volatility increases, and the paper reads this alignment as evidence that the tool identifies the cause of a performance decline.
Load-bearing premise
The paper assumes that for a well-behaved RL algorithm positive rewards on optimal actions monotonically increase action values and probabilities, so policy entropy falls and action confidence converges to one; this premise fails when the best policy is randomized or has several equally good actions, and the confidence signal's interpretation depends on it.
Editorial extensions
If this is right
- Practitioners can localize a training failure to a specific episode window by aligning the action-confidence drop, policy-divergence spike, gradient collapse, and reward-volatility rise in the four module views.
- When the learning rate is constant, a sudden policy-divergence spike can be attributed to a large temporal-difference error, giving a concrete diagnostic rule based on Eq. 6.
- The paper's proof implies that monotone action confidence is a convergence indicator for tabular TD(0), Monte Carlo, TD($\lambda$), and policy iteration, so the tool can double as a convergence check for those algorithms.
- Because the Analyzer base class can be extended and data handlers customized, users can add new analyses without reworking the core I/O or report generation.
Reading between the lines
- An implication the paper leaves implicit is that action confidence is a relative health signal, not an absolute certificate: the proof's assumption of a deterministic optimal policy fails for stochastic optimal policies or multiple equally good actions, where a well-trained agent can hold entropy above zero and confidence below one.
- A testable extension would be to run RLInspect across multiple seeds on Atari or continuous-control benchmarks; if the alignment of confidence, divergence, gradient, and volatility signals reproduces across runs, the tool could serve as an early-warning system for vanishing gradients before the reward curve collapses.
- Because incremental PCA is a linear projection, the visual clusters in the state-space scatter plots may not reflect true distances in the original high-dimensional space; comparing the tool's state-space view with a nonlinear embedding such as t-SNE would show whether the apparent coverage gaps are real or artifacts of the projection.
Signed reviews
Editorial analysis
A structured set of objections, weighed in public.
Referee Report
Summary. The paper presents RLInspect, a modular interactive visual analytics tool for assessing reinforcement learning training. The tool comprises four modules—state, action, agent architecture, and reward—each offering one or more interactive Plotly-based visualizations, and it aggregates outputs into an HTML report. The authors illustrate the tool on a Cartpole training run, interpreting state-space coverage, action confidence, action convergence, policy divergence, gradient distributions, and reward volatility as diagnostic signals for training issues. The paper claims that RLInspect provides a more comprehensive view of RL training than reward alone and that users can identify and potentially correct issues. The manuscript includes no quantitative evaluation, user study, baseline comparison, or statistical validation of the claimed diagnostic insights.
Significance. If the central claim were established, RLInspect would be a useful contribution: interactive, multi-component visualization of RL training is a plausible complement to reward-curve monitoring, and the modular, extendable architecture is a sensible design choice. The paper also makes a concrete, testable assertion that specific visual patterns (e.g., confidence drops, gradient vanishing, volatility spikes) correspond to identifiable training problems. However, the evidence presented is purely anecdotal—a single Cartpole example with screenshots—and the mathematical justification for the key action-confidence metric in Section 3.3 is not valid as stated. The value of the tool therefore rests on an unproven and partly incorrect interpretation of its metrics. The modular design and the explicit attempt to connect state, action, reward, and architecture signals are strengths that could form the basis of a solid systems paper if accompanied by rigorous evaluation and a corrected or appropriately hedged theoretical discussion.
major comments (3)
- [Section 3.3, Eq. (1)-(4)] The proof that action confidence converges to 1 is not valid as stated. The argument that a positive reward and an optimal action imply the TD(0) target exceeds the current action value, and hence that Q increases monotonically, is false: Q-learning can decrease Q when the current estimate exceeds the bootstrapped target, a common situation under overestimation, and convergence of Q is not guaranteed merely by positive rewards. Furthermore, the limiting policy is not a delta distribution in general; with multiple optimal actions or a stochastic optimal policy, the softmax policy remains uniform over optimal actions, and the base-|A| entropy of Eq. (4) is nonzero, so confidence does not approach 1. Finally, the continuous case is misstated: the differential entropy of a Dirac delta is −∞, not 0, so the claimed limit confidence → 1 does not follow from the given definition. Because the Episode 650 confidence drop in Cartpole is interpreted as an identified training issue, this proof is load-bearing for the paper's central claim and needs either a corrected derivation under explicitly stated assumptions or an empirical validation that confidence has the claimed semantics.
- [Sections 3.2–3.5 and Figure 6] The paper's central claim that RLInspect enables users to 'gain insights into the model's behaviour, identify issues during training, and potentially correct them effectively' is not supported by any evaluation. The demonstration consists solely of qualitative descriptions of Cartpole screenshots; there is no user study, no quantitative accuracy of issue detection, no comparison with reward-only monitoring or with existing tools such as DRLViz, and no ablation of the individual modules. Without such evidence, it is impossible to assess whether the tool's visual patterns reliably distinguish real training problems from benign stochasticity or from artifacts of the chosen metrics. The authors should either add an evaluation study or substantially narrow the claims to a descriptive presentation of the tool's features.
- [Section 3.3, Eqs. (5)-(6)] The interpretation of policy divergence and action convergence as diagnostic signals is not justified. The proof of convergence for these metrics again invokes the unproven premise that Q_{t+1} → Q_t, which is a restatement of convergence rather than a demonstration. Moreover, the claim that a sudden spike in divergence with constant learning rate is 'due to higher error' ignores other sources of divergence, including stochasticity in the reward signal, off-policy updates, target-network changes, and the effect of the softmax denominator over non-optimal actions. Since the paper uses this reasoning to attribute the Episode 650 behavior to error, the diagnostic interpretation should be validated empirically or, at minimum, stated as a heuristic with explicit caveats.
minor comments (6)
- [Section 3.3, Eq. (1)] The definition of confidence as 1 − entropy is not normalized for arbitrary entropy definitions; the claim that confidence lies in [0,1] holds for discrete entropy with base |A|, but for the continuous case mentioned in the proof the differential entropy is unbounded, so the formula does not define a meaningful confidence value. The authors should clarify the domain of validity of Eq. (1).
- [Section 3.2, Figures 3-5] The scatter plots lack axis labels, color legends, and descriptions of how the IPCA projection axes correspond to the original state variables; adding these would make the visualizations reproducible and interpretable.
- [Section 3.5, Eq. (7)-(8)] The reward module refers to an outlier-removal threshold and to exponential moving averages without specifying their values or the method used; these parameters affect volatility and risk-reward ratios and should be reported or exposed in the interface.
- [Section 3.3] The set of k predefined states used for action-module analyses is not described: how k is chosen, how the states are sampled, and whether the results are sensitive to k are all unspecified, which limits the reproducibility of the reported Cartpole observations.
- [Section 4] The limitations section acknowledges only the absence of continuous-space action confidence and the drawbacks of IPCA, but it does not mention that the action-confidence proof fails for stochastic optimal policies or overestimation; these are conceptually more serious limitations of the tool's interpretability and should be listed.
- [Section 5] There are several typographical errors, including 'intteractive' in the conclusion and 'conincides' in Section 3.3; a careful proofread is needed.
Circularity Check
Action-confidence proof in §3.3 reduces 'confidence→1' to the assumed delta-limit of the policy, which is the same statement by Eq. (1).
-
self definitional
[Section 3.3, Action Module, 'Action confidence' proof (Eqs. 1-4)]
"For well behaved RL algorithm, the confidence of an action converges to one as the training converges. ... confidence(s) = 1− entropy(π(s)) (1) ... For the limiting case, lim_{t→∞} π_t(s) → δ(s) ... As entropy for a delta distribution is zero and given the definition of confidence in eq.1 lim_{t→∞} confidence_t(s) → 1"
Eq. (1) defines confidence as 1 − entropy(π); with Eq. (4)'s base-|A| logarithm, confidence→1 iff entropy→0 iff the policy tends to a delta distribution. The target proposition is therefore exactly 'lim π_t is delta.' The proof never derives that limit from Eq. (2); it asserts it ('For the limiting case, lim_{t→∞} π_t(s) → δ(s)') and then reads off confidence→1. The derivation reduces to the conclusion restated as an assumption. The suggested mechanism (positive reward ⇒ target exceeds Q ⇒ monotone increase ⇒ delta limit) is also not implied by TD(0): overestimation can make target < Q, and optimal stochastic or multi-action policies have non-delta softmax limits. The Episode-650 confidence-drop interpretation relies on this equivalence.
full rationale
The paper's main contribution—an interactive visual tool with state, action, reward, and architecture modules—is largely self-contained: the state scatter/IPCA, reward volatility (Eq. 7), risk-reward ratio (Eq. 8), and gradient histograms are direct data summaries with no fitted parameters and no self-citation chain. The only circular step is in the Action Module. There, 'action confidence' is defined as 1−entropy(policy), so the claimed theorem 'confidence converges to one' is equivalent by definition to 'policy converges to a delta distribution.' The proof inserts this equivalence as its limiting-case assumption rather than deriving it from TD(0); the intermediate monotonicity argument is invalid in general (bootstrapped targets can fall below current Q estimates; optimal stochastic policies are not delta). Because the paper treats the Episode 650 confidence drop in Cartpole as evidence of a training issue, this definitional reduction affects the tool's advertised 'identify issues' capability. Action convergence and policy divergence proofs are tautological but harmless: they state that if Q stops changing, then policies stop changing, which is continuity, not circularity. No self-citations are load-bearing. Scoring reflects that one central diagnostic metric's proof reduces by construction to an assumption equivalent to the claim, while the tool itself retains independent content.
Assumptions & free parameters
free parameters (2)
- k (number of predefined states in action module) =
unspecified
- outlier-removal threshold in reward module =
unspecified
assumptions (4)
- domain assumption The policy converges to a delta distribution (deterministic policy) in the limit of training.
- domain assumption TD(0) updates with positive reward and optimal action produce monotonic Q-value increases and monotonic entropy decreases.
- domain assumption The 2D incremental PCA embedding preserves the structure needed to assess state-space coverage and exploration-exploitation trade-offs.
- domain assumption Reward volatility (standard deviation) and the risk-reward ratio (coefficient of variation) are meaningful indicators of training stability and risk aversion.
Cite this review
Pith. "Pith review of RLInspect: An Interactive Visual Approach to Assess Reinforcement Learning Algorithm." pith.science (2026). https://pith.science/paper/MJ56BH5X
@misc{pith2026241108392,
  author       = {Pith},
  title        = {Pith review of: RLInspect: An Interactive Visual Approach to Assess Reinforcement Learning Algorithm},
  year         = {2026},
  howpublished = {\url{https://pith.science/paper/MJ56BH5X}},
  note         = {Machine review of arXiv:2411.08392}
}
read the original abstract
Reinforcement Learning (RL) is a rapidly growing area of machine learning that finds its application in a broad range of domains, from finance and healthcare to robotics and gaming. Compared to other machine learning techniques, RL agents learn from their own experiences using trial and error, and improve their performance over time. However, assessing RL models can be challenging, which makes it difficult to interpret their behaviour. While reward is a widely used metric to evaluate RL models, it may not always provide an accurate measure of training performance. In some cases, the reward may seem increasing while the model's performance is actually decreasing, leading to misleading conclusions about the effectiveness of the training. To overcome this limitation, we have developed RLInspect - an interactive visual analytic tool, that takes into account different components of the RL model - state, action, agent architecture and reward, and provides a more comprehensive view of the RL training. By using RLInspect, users can gain insights into the model's behaviour, identify issues during training, and potentially correct them effectively, leading to a more robust and reliable RL system.
Figures


Figures from the paper (5 more)


Reference graph
Works this paper leans on
-
[1]
Deep learning.Nature, 521(7553):436–444, May 2015
Yann LeCun, Yoshua Bengio, and Geoffrey Hinton. Deep learning.Nature, 521(7553):436–444, May 2015
2015
-
[2]
A critical analysis of metrics used for measuring progress in artificial intelligence, 2021
Kathrin Blagec, Georg Dorffner, Milad Moradi, and Matthias Samwald. A critical analysis of metrics used for measuring progress in artificial intelligence, 2021
work page 2021
-
[3]
Evaluating the quality of machine learning explanations: A survey on methods and metrics
Jianlong Zhou, Amir H Gandomi, Fang Chen, and Andreas Holzinger. Evaluating the quality of machine learning explanations: A survey on methods and metrics. Electronics, 10(5), 2021
work page 2021
-
[4]
Kanit Wongsuphasawat, Daniel Smilkov, James Wexler, Jimbo Wilson, Dandelion Mane, Doug Fritz, Dilip Krishnan, Fernanda B. Viegas, and Martin Wattenberg. Visualizing dataflow graphs of deep learning models in tensorflow. IEEE Transactions on Visualization and Computer Graphics, 24(1):1–12, 2018. doi: 10.1109/tvcg.2017.2744878
arXiv 2018
-
[5]
Vega-lite: A grammar of interactive graphics
Arvind Satyanarayan, Dominik Moritz, Kanit Wongsuphasawat, and Jeffrey Heer. Vega-lite: A grammar of interactive graphics. IEEE Transactions on Visualization and Computer Graphics, 23(1):341–350, 2017. doi: 10.1109/TVCG.2016.2599030
arXiv 2017
-
[6]
Activis: Visual exploration of industry-scale deep neural network models
Minsuk Kahng, Pierre Y Andrews, Aditya Kalro, and Duen Horng Chau. Activis: Visual exploration of industry-scale deep neural network models. IEEE transactions on visualization and computer graphics, 24(1):88–97, 2017
work page 2017
-
[7]
Interacting with predictions: Visual inspection of black-box machine learning models
Josua Krause, Adam Perer, and Kenney Ng. Interacting with predictions: Visual inspection of black-box machine learning models. In Proceedings of the 2016 CHI Conference on Human Factors in Computing Systems, CHI ’16, page 5686–5697, New York, NY , USA, 2016. Association for Computing Machinery. ISBN 9781450333627. doi: 10.1145/2858036.2858529. URL https:/...
arXiv 2016
-
[8]
Understanding neural networks through deep visualization
Jason Yosinski, Jeff Clune, Anh Nguyen, Thomas Fuchs, and Hod Lipson. Understanding neural networks through deep visualization. arXiv preprint arXiv:1506.06579, 2015. 9
arXiv 2015
Show all 40 references
-
[9]
Machine learning-based approach: global trends, research directions, and regulatory standpoints
Raffaele Pugliese, Stefano Regondi, and Riccardo Marini. Machine learning-based approach: global trends, research directions, and regulatory standpoints. Data Science and Management, 4:19–29, 2021. ISSN 2666-7649. doi: https://doi.org/10.1016/j.dsm.2021.12.002. URL https://www...
2021 doi
-
[10]
Reinforcement learning applications
Yuxi Li. Reinforcement learning applications. arXiv preprint arXiv:1908.06973, 2019
1908 arXiv
-
[11]
Illustrat- ing reinforcement learning from human feedback (rlhf)
Nathan Lambert, Louis Castricato, Leandro von Werra, and Alex Havrilla. Illustrat- ing reinforcement learning from human feedback (rlhf). Hugging Face Blog , 2022. https://huggingface.co/blog/rlhf
2022
-
[12]
Summary of chatgpt/gpt-4 research and perspective towards the future of large language models
Yiheng Liu, Tianle Han, Siyuan Ma, Jiayue Zhang, Yuanyuan Yang, Jiaming Tian, Hao He, Antong Li, Mengshen He, Zhengliang Liu, et al. Summary of chatgpt/gpt-4 research and perspective towards the future of large language models. arXiv preprint arXiv:2304.01852, 2023
2023 arXiv
-
[13]
Parkes, and Richard Socher
Stephan Zheng, Alexander Trott, Sunil Srinivasa, David C. Parkes, and Richard Socher. The ai economist: Taxation policy design via two-level deep multiagent reinforcement learning. Science Advances, 8(18), 2022. doi: 10.1126/sciadv.abk2607
2022 doi
-
[14]
Reinforcement learning in macroeconomic policy design: A new frontier? arXiv preprint arXiv:2206.08781, 2022
Callum Tilbury. Reinforcement learning in macroeconomic policy design: A new frontier? arXiv preprint arXiv:2206.08781, 2022
2022 arXiv
-
[15]
Deep reinforcement learning approaches for global public health strategies for covid-19 pandemic
Gloria Hyunjung Kwak, Lowell Ling, and Pan Hui. Deep reinforcement learning approaches for global public health strategies for covid-19 pandemic. PLOS ONE, 16(5), 2021. doi: 10.1371/journal.pone.0251550
2021 doi
-
[16]
Optimising lockdown policies for epidemic control using reinforcement learning: An ai-driven control approach compatible with existing disease and network models
Harshad Khadilkar, Tanuja Ganu, and Deva P Seetharam. Optimising lockdown policies for epidemic control using reinforcement learning: An ai-driven control approach compatible with existing disease and network models. Transactions of the Indian National Academy of Engineering, ...
2020
-
[17]
Recent advances in reinforcement learning in finance
Ben Hambly, Renyuan Xu, and Huining Yang. Recent advances in reinforcement learning in finance. arXiv preprint arXiv:2112.04553, 2021
2021 arXiv
-
[18]
Reinforcement learning for clinical decision support in critical care: Comprehensive review
Siqi Liu, Kay Choong See, Kee Yuan Ngiam, Leo Anthony Celi, Xingzhi Sun, and Mengling Feng. Reinforcement learning for clinical decision support in critical care: Comprehensive review. Journal of Medical Internet Research, 22(7), 2020. doi: 10.2196/18477
2020 doi
-
[19]
The loca regret: A consistent metric to evaluate model-based behavior in reinforcement learning
Harm Van Seijen, Hadi Nekoei, Evan Racah, and Sarath Chandar. The loca regret: A consistent metric to evaluate model-based behavior in reinforcement learning. In H. Larochelle, M. Ranzato, R. Hadsell, M.F. Balcan, and H. Lin, editors, Advances in Neural Information Processing ...
2020
-
[20]
Evaluating the performance of reinforcement learning algorithms
Scott Jordan, Yash Chandak, Daniel Cohen, Mengxue Zhang, and Philip Thomas. Evaluating the performance of reinforcement learning algorithms. In International Conference on Machine Learning, pages 4962–4973. PMLR, 2020
2020
-
[21]
Edward R. Tufte. The visual display of quantitative information. Graphics Press, 2018
2018
-
[22]
Ji Soo Yi, Youn ah Kang, John Stasko, and J.A. Jacko. Toward a deeper understanding of the role of interaction in information visualization. IEEE Transactions on Visualization and Computer Graphics, 13(6):1224–1231, 2007. doi: 10.1109/TVCG.2007.70515
2007
-
[23]
Challenges in the verification of reinforcement learning algorithms
Perry van Wesel and Alwyn Goodloe. Challenges in the verification of reinforcement learning algorithms. 2017
2017
-
[24]
Trans- parency and explanation in deep reinforcement learning neural networks
Rahul Iyer, Yuezhang Li, Huao Li, Michael Lewis, Ramitha Sundar, and Katia Sycara. Trans- parency and explanation in deep reinforcement learning neural networks. In Proceedings of the 2018 AAAI/ACM Conference on AI, Ethics, and Society , AIES ’18, page 144–150, New York, NY , ...
2018
-
[25]
Stephanie C. Y . Chan, Samuel Fishman, John Canny, Anoop Korattikara, and Sergio Guadarrama. Measuring the reliability of reinforcement learning algorithms, 2020
2020
-
[26]
Interestingness elements for explainable reinforce- ment learning: Understanding agents' capabilities and limitations
Pedro Sequeira and Melinda Gervasio. Interestingness elements for explainable reinforce- ment learning: Understanding agents' capabilities and limitations. Artificial Intelligence, 288: 103367, nov 2020. doi: 10.1016/j.artint.2020.103367. URL https://doi.org/10.1016% 2Fj.artin...
2020
-
[27]
Explaining online reinforcement learning decisions of self-adaptive systems
Felix Feit, Andreas Metzger, and Klaus Pohl. Explaining online reinforcement learning decisions of self-adaptive systems. In 2022 IEEE International Conference on Autonomic Computing and Self-Organizing Systems (ACSOS), pages 51–60. IEEE, 2022
2022
-
[28]
Dietterich, Rachel Houtman, Claire Mont- gomery, and Ronald Metoyer
Sean McGregor, Hailey Buckingham, Thomas G. Dietterich, Rachel Houtman, Claire Mont- gomery, and Ronald Metoyer. Interactive visualization for testing markov decision processes: Mdpvis. Journal of Visual Languages & Computing , 39:93–106, 2017. ISSN 1045-926X. doi: https://doi...
2017 doi
-
[29]
Dqnviz: A visual analytics approach to understand deep q-networks
Junpeng Wang, Liang Gou, Han-Wei Shen, and Hao Yang. Dqnviz: A visual analytics approach to understand deep q-networks. IEEE Transactions on Visualization and Computer Graphics, 25(1):288–298, 2019. doi: 10.1109/TVCG.2018.2864504
2019
-
[30]
Drlviz: Understanding decisions and memory in deep reinforcement learning
Theo Jaunet, Romain Vuillemot, and Christian Wolf. Drlviz: Understanding decisions and memory in deep reinforcement learning. In Computer Graphics Forum, volume 39, pages 49–61. Wiley Online Library, 2020
2020
-
[31]
Collaborative data science, 2015
Plotly Technologies Inc. Collaborative data science, 2015. URL https://plot.ly
2015
-
[32]
Openai gym, 2016
Greg Brockman, Vicki Cheung, Ludwig Pettersson, Jonas Schneider, John Schulman, Jie Tang, and Wojciech Zaremba. Openai gym, 2016
2016
-
[33]
Ross, Jongwoo Lim, Ruei-Sung Lin, and Ming-Hsuan Yang
David A. Ross, Jongwoo Lim, Ruei-Sung Lin, and Ming-Hsuan Yang. Incremental learn- ing for robust visual tracking. International Journal of Computer Vision , 77(1-3):125– 141, August 2007. doi: 10.1007/s11263-007-0075-7. URL https://doi.org/10.1007/ s11263-007-0075-7
2007 doi
-
[34]
J. Lin. Divergence measures based on the shannon entropy. IEEE Transactions on Information Theory, 37(1):145–151, 1991. doi: 10.1109/18.61115
1991 doi
-
[35]
Understanding the difficulty of training deep feedforward neural networks
Xavier Glorot and Yoshua Bengio. Understanding the difficulty of training deep feedforward neural networks. In International Conference on Artificial Intelligence and Statistics, 2010
2010
-
[36]
Visualizing distortions and recovering topology in continuous projection techniques
Michaël Aupetit. Visualizing distortions and recovering topology in continuous projection techniques. Neurocomputing, 70(7-9):1304–1330, 2007
2007
-
[37]
Heulot, M
N. Heulot, M. Aupetit, and J-D. Fekete. ProxiLens: Interactive Exploration of High-Dimensional Data using Projections. In M. Aupetit and L. van der Maaten, editors, EuroVis Workshop on Visual Analytics using Multidimensional Projections . The Eurographics Association, 2013. IS...
2013 doi
-
[38]
A multidimensional brush for scatterplot data analytics
Michael Aupetit, Nicolas Heulot, and Jean-Daniel Fekete. A multidimensional brush for scatterplot data analytics. In 2014 IEEE Conference on Visual Analytics Science and Technology (VAST), pages 221–222, 2014. doi: 10.1109/V AST.2014.7042500
2014
-
[39]
A. Mead. Review of the Development of Multidimensional Scaling Methods. Journal of the Royal Statistical Society Series D: The Statistician, 41(1):27–39, 12 2018. ISSN 2515-7884. doi: 10.2307/2348634. URL https://doi.org/10.2307/2348634
2018 doi
-
[40]
Visualizing data using t-sne
Laurens van der Maaten and Geoffrey Hinton. Visualizing data using t-sne. Journal of Machine Learning Research, 9(86):2579–2605, 2008. URL http://jmlr.org/papers/v9/ vandermaaten08a.html. 11
2008
Reviewed August 12, 2026 · model on record in the stance chip above.
Discussion (0). Continue with ORCID to comment.