REVIEW 3 major objections 5 minor 50 references
Saliency Methods are Encoders: Analysing Logical Relations Towards Interpretation
T0 review · 3 major / 5 minor · reviewed 2026-08-11 · deepseek-v4-flash
Pith's one-line read Saliency methods can encode classification-relevant information into the ordering of their scores, beyond the intended relevance signal.
desk verdict A solid controlled benchmark (ANDOR) with clear descriptive findings, but the 'encoding into the ordering' claim needs a random-mask control before it is fully convincing. read the letter →
The pith
A machine-rendered reading of the paper's core claim, the machinery that carries it, and where it could break.
The reading
What carries the argument
The machinery is the ANDOR dataset framework: four blocks of propositional gates, AND, OR, XOR, plus a baseline block of explicitly irrelevant inputs, layered under a top-level gate and fully enumerated so that the set of all possible model reasoning paths is known. From this, the paper defines the minimal information coverage R_min, the smallest sets of inputs that logically determine the output, and a non-informative baseline, the baseline block that should never outscore a relevant input. On top sit two metrics: NIB, the percentage of samples where a minimal relevant input scores below the highest baseline input, and DCA, which checks whether masked samples with identical relevant inputs map to different classes in a retrained model. The baseline and the minimal-coverage comparison are the load-bearing objects: they turn 'does a saliency map explain the model?' into a concrete ordering test.
What would settle it
Train a model on the same ANDOR data to 100% accuracy using a deliberately non-logical decision rule, such as a linear threshold over a non-minimal weighted combination of inputs, then apply a provably faithful saliency method like exact input gradients of that rule. If NIB greater than zero or DCA greater than zero still appears, then the metrics are detecting the mismatch between the assumed logical ground truth and the model's actual rule, not an encoding carried by the saliency method; if NIB and DCA are zero, the paper's interpretation is supported.
Extended reading notes
Core claim
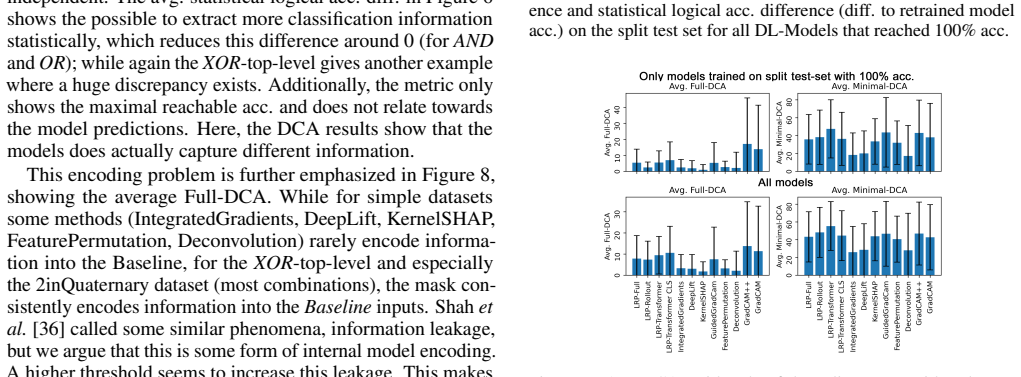
On the paper's terms, the central discovery is that saliency methods can encode classification-relevant information into the ordering of their scores, beyond the intended relevance signal. Across 144 experiment settings with CNN and transformer models on the ANDOR datasets, every one of the twelve methods showed a positive NIB, meaning at least one logically minimal relevant input scored below the highest baseline input, and retrained models consistently achieved higher accuracy than the logical accuracy of the masked data. The DCA metrics show that identical relevant inputs can map to different classes depending on masked baseline inputs, with the effect growing on the most complex setting, the quaternary-input XOR-top-level, and with higher masking thresholds. The paper interprets this not as an input-sensitivity failure along the lines of prior sanity checks, but as a systematic encoding of information into the score order.
Load-bearing premise
The load-bearing premise is that a model reaching 100% accuracy on the fully enumerated ANDOR dataset has understood the task completely, so its local decisions must correspond to one of the logical minimal sets R_min; if the network uses a non-logical decision rule, or the masking procedure itself introduces statistical cues, then NIB and DCA measure the mismatch between the ground-truth definition and the model's actual behaviour rather than a defect in the saliency methods.
Editorial extensions
If this is right
- If saliency scores encode class information in their ordering, then evaluating a saliency method by whether high-scored regions are plausible is not enough: the same score map can appear misleading while its full ordering carries a usable signal.
- Retraining on masked inputs cannot by itself certify a saliency method, because the mask can leak the very information the explanation claims to remove.
- The ANDOR framework provides a cheap, exhaustive trust test for new saliency methods: a method that keeps NIB at zero and DCA at zero on these nine datasets has demonstrated the basic property of keeping minimal relevant inputs above an irrelevant baseline.
- The encoding effect intensifies with task complexity inside the controlled setting, suggesting that failures seen in simple logic can appear in more realistic tasks that contain redundant, complementary, or exclusive information.
Reading between the lines
- An extension the paper leaves implicit: the same test run with a provably faithful attribution method, for example exact gradients of a hand-written decision rule, would separate 'the saliency method encodes' from 'the model encodes'.
- The encoding result suggests a reinterpretation of saliency maps as lossy codes, where class information may live in rank statistics rather than pointwise scores; a decoding-based evaluation could test this directly.
- Because the paper only treats binary outputs, an obvious testable extension is a multi-class or continuous-output ANDOR variant to see whether the encoding effect is an artifact of binary classification.
- The paper leaves the cause of encoding open; one concrete experiment is to ablate internal aggregation steps of a method, for example layer-wise combination in LRP or attention rollout, and measure whether DCA drops when less information is aggregated.
Editorial analysis
A structured set of objections, weighed in public.
Referee Report
Summary. This paper proposes a controlled benchmark, ANDOR, for evaluating saliency methods on small propositional-logic classification tasks (AND, OR, XOR top levels over stacks of gates plus a non-informative baseline block). The authors train CNNs and transformers on fully enumerated, class-balanced versions of these datasets, keep only models that reach 100% accuracy on a split test set, and then evaluate twelve saliency methods under four LeRF masking thresholds using five metrics, including Needed Information below Baseline (NIB) and Full/Minimal Double Class Assignments (DCA). The central empirical claim is that all tested saliency methods often place logically minimal relevant inputs below the baseline block (NIB > 0) and that, after masking and retraining, logically equivalent relevant-input configurations can be assigned different classes (DCA > 0), from which the authors conclude that saliency methods encode classification-relevant information into the ordering of saliency scores rather than merely reporting relevance. The paper includes a detailed assumption list, a large-scale experiment (33,600 trained models), and a public code repository.
Significance. The benchmark design is a genuine strength: fully enumerated logical datasets, balanced training sets, a 100%-accuracy filter, twelve saliency methods, two architectures, and multiple thresholds constitute a carefully constructed testbed, and the reported code and experiment counts make the study reproducible. If the conclusions were fully supported, the paper would provide a useful cautionary result for the interpretability community. However, the headline claim depends on two load-bearing premises that are not independently verified: first, that a 100%-accurate model on a fully enumerated deterministic dataset must reason according to one of the logically defined minimal sets R_min (Section 3.4), and second, that the DCA metric measures encoding in saliency-score ordering rather than information leakage through the input-dependent mask pattern itself. The authors explicitly label the relevant items as assumptions and cite mask-leakage work, which is honest, but the empirical evidence does not yet eliminate the mask side-channel explanation.
major comments (3)
- [Section 3.8, metric (4) (Full-DCA); Section 5] The Full-DCA evidence for the headline claim is confounded by input-dependent mask patterns. Since LeRF masks are computed from saliency scores, which depend on the full input, two test samples with identical logically relevant inputs can receive different masked patterns, and a retrained model can use those patterns as class-discriminative cues. The paper acknowledges that information can leak into masks (Section 2 and Section 5, citing [32]), but it reports no control such as random masks, fixed masks, or oracle masks matched on retained-input fraction. Consequently, DCA > 0 could be produced by mask-pattern side channels rather than by the saliency score ordering encoding classification information. A control condition that decorrelates mask patterns from class while preserving masking statistics is necessary before the 'encoding into the ordering' interpretation is supported.
- [Section 3.4 and Assumption E] The NIB metric relies on the premise that a model reaching 100% accuracy on a fully enumerated ANDOR dataset has 'understood the task completely' and that its local reasoning must correspond to one of the logical R_min sets. On a deterministic, fully enumerated dataset, many non-logical decision rules (for example, a linear readout that uses all gate inputs, or shortcuts based on input statistics) also achieve 100% accuracy. Thus NIB > 0 may measure a mismatch between the logical ground truth and the model's actual decision rule rather than a defect of the saliency method. The assumptions are stated transparently, but the abstract's causal reading ('saliency methods can encode...') requires stronger evidence about the model's decision rule. I recommend adding an independent probe of the trained models' decision rule, e.g., exhaustive single-input and pair-input ablations to derive per-model R_min, and reporting NIB against those model-specific sets.
- [Section 3.8, metric (4) (Full-DCA) definition] The definition of Full-DCA as 'the count where the relevant inputs {{d1, . . . , dl−NrB} ⊆ d | d ∈ D} map towards different classes in the retrained model' is underspecified: it does not state which samples are grouped, what the set-builder notation denotes, or how a 'mapping towards different classes' is counted. Since Full-DCA is one of the two central quantitative supports for the paper's main conclusion, this metric should be defined formally (e.g., partition the test set by the values of the logically relevant inputs, and count groups in which the retrained model's predictions are not constant), with the exact formula used in the code stated in the text.
minor comments (5)
- [Section 3.1] The union notation in constraints (1) and (2), e.g. 'S dj∈d f D(d,j)', is not typeset correctly and should be written with a proper union symbol and with the domain of f_D stated unambiguously.
- [Section 3.3 and Figure 1 caption] The dataset sizes in the caption of Figure 1 ('28 = 256', '48 = 65.536', '212 = 4.096') use a comma as a decimal separator and lack superscripts; they should read 2^8 = 256, 4^8 = 65,536, and 2^12 = 4,096.
- [Section 3.8, metric (2)] The logical accuracy metric says 'combinations of undefined inputs result in undefined,' but the text never states how 'undefined' is counted in the reported accuracy; please specify the treatment of undefined outputs in the numerator and denominator of the accuracy calculation.
- [Section 3.7] The description of the masking thresholds should be unified: the text mentions 'one of four thresholds,' then lists a Baseline-based threshold and factors t1.0, t0.8, t0.5; please state explicitly how the Baseline threshold is combined with the factor thresholds and whether all four are used in every experiment.
- [Section 4.3] The sentence 'Shah et al. [36] called some similar phenomena, information leakage, but we argue that this is some form of internal model encoding' asserts the conclusion rather than arguing it; given the mask-side-channel concern, this overstates what the experiments can currently distinguish.
Circularity Check
No circular derivation: the metrics are anchored to external logical ground truth, and the headline claim is an empirical interpretation rather than an input-equivalent construction.
full rationale
The paper's central claim is supported by empirical metrics (NIB, logical accuracy, Full-DCA, Minimal-DCA) computed against externally specified logical truth tables (Section 3.4), not by fitting parameters to the conclusion. The key premise that a 100%-accurate model must follow one of the logical reasonings R_min is explicitly stated as an assumption (Sections 1 and 3.4), and the DCA metric's label 'decision relevant information is in the Baseline inputs' is an operational interpretation of the counted pattern, not a separately derived theorem; the count itself is an external measurement. The acknowledged mask-leakage confound (Assumption D, cf. [32]) weakens the causal interpretation of DCA but does not make the derivation circular, because no conclusion is assumed in the metric definition and no fitted value is renamed as a prediction. No load-bearing self-citation or imported uniqueness theorem is invoked. The only definitional component is the choice of Assumptions A and E as the standard for 'encoding'; since the paper flags these as assumptions rather than consequences, this does not constitute circular reasoning.
Assumptions & free parameters
free parameters (2)
- Masking threshold factors =
0.5, 0.8, 1.0 and baseline max score
- Per-dataset hyperparameters =
not reported in text
assumptions (5)
- domain assumption Assumption A: an input with higher saliency score is more relevant; lower score means less, no, or contradicting information.
- domain assumption Assumption E: baseline inputs must not outrank any minimally relevant input.
- domain assumption A model with 100% accuracy on fully enumerated ANDOR has understood the task and its reasoning matches some r in R_min.
- domain assumption Masking does not introduce class-relevant statistical information beyond what the logical truth tables predict.
- domain assumption The hidden information function f_D exists and constraints (1)-(2) characterize all valid ways to derive a class.
invented entities (1)
-
Hidden information function f_D
Cite this review
Pith. "Pith review of Saliency Methods are Encoders: Analysing Logical Relations Towards Interpretation." pith.science (2026). https://pith.science/paper/NI4K3KWL
@misc{pith2026241216204,
  author       = {Pith},
  title        = {Pith review of: Saliency Methods are Encoders: Analysing Logical Relations Towards Interpretation},
  year         = {2026},
  howpublished = {\url{https://pith.science/paper/NI4K3KWL}},
  note         = {Machine review of arXiv:2412.16204}
}
read the original abstract
With their increase in performance, neural network architectures also become more complex, necessitating explainability. Therefore, many new and improved methods are currently emerging, which often generate so-called saliency maps in order to improve interpretability. Those methods are often evaluated by visual expectations, yet this typically leads towards a confirmation bias. Due to a lack of a general metric for explanation quality, non-accessible ground truth data about the model's reasoning and the large amount of involved assumptions, multiple works claim to find flaws in those methods. However, this often leads to unfair comparison metrics. Additionally, the complexity of most datasets (mostly images or text) is often so high, that approximating all possible explanations is not feasible. For those reasons, this paper introduces a test for saliency map evaluation: proposing controlled experiments based on all possible model reasonings over multiple simple logical datasets. Using the contained logical relationships, we aim to understand how different saliency methods treat information in different class discriminative scenarios (e.g. via complementary and redundant information). By introducing multiple new metrics, we analyse propositional logical patterns towards a non-informative attribution score baseline to find deviations of typical expectations. Our results show that saliency methods can encode classification relevant information into the ordering of saliency scores.
Figures


Figures from the paper (32 more)




Reference graph
Works this paper leans on
-
[32]
A consistent and efficient evaluation strategy for attribution methods
Yao Rong, Tobias Leemann, Vadim Borisov, Gjergji Kasneci, and Enkelejda Kasneci. A consistent and efficient evaluation strategy for attribution methods. arXiv preprint arXiv:2202.00449, 2022
arXiv 2022
-
[1]
Quantifying attention flow in transformers
Samira Abnar and Willem Zuidema. Quantifying attention flow in transformers. arXiv preprint arXiv:2005.00928 , 2020
arXiv 2005
-
[2]
Sanity checks for saliency maps
Julius Adebayo, Justin Gilmer, Michael Muelly, Ian Good- fellow, Moritz Hardt, and Been Kim. Sanity checks for saliency maps. Advances in neural information processing systems, 31, 2018
work page 2018
-
[3]
On pixel-wise explanations for non-linear classifier decisions by layer-wise relevance propagation
Sebastian Bach, Alexander Binder, Grégoire Montavon, Frederick Klauschen, Klaus-Robert Müller, and Wojciech Samek. On pixel-wise explanations for non-linear classifier decisions by layer-wise relevance propagation. PloS one, 10(7):e0130140, 2015
2015
-
[4]
Random forests
Leo Breiman. Random forests. Machine learning, 45:5– 32, 2001
2001
-
[5]
Machine learning interpretability: A survey on meth- ods and metrics
Diogo V Carvalho, Eduardo M Pereira, and Jaime S Car- doso. Machine learning interpretability: A survey on meth- ods and metrics. Electronics, 8(8):832, 2019
work page 2019
-
[6]
Grad-cam++: Gener- alized gradient-based visual explanations for deep convo- lutional networks
Aditya Chattopadhay, Anirban Sarkar, Prantik Howlader, and Vineeth N Balasubramanian. Grad-cam++: Gener- alized gradient-based visual explanations for deep convo- lutional networks. In 2018 IEEE winter conference on applications of computer vision (WACV), pages 839–847. IEEE, 2018
work page 2018
-
[7]
Transformer inter- pretability beyond attention visualization
Hila Chefer, Shir Gur, and Lior Wolf. Transformer inter- pretability beyond attention visualization. In Proceedings of the IEEE/CVF conference on computer vision and pat- tern recognition, pages 782–791, 2021
work page 2021
Show all 50 references
-
[8]
Robust physical-world attacks on deep learning visual classification
Kevin Eykholt, Ivan Evtimov, Earlence Fernandes, Bo Li, Amir Rahmati, Chaowei Xiao, Atul Prakash, Tadayoshi Kohno, and Dawn Song. Robust physical-world attacks on deep learning visual classification. In Proceedings of the IEEE conference on computer vision and pattern recogni-...
2018
-
[9]
Revisit fuzzy neural network: bridging the gap between fuzzy logic and deep learning
Lixin Fan. Revisit fuzzy neural network: bridging the gap between fuzzy logic and deep learning. Technical report, Technical Report, 2017
2017
-
[10]
Shapley values for feature selection: The good, the bad, and the axioms
Daniel Fryer, Inga Strümke, and Hien Nguyen. Shapley values for feature selection: The good, the bad, and the axioms. Ieee Access, 9:144352–144360, 2021
2021
-
[11]
Neural- symbolic learning and reasoning: A survey and interpreta- tion
Artur d’Avila Garcez, Sebastian Bader, Howard Bow- man, Luis C Lamb, Leo de Penning, BV Illuminoo, Hoifung Poon, and COPPE Gerson Zaverucha. Neural- symbolic learning and reasoning: A survey and interpreta- tion. Neuro-Symbolic Artificial Intelligence: The State of the Art, 34...
2022
-
[12]
Pytorch library for cam methods
Jacob Gildenblat and contributors. Pytorch library for cam methods. https://github.com/jacobgil/ pytorch-grad-cam, 2021
2021
-
[13]
Joint shapley values: a measure of joint feature importance
Chris Harris, Richard Pymar, and Colin Rowat. Joint shapley values: a measure of joint feature importance. arXiv preprint arXiv:2107.11357, 2021
2021 arXiv
-
[14]
On baselines for local feature attributions
Johannes Haug, Stefan Zürn, Peter El-Jiz, and Gjergji Kasneci. On baselines for local feature attributions. arXiv preprint arXiv:2101.00905, 2021
2021 arXiv
-
[15]
Deep residual learning for image recognition
Kaiming He, Xiangyu Zhang, Shaoqing Ren, and Jian Sun. Deep residual learning for image recognition. In Proceedings of the IEEE conference on computer vision and pattern recognition, pages 770–778, 2016
2016
-
[16]
A benchmark for interpretability methods in deep neural networks
Sara Hooker, Dumitru Erhan, Pieter-Jan Kindermans, and Been Kim. A benchmark for interpretability methods in deep neural networks. Advances in neural information processing systems, 32, 2019
2019
-
[17]
Unre- stricted permutation forces extrapolation: variable impor- tance requires at least one more model, or there is no free variable importance
Giles Hooker, Lucas Mentch, and Siyu Zhou. Unre- stricted permutation forces extrapolation: variable impor- tance requires at least one more model, or there is no free variable importance. Statistics and Computing, 31:1–16, 2021
2021
-
[18]
Towards faithfully inter- pretable nlp systems: How should we define and evaluate faithfulness? arXiv preprint arXiv:2004.03685, 2020
Alon Jacovi and Yoav Goldberg. Towards faithfully inter- pretable nlp systems: How should we define and evaluate faithfulness? arXiv preprint arXiv:2004.03685, 2020
2004 arXiv
-
[19]
Logic traps in evaluating attribu- tion scores
Yiming Ju, Yuanzhe Zhang, Zhao Yang, Zhongtao Jiang, Kang Liu, and Jun Zhao. Logic traps in evaluating attribu- tion scores. arXiv preprint arXiv:2109.05463, 2021
2021 arXiv
-
[20]
The (un) reliability of saliency methods
Pieter-Jan Kindermans, Sara Hooker, Julius Adebayo, Maximilian Alber, Kristof T Schütt, Sven Dähne, Dumitru Erhan, and Been Kim. The (un) reliability of saliency methods. Explainable AI: Interpreting, explaining and visualizing deep learning, pages 267–280, 2019
2019
-
[21]
Captum: A unified and generic model interpretability li- brary for pytorch
Narine Kokhlikyan, Vivek Miglani, Miguel Martin, Ed- ward Wang, Bilal Alsallakh, Jonathan Reynolds, Alexander Melnikov, Natalia Kliushkina, Carlos Araya, Siqi Yan, et al. Captum: A unified and generic model interpretability li- brary for pytorch. arXiv preprint arXiv:2009.07896, 2020
2009 arXiv
-
[22]
Investi- gating sanity checks for saliency maps with image and text classification
Narine Kokhlikyan, Vivek Miglani, Bilal Alsallakh, Miguel Martin, and Orion Reblitz-Richardson. Investi- gating sanity checks for saliency maps with image and text classification. arXiv preprint arXiv:2106.07475, 2021
2021 arXiv
-
[23]
Shapley residuals: Quantifying the limits of the shapley value for explana- tions
Indra Kumar, Carlos Scheidegger, Suresh Venkata- subramanian, and Sorelle Friedler. Shapley residuals: Quantifying the limits of the shapley value for explana- tions. Advances in Neural Information Processing Systems, 34:26598–26608, 2021
2021
-
[24]
Unmasking clever hans predictors and as- sessing what machines really learn
Sebastian Lapuschkin, Stephan Wäldchen, Alexander Binder, Grégoire Montavon, Wojciech Samek, and Klaus- Robert Müller. Unmasking clever hans predictors and as- sessing what machines really learn. Nature communica- tions, 10(1):1096, 2019
2019
-
[25]
Guillaume Lemaître, Fernando Nogueira, and Christos K. Aridas. Imbalanced-learn: A python toolbox to tackle the curse of imbalanced datasets in machine learning. Journal of Machine Learning Research, 18(17):1–5, 2017
2017
-
[26]
An experimental study of quantitative evaluations on saliency methods
Xiao-Hui Li, Yuhan Shi, Haoyang Li, Wei Bai, Caleb Chen Cao, and Lei Chen. An experimental study of quantitative evaluations on saliency methods. In Pro- ceedings of the 27th ACM sigkdd conference on knowledge discovery & data mining, pages 3200–3208, 2021
2021
-
[27]
A unified approach to interpreting model predictions
Scott M Lundberg and Su-In Lee. A unified approach to interpreting model predictions. Advances in neural infor- mation processing systems, 30, 2017
2017
-
[28]
Logic-based explainability in ma- chine learning
Joao Marques-Silva. Logic-based explainability in ma- chine learning. In Reasoning Web. Causality, Explanations and Declarative Knowledge: 18th International Summer School 2022, Berlin, Germany, September 27–30, 2022, Tutorial Lectures, pages 24–104. Springer, 2023
2022
-
[29]
Interpretable machine learning
Christoph Molnar. Interpretable machine learning. Lulu. com, 2020
2020
-
[30]
Meaningful explanations of black box ai decision systems
Dino Pedreschi, Fosca Giannotti, Riccardo Guidotti, Anna Monreale, Salvatore Ruggieri, and Franco Turini. Meaningful explanations of black box ai decision systems. In Proceedings of the AAAI conference on artificial intelli- gence, volume 33, pages 9780–9784, 2019
2019
-
[31]
Explainable artificial intelligence (xai) on timeseries data: A survey
Thomas Rojat, R Puget, D Filliat, J Del Ser, R Gelin, and N Díaz-Rodríguez. Explainable artificial intelligence (xai) on timeseries data: A survey. arxiv 2021. arXiv preprint arXiv:2104.00950, 2021
2021 arXiv
-
[33]
Evaluating feature attribution: An information-theoretic perspective
Yao Rong, Tobias Leemann, Vadim Borisov, Gjergji Kas- neci, and Enkelejda Kasneci. Evaluating feature attribution: An information-theoretic perspective. CoRR, 2022
2022
-
[34]
Learning interpretable models
Stefan Rüping. Learning interpretable models. Ph.D. Thesis, University of Dortmund, 2006
2006
-
[35]
Grad-cam: Visual explanations from deep networks via gradient-based localization
Ramprasaath R Selvaraju, Michael Cogswell, Abhishek Das, Ramakrishna Vedantam, Devi Parikh, and Dhruv Ba- tra. Grad-cam: Visual explanations from deep networks via gradient-based localization. In Proceedings of the IEEE in- ternational conference on computer vision, pages 618–...
2017
-
[36]
Do input gradients highlight discriminative features? Advances in Neural Information Processing Systems, 34:2046–2059, 2021
Harshay Shah, Prateek Jain, and Praneeth Netrapalli. Do input gradients highlight discriminative features? Advances in Neural Information Processing Systems, 34:2046–2059, 2021
2021
-
[37]
Learning important features through propagating acti- vation differences
Avanti Shrikumar, Peyton Greenside, and Anshul Kun- daje. Learning important features through propagating acti- vation differences. In International conference on machine learning, pages 3145–3153. PMLR, 2017
2017
-
[38]
When explanations lie: Why many modified bp attributions fail
Leon Sixt, Maximilian Granz, and Tim Landgraf. When explanations lie: Why many modified bp attributions fail. In International conference on machine learning , pages 9046–9057. PMLR, 2020
2020
-
[39]
Fooling lime and shap: Ad- versarial attacks on post hoc explanation methods
Dylan Slack, Sophie Hilgard, Emily Jia, Sameer Singh, and Himabindu Lakkaraju. Fooling lime and shap: Ad- versarial attacks on post hoc explanation methods. In Pro- ceedings of the AAAI/ACM Conference on AI, Ethics, and Society, pages 180–186, 2020
2020
-
[40]
Logical explanations for deep relational machines using relevance information
Ashwin Srinivasan, Lovekesh Vig, and Michael Bain. Logical explanations for deep relational machines using relevance information. Journal of Machine Learning Re- search, 20(130):1–47, 2019
2019
-
[41]
Visu- alizing the impact of feature attribution baselines
Pascal Sturmfels, Scott Lundberg, and Su-In Lee. Visu- alizing the impact of feature attribution baselines. Distill, 5(1):e22, 2020
2020
-
[42]
Ax- iomatic attribution for deep networks
Mukund Sundararajan, Ankur Taly, and Qiqi Yan. Ax- iomatic attribution for deep networks. In International conference on machine learning, pages 3319–3328. PMLR, 2017
2017
-
[43]
Sanity checks for saliency metrics
Richard Tomsett, Dan Harborne, Supriyo Chakraborty, Prudhvi Gurram, and Alun Preece. Sanity checks for saliency metrics. In Proceedings of the AAAI conference on artificial intelligence, volume 34, pages 6021–6029, 2020
2020
-
[44]
Evaluation of post-hoc xai ap- proaches through synthetic tabular data
Julian Tritscher, Markus Ring, Daniel Schlr, Lena Het- tinger, and Andreas Hotho. Evaluation of post-hoc xai ap- proaches through synthetic tabular data. In Foundations of Intelligent Systems: 25th International Symposium, ISMIS 2020, Graz, Austria, September 23–25, 2020, Proc...
2020
-
[45]
Attention is all you need
Ashish Vaswani, Noam Shazeer, Niki Parmar, Jakob Uszkoreit, Llion Jones, Aidan N Gomez, Łukasz Kaiser, and Illia Polosukhin. Attention is all you need. Advances in neural information processing systems, 30, 2017
2017
-
[46]
Transformers in time series: A survey
Qingsong Wen, Tian Zhou, Chaoli Zhang, Weiqi Chen, Ziqing Ma, Junchi Yan, and Liang Sun. Transformers in time series: A survey. arXiv preprint arXiv:2202.07125, 2022
2022 arXiv
-
[47]
Evaluating the correctness of explainable ai algorithms for classification
Orcun Yalcin, Xiuyi Fan, and Siyuan Liu. Evaluating the correctness of explainable ai algorithms for classification. arXiv preprint arXiv:2105.09740, 2021
2021 arXiv
-
[48]
Revisiting sanity checks for saliency maps
Gal Yona and Daniel Greenfeld. Revisiting sanity checks for saliency maps. arXiv preprint arXiv:2110.14297, 2021
2021 arXiv
-
[49]
Visualizing and un- derstanding convolutional networks
Matthew D Zeiler and Rob Fergus. Visualizing and un- derstanding convolutional networks. In Computer Vision– ECCV 2014: 13th European Conference, Zurich, Switzer- land, September 6-12, 2014, Proceedings, Part I 13, pages 818–833. Springer, 2014
2014
-
[50]
A survey on neural network interpretability
Yu Zhang, Peter Tiˇno, Aleš Leonardis, and Ke Tang. A survey on neural network interpretability. IEEE Transac- tions on Emerging Topics in Computational Intelligence, 5(5):726–742, 2021. A Appendix In the following, we provide addition plots, mostly for all trained models, to ...
2021
Reviewed August 11, 2026 · model on record in the stance chip above.
Discussion (0). Continue with ORCID to comment.