REVIEW 2 major objections 5 minor 13 references
A description of the radio astronomy data processing tool DDF Pipeline
T0 review · 2 major / 5 minor · reviewed 2026-08-05 · deepseek-v4-flash
Pith's one-line read This paper reports a 68.87-hour profiling run of the DDF Pipeline in which killMS calibration consumed 53.40 percent of wall time, DDFacet imaging 33.87 percent, and 12.09 percent was left unprofiled.
desk verdict A single-run profiling note that plausibly shows killMS dominating DDFacet, but the dool attribution and subprocess accounting are under-specified, so the exact split isn't established. read the letter →
The pith
A machine-rendered reading of the paper's core claim, the machinery that carries it, and where it could break.
The reading
What carries the argument
The load-bearing object is the DDF Pipeline itself, a composite workflow in which the calibration program killMS and the imaging program DDFacet are invoked in sequence: 120 killMS calls and 19 DDFacet calls under the default configuration. The measurement mechanism is a per-minute sampling monitor that records CPU, memory, and disk occupancy and labels each sample as killMS, DDFacet, or 'no profile.' That labelled time series is what turns the run into the percentage table, so the entire bottleneck conclusion rests on the correctness of the monitor's per-minute attribution.
What would settle it
Repeat the same run on the same node with per-process accounting sampled at one-second resolution; if the unattributed 'no profile' time closes to near zero or the killMS/DDFacet split moves by several percentage points, the reported 53.40% vs 33.87% profile is not stable.
Extended reading notes
Core claim
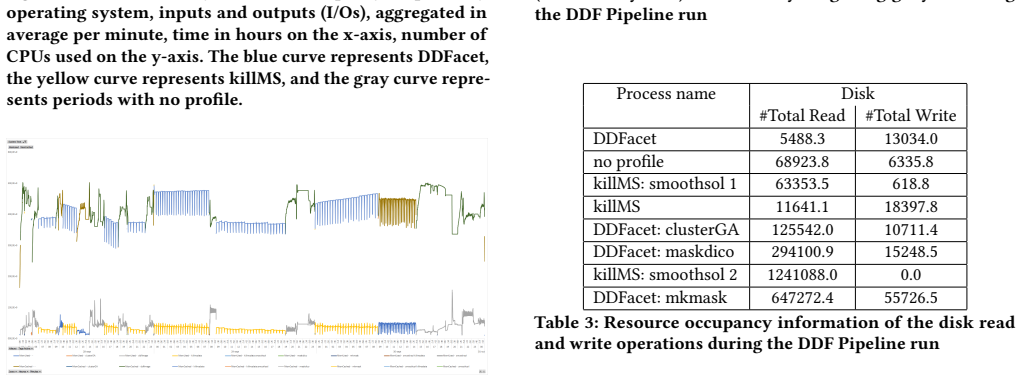
The central empirical claim is a specific resource budget for a full DDF Pipeline run. On a 120-CPU, 512 GB RAM single node, the run processed 24 tar-archive MeasurementSets that decompress to 134.4 GB and produced 594 GB of output, including 11 full-resolution and 4 low-resolution FITS images. The coarse-grain profile shows killMS accounting for 132,388 seconds (53.40% of wall time), DDFacet accounting for 83,969 seconds (33.87%), and 29,968 seconds (12.09%) falling into a 'no profile' category. In CPU and memory terms, DDFacet averages 25.1 user CPUs and 45.7 GB used, while killMS averages 9.2 user CPUs and 33.6 GB used; several DDFacet sub-tasks (clusterGA, mkmask, maskdico) have very lar
Load-bearing premise
The bottleneck result stands only if the per-minute monitor correctly assigns every relevant CPU, memory, and disk event to killMS or DDFacet, and if the 12.09% of wall time with no profile is genuine pipeline execution rather than a blind spot in the monitoring.
Editorial extensions
If this is right
- If this profile is representative, shortening total runtime means working on killMS first; its 53.40% share dwarfs DDFacet's 33.87%.
- The 120 call/19 call pattern under the default configuration means most calibration work happens in many small independent invocations, so calibration-level parallelism is a natural lever.
- DDFacet's high user-CPU average (25.1 CPUs) suggests imaging is already using many cores well, whereas killMS's lower CPU average leaves more room for core-level scaling.
- The 594 GB of output from 134.4 GB of input means a full production run must provision about 4.4 times the input size for products and intermediates, independent of wall time.
- The 12.09% unprofiled time means roughly 8.3 hours of the run is not yet explained; a complete cost model would need to close that gap.
Reading between the lines
- A natural extension would be repeating the same measurement across several fields and frequency bands; a single default-configuration run on one dataset does not separate algorithmic cost from data-dependent cost, and that is the test this paper does not perform.
- If the 'no profile' gap is dominated by pipeline orchestration or I/O stalls rather than by killMS or DDFacet, the headline split would shrink; a per-second trace of the same run would settle this within a few hours of compute.
- Roughly scaling the measured 68.87 hours over 134.4 GB of input gives about half an hour per gigabyte on this node; using that as a crude linear cost model for SKA-scale volumes shows the need for much more parallelism, but also that this profiling step is only the first calibration point.
- Because the profiled container bundles older released versions (pipeline 3.1, DDFacet 0.7.2, killMS 3.1), the numbers are a baseline for those versions; the same methodology applied to current releases would reveal whether algorithmic updates have shifted the bottleneck.
Editorial analysis
A structured set of objections, weighed in public.
Referee Report
Summary. The paper describes the DDF Pipeline, a radio-astronomy data-processing tool built around DDFacet and killMS, and reports a coarse-grain profiling run on a single HPE node. The input is 24 tar-archived MeasurementSets (134.4 GB decompressed), processed with the default configuration in 68.87 hours. The central quantitative claim, in Section 3 and Table 1, is the wall-time split: killMS 53.40%, DDFacet 33.87%, and a 'no profile' category 12.09%. The paper also reports CPU, memory, and disk-use summaries in Tables 2 and 3 and shows time series in Figures 1–3.
Significance. If the reported profile is reliable, it provides a useful, concrete resource characterization of a widely used pipeline and a candidate for SKA processing. The paper gives the exact software versions, dataset, and hardware, and the tables contain falsifiable numbers. However, the quantitative contribution is currently undermined by an arithmetic inconsistency in Table 1 and by an unspecified attribution methodology for the monitoring data. These are fixable within the manuscript's scope, and the paper would be a reasonable archival description once the profile is reported with a consistent denominator and a clear explanation of how process categories were assigned.
major comments (2)
- [Section 3, Table 1] The rows of Table 1 do not sum to the stated total. Summing all eight process and subprocess rows gives 248,929 s, not 247,929 s as shown in the 'total' row. If the subprocess rows (killMS: smoothsol 1/2, DDFacet: clusterGA/mkmask/maskdico) are intended to be subsets of the main killMS/DDFacet entries, then the disjoint total is 132,388 + 83,969 + 29,968 = 246,325 s, leaving 1,604 s unaccounted. If instead they are separate categories, the total should be 248,929 s. The percentage for 'killMS: smoothsol 1' is also wrong: 1,825 / 247,929 is about 0.74%, not 0.33%. The table must state whether subprocess rows are included in the main rows and must use a single consistent denominator; as printed, the claimed 53.40% / 33.87% split is not reproducible.
- [Section 3] The measurement methodology that produces Table 1 and Figures 1–3 is not described. The paper only states that the Dool monitoring tool was used; it does not give the sampling interval or aggregation rule, how CPU/wall-clock time is attributed to process names, how subprocesses are assigned to killMS versus DDFacet, or what the 'no profile' category contains. Since 'no profile' accounts for 12.09% of wall time, an unattributed class of that size could change the relative ranking of killMS and DDFacet if it contains pipeline activity (e.g., Python wrappers, orchestration, or child processes not matched by Dool). This attribution is load-bearing for the central claim: please provide the exact Dool invocation, parsing/aggregation steps, and classification rules.
minor comments (5)
- [Section 3] The hardware description says '2 x AMD EPYC 7543 32-Core Processors, 32 cores each at 2.8GHz with hyper-threading' and then the node is described as 'equipped with 120 CPUs'. Please clarify whether 120 is the number of logical CPUs available via Slurm or a typo.
- [Section 3] The phrase '512 gigabytes of RAM configured with 50% of shared memory' is unclear. Specify whether this is a memory interleaving setting, a container limit, or a Slurm allocation.
- [Figures 1–3] The figures are not referenced in the prose and the captions do not define the 'no profile' category or the units precisely. For example, Figure 1's caption mentions both 'CPU user and system level occupancy' and 'number of CPUs used'; clarify the y-axis quantity.
- [Section 3] State whether the 24 tar-archive MeasurementSets were processed sequentially or with any parallelism; this is needed to interpret the 68.87-hour total duration.
- [References] Reference [12] has a typo: 'InJob Scheduling Strategies' should be 'In Job Scheduling Strategies'.
Circularity Check
No circularity: the paper reports a direct profiling measurement with no fitted parameters, derived predictions, or load-bearing self-citations.
full rationale
The paper's central quantitative claim is the wall-time and resource-usage split of a DDF Pipeline run (Section 3, Tables 1-3). This is an observational report: elapsed times and dool samples are measured, not derived from assumptions. No quantity is defined in terms of the target result; no parameter is fitted to a dataset and then renamed as a prediction; no uniqueness theorem or ansatz is imported from prior work. The few citations to DDF Pipeline, DDFacet, killMS, and LoTSS papers are contextual attributions and do not supply premises from which the timing figures are deduced. Even if the dool attribution method is underspecified or Table 1's rows are internally inconsistent, those are correctness/measurement-validity concerns, not circularity. The profiling result is not equivalent to its inputs by construction, so the circularity score is 0.
Assumptions & free parameters
assumptions (3)
- domain assumption The dool monitoring tool's per-minute sampling and process attribution accurately reflects the resource usage of killMS, DDFacet, and 'no profile' periods.
- domain assumption The single run with the default configuration and the L234026 dataset is a meaningful exemplar of DDF Pipeline performance.
- domain assumption The named container (DDF Pipeline 3.1, DDFacet 0.7.2, killMS 3.1) faithfully represents the production pipeline.
Cite this review
Pith. "Pith review of A description of the radio astronomy data processing tool DDF Pipeline." pith.science (2026). https://pith.science/paper/P2FM52CD
@misc{pith2026250903075,
  author       = {Pith},
  title        = {Pith review of: A description of the radio astronomy data processing tool DDF Pipeline},
  year         = {2026},
  howpublished = {\url{https://pith.science/paper/P2FM52CD}},
  note         = {Machine review of arXiv:2509.03075}
}
read the original abstract
This paper presents the DDF Pipeline, a radio astronomy data processing tool initially designed for the LOw-Frequency ARray (LO- FAR) radio-telescope and a candidate for processing data from the Square Kilometre Array (SKA). This work describes the DDF Pipeline software and presents a coarse-grain profiling execution to characterize its performance.
Figures


Reference graph
Works this paper leans on
-
[1]
Scott Baker. 2024. scottchiefbaker/dool. https://github.com/scottchiefbaker/dool original-date: 2019-06-13T23:13:45Z
work page 2024
-
[2]
Peter E. Dewdney, Peter J. Hall, Richard T. Schilizzi, and T. Joseph L. W. Lazio
-
[3]
The Brittany Digital Public Interest Group. 2025. Eskemm Numérique. https: //www.eskemm-numerique.fr/
work page 2025
-
[4]
Martin Hardcastle, Tim Shimwell, Cyril Tasse, and Wendy Williams. 2025. DDF Pipeline source code. https://github.com/mhardcastle/ddf-pipeline
work page 2025
-
[5]
A.P. Schoenmakers, G.A. Renting, and J.D.D. Mol. 2022. MeasurementSet de- scription for LOFAR, Version 2.09.00. https://www.astron.nl/lofarwiki/lib/exe/ fetch.php?media=public:documents:ms2_description_for_lofar_2.09.00.pdf
work page 2022
-
[6]
T. W. Shimwell, C. L. Hale, P. N. Best, et al. 2025. The LOFAR Two-metre Sky Survey: Deep Fields Data Release 2. I. The ELAIS-N1 field. Astronomy & Astro- physics 695 (March 2025), A80. https://doi.org/10.1051/0004-6361/202452930 arXiv:2501.04093 [astro-ph]
arXiv 2025
-
[7]
T. W. Shimwell, C. Tasse, M. J. Hardcastle, et al. 2019. The LOFAR Two-metre Sky Survey. II. First data release. Astronomy and Astrophysics 622 (Feb. 2019), A1. https://doi.org/10.1051/0004-6361/201833559 ADS Bibcode: 2019A&A...622A...1S
-
[8]
O. M. Smirnov and C. Tasse. 2015. Radio interferometric gain calibration as a complex optimization problem. Monthly Notices of the Royal Astronomical Society 449, 3 (May 2015), 2668–2684. https://doi.org/10.1093/mnras/stv418
Show all 13 references
- [9]
-
[10]
Tasse, B
C. Tasse, B. Hugo, M. Mirmont, O. Smirnov, M. Atemkeng, L. Bester, M. J. Hard- castle, R. Lakhoo, S. Perkins, and T. Shimwell. 2018. Faceting for direction- dependent spectral deconvolution. Astronomy & Astrophysics 611 (March 2018), A87. https://doi.org/10.1051/0004-6361/2017...
2018 arXiv
-
[11]
Tasse, T
C. Tasse, T. Shimwell, M. J. Hardcastle, et al . 2021. The LOFAR Two-meter Sky Survey: Deep Fields Data Release 1. I. Direction-dependent calibration and imaging. Astronomy and Astrophysics 648 (April 2021), A1. https://doi.org/10. 1051/0004-6361/202038804 ADS Bibcode: 2021A&A...
2021
-
[12]
Yoo, Morris A
Andy B. Yoo, Morris A. Jette, and Mark Grondona. 2003. SLURM: Simple Linux Utility for Resource Management. InJob Scheduling Strategies for Parallel Process- ing, Dror Feitelson, Larry Rudolph, and Uwe Schwiegelshohn (Eds.). Springer, Berlin, Heidelberg, 44–60. https://doi.org...
2003 doi
-
[2009]
The Square Kilometre Array. Proc. IEEE 97, 8 (Aug. 2009), 1482–1496. https://doi.org/10.1109/JPROC.2009.2021005
2009
Reviewed August 5, 2026 · model on record in the stance chip above.
Discussion (0). Continue with ORCID to comment.