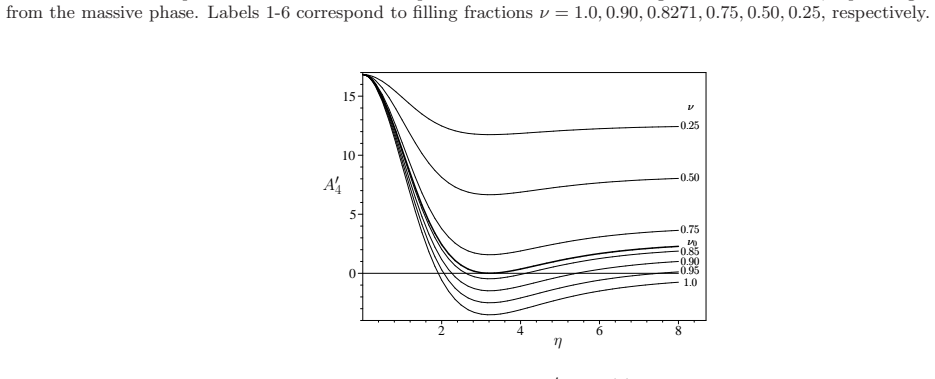
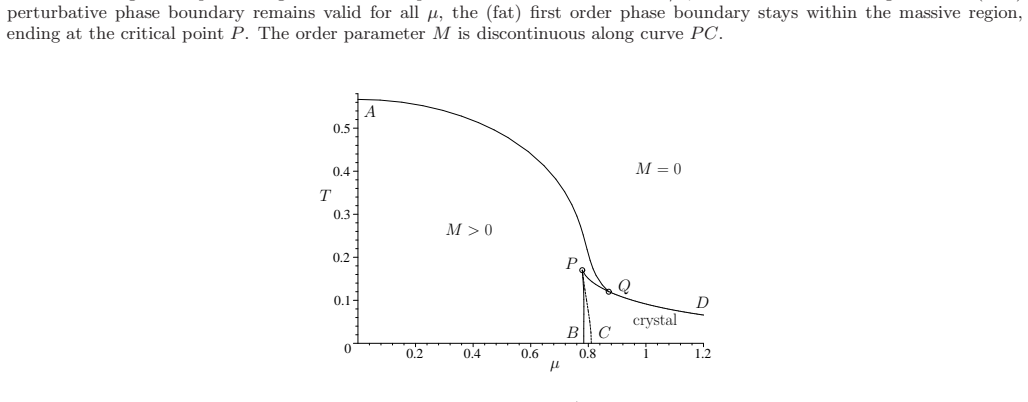
Phase diagram of the massless Gross-Neveu model with two components
Pith reviewed 2026-06-26 13:49 UTC · model grok-4.3
The pith
Stability analyses determine the full large-N phase diagram of the two-component Gross-Neveu model without solving the thermal Hartree-Fock equations.
A machine-rendered reading of the paper's core claim, the machinery that carries it, and where it could break.
Core claim
All phase boundaries, including those separating homogeneous and inhomogeneous phases, can be located solely by stability analyses of various kinds, so that the thermal Hartree-Fock problem need not be solved; this procedure produces a qualitative change in the phase diagram at a critical filling fraction.
What carries the argument
Various kinds of stability analyses applied to homogeneous and inhomogeneous candidate phases.
If this is right
- The phase diagram is completely determined at large N for the two-flavor case at any temperature and chemical potential.
- Inhomogeneous phases occupy definite regions whose boundaries are fixed by the stability criteria.
- A critical filling fraction separates two qualitatively different arrangements of the phases.
- Exact finite-N results from related work can be compared directly against the large-N boundaries obtained here.
Where Pith is reading between the lines
- The same stability techniques might locate phase boundaries in other four-fermion models that share the same large-N structure.
- The critical filling fraction could mark the density at which the Fermi surface first permits a new class of instabilities.
- The predicted boundaries supply concrete targets for lattice simulations that include finite-N effects.
- Adding a bare mass term would require checking whether the existing stability criteria continue to locate all transitions.
Load-bearing premise
Stability analyses of several kinds are enough to find every phase boundary and no extra phases or transitions exist that would only be seen by solving the full thermal Hartree-Fock equations.
What would settle it
Numerical solution of the thermal Hartree-Fock equations at a temperature and density near one of the predicted boundaries that reveals either a different transition point or an additional phase not captured by the stability criteria.
Figures


read the original abstract
Recently, Benini, Mamroud, Reis and Serone have presented exact results for the Gross-Neveu model at finite density, both at finite N and in the large N limit. Generalizing previous studies, they introduce a chemical potential acting only on a subset of fermion flavors - the two-component Gross-Neveu model. Here, we take up this idea and extend the semiclassical study to finite temperature. The full (large N) phase diagram including inhomogeneous phases is constructed without solving the thermal Hartree-Fock problem. All phase boundaries can be found on the basis of various kinds of stability analyses. As a result, we find a qualitative change of the phase diagram at some critical filling fraction.
Editorial analysis
A structured set of objections, weighed in public.
Referee Report
Summary. The manuscript extends semiclassical studies of the two-component massless Gross-Neveu model to finite temperature. It constructs the full large-N phase diagram, including inhomogeneous phases, at finite T and density by means of various stability analyses of homogeneous and inhomogeneous reference configurations, without solving the thermal Hartree-Fock equations. The central result is a qualitative change in the phase diagram structure at a critical filling fraction.
Significance. If the central claim holds, the work provides a technically efficient route to complete phase diagrams in models with spatially modulated order parameters by replacing full minimization with targeted stability thresholds. This generalizes the recent exact results of Benini et al. and could be useful for related four-fermion models. The reported change at critical filling fraction would be a concrete, falsifiable prediction.
major comments (1)
- [Abstract / method paragraph] Abstract and the paragraph describing the method: the assertion that 'all phase boundaries can be found on the basis of various kinds of stability analyses' without solving the thermal Hartree-Fock problem is load-bearing for the completeness claim. Because the effective potential is non-convex and the order parameter can be modulated, an explicit argument is required showing that no first-order transitions or additional multi-critical points exist whose locations are invisible to linear stability around the homogeneous and previously identified inhomogeneous phases. Without this, the reported qualitative change at the critical filling fraction cannot be guaranteed to be exhaustive.
Simulated Author's Rebuttal
We thank the referee for the careful reading and for identifying this key point about the completeness of our phase-diagram construction. We address the major comment below.
read point-by-point responses
-
Referee: Abstract and the paragraph describing the method: the assertion that 'all phase boundaries can be found on the basis of various kinds of stability analyses' without solving the thermal Hartree-Fock problem is load-bearing for the completeness claim. Because the effective potential is non-convex and the order parameter can be modulated, an explicit argument is required showing that no first-order transitions or additional multi-critical points exist whose locations are invisible to linear stability around the homogeneous and previously identified inhomogeneous phases. Without this, the reported qualitative change at the critical filling fraction cannot be guaranteed to be exhaustive.
Authors: We agree that an explicit justification is required to support the claim that stability analyses capture every phase boundary. In the large-N Gross-Neveu model the inhomogeneous phases bifurcate continuously from the homogeneous ones at the linear-instability thresholds; likewise, the boundaries separating distinct inhomogeneous configurations are located by stability analyses of one inhomogeneous background against perturbations that connect it to the other. The non-convexity of the effective potential is handled by these global stability thresholds rather than local minima alone. This structure is inherited from the exact T=0 results of Benini et al., where all transitions remain continuous. We will add a short subsection in the revised manuscript that spells out this reasoning and confirms the absence of first-order lines or extra multi-critical points within the explored parameter range, thereby securing the reported qualitative change at the critical filling fraction. revision: yes
Circularity Check
No circularity; phase diagram constructed via external generalization and stability analyses
full rationale
The paper generalizes results from Benini et al. (distinct authors) to finite T using various stability analyses without solving the full thermal Hartree-Fock equations. No quoted equations or claims reduce by construction to fitted inputs, self-definitions, or self-citation chains. The central method statement is an explicit assumption about sufficiency of stability thresholds rather than a derived result that loops back to its own inputs. The work is self-contained against the cited external benchmarks.
Axiom & Free-Parameter Ledger
Reference graph
Works this paper leans on
-
[1]
The phase transition happens at µ = µ c where the right hand side of ( 22) vanishes in addition to ( 23)
(23) This is precisely the relation between the parameter y in the potential and the occupation fraction ν of the valence state from the DHN baryon. The phase transition happens at µ = µ c where the right hand side of ( 22) vanishes in addition to ( 23). Combining both conditions, we find µ c = 2y πν = MB(ν) ν , (24) as expected. Thus, at T = 0, we see an ...
-
[2]
D. J. Gross and A. Neveu, Phys. Rev. D 10, 3235 (1974)
1974
-
[3]
R. F. Dashen, B. Hasslacher, and A. Neveu, Phys. Rev. D 12, 2443 (1975)
1975
-
[4]
Feinberg, Ann
J. Feinberg, Ann. Phys. 309, 166 (2004)
2004
-
[5]
Thies, J
M. Thies, J. Phys. A: Math. Gen. 39, 12707 (2006)
2006
-
[6]
J. Lenz, L. Pannullo, M. Wagner, B. Wellegehausen, A. Wip f, Phys. Rev. D 101, 094512 (2020)
2020
-
[7]
J. Lenz, M. Mandl, and A. Wipf, Phys. Rev. D 105, 034512 (2022)
2022
-
[8]
Ciccone, L
R. Ciccone, L. Di Pietro, and M. Serone, JHEP 02, 211 (2024)
2024
-
[9]
Melin, Y
V. Melin, Y. Sekiguchi, P. Wiegmann, and K. Zarembo, Phys . Rev. Lett. 133, 101601 (2024)
2024
-
[10]
V. Melin, P. Wiegmann, and K. Zarembo, Finite-gap potentials as a semiclassical limit of the therm odynamic Bethe Ansatz , arXiv:2512.19655 [hep-th]
-
[11]
Benini, O
F. Benini, O. Mamroud, T. Reis, and M. Serone, Phys. Rev. Lett. 135, 141601 (2025)
2025
-
[12]
F. Benini, O. Mamroud, T. Reis, and M. Serone, Perturbative, Nonperturbative and Exact Aspects of Crysta lline Phases in the Gross-Neveu Model , arXiv:2605.05307 [hep-th]
-
[13]
Thies, Phys
M. Thies, Phys. Rev. D 113, 036016 (2026)
2026
-
[14]
Basar and G
G. Basar and G. V. Dunne, Phys. Rev. Lett. 100, 200404 (2008)
2008
-
[15]
Basar and G
G. Basar and G. V. Dunne, Phys. Rev. D 78, 105012 (2009)
2009
-
[16]
Sch¨ on and M
V. Sch¨ on and M. Thies, Phys. Rev. D 62, 096002 (2000)
2000
-
[17]
Thies and K
M. Thies and K. Urlichs, Phys. Rev. D 67, 125015 (2003)
2003
-
[18]
Schnetz, M
O. Schnetz, M. Thies, and K. Urlichs, Ann. of Phys. 314, 425 (2004)
2004
-
[19]
Schnetz, M
O. Schnetz, M. Thies, and K. Urlichs, Ann. of Phys. 321, 2604 (2006)
2006
-
[20]
Feinberg and A
J. Feinberg and A. Zee, Phys, Lett. B 411, 134 (1997)
1997
-
[21]
Thies and K
M. Thies and K. Urlichs, Phys. Rev. D 71, 105008 (2005)
2005
-
[22]
Thies, Phys
M. Thies, Phys. Rev. D 110, 096012 (2024)
2024
-
[23]
Braun, S
J. Braun, S. Finkheimer, F. Karbstein, and D. Roscher, P hys. Rev. D 91, 116006 (2015)
2015
-
[24]
Koenigstein, L
A. Koenigstein, L. Pannullo, S. Rechenberger, M. Steil , and M. Winstel, J. Phys. A: Math. Theor. 55, 375402 (2022)
2022
-
[25]
Wolff, Phys
U. Wolff, Phys. Lett. B 157, 303 (1985)
1985
-
[26]
Boehmer, U
C. Boehmer, U. Fritsch, S. Kraus, and M. Thies, Phys. Rev . D 78, 065043 (2008)
2008
discussion (0)
Sign in with ORCID, Apple, or X to comment. Anyone can read and Pith papers without signing in.