REVIEW 4 major objections 5 minor 94 references
Chartist: Task-driven Eye Movement Control for Chart Reading
T0 review · 4 major / 5 minor · reviewed 2026-08-09 · deepseek-v4-flash
Pith's one-line read This paper introduces Chartist, a hierarchical LLM-plus-RL model that predicts task-driven scanpaths on charts without human eye-tracking data, achieving closer similarity to human gaze than prior scanpath models.
desk verdict Chartist is a genuinely new architecture for task-driven scanpath prediction on charts, and the central idea holds; the evaluation is under-powered and the 'no human data' claim needs provenance documentation, but this deserves a serious referee. read the letter →
The pith
A machine-rendered reading of the paper's core claim, the machinery that carries it, and where it could break.
The reading
What carries the argument
The central object is a hierarchical supervisory control architecture with two POMDP layers. The high-level cognitive controller, instantiated as GPT-4o, treats the accumulated memory of fixated text and positions as an observation and selects a subtask; its action set is the sequence of cognitive stages for charts—search for a text label, find an associated mark, read an associated value—plus an answer action. The low-level oculomotor controller, trained with proximal policy optimization, treats a 320x320 chart as a 20x20 discrete fixation grid and chooses coordinates using an observation composed of foveal and peripheral image patches, a task-driven saliency map from SalChartQA, a visit-history matrix, and a one-hot reference position. Memory decay follows a softmax over fixation recency, $\text{Softmax}(\rho \cdot (t - t_i))$ with $\rho = 0.1$, which lets the LLM act under bounded memory. The architecture's work is to separate reasoning about what information is needed from the pixel-level mechanics of where to look, so the former can be handled by a pretrained language model and the latter by RL policies that are trained on labeled charts without eye-tracking data.
What would settle it
Retrieve the 12 evaluation charts from the cited human dataset and check whether any appear in the real or synthetic chart collection used for RL training, and inspect the training data of the task-driven saliency model; if either contains human gaze, click, or attention labels from those charts, the 'trained without human eye movement data' claim is falsified. A cleaner experiment is to retrain Chartist with the saliency channel set to zero and compare Sequence Score on the same 12 tasks.
Extended reading notes
Core claim
Chartist claims that task-driven scanpath prediction on charts can be solved by a two-level hierarchical controller that never sees human eye movements during training. Given a chart image and a task sentence, an LLM-based cognitive controller maintains a memory of what has been read so far, with text gathered from fixated patches and a forgetting probability, and selects a subtask from three chart-reading operations: search for a text label, find an associated mark, and read an associated value, or stop and answer. Each subtask is executed by a reinforcement-learned oculomotor policy that chooses fixation coordinates from a discretized 20x20 map under foveal and peripheral vision constraints, guided by task-driven saliency, visit history, and a reference position. Evaluated on 12 bar-chart tasks with human scanpaths from Polatsek et al., Chartist achieves the closest similarity to human data among the compared models on region-based metrics, reproduces all 27 summary statistics within one standard deviation of human means, and produces qualitatively task-appropriate fixation patterns.
Load-bearing premise
The load-bearing premise is that no human gaze or attention information entered the model through its training charts, its task-generation rules, or the task-driven saliency component, and that the 12 evaluation charts were not part of the reinforcement-learning training collection; if that premise is false, the reported similarity to human scanpaths could be memorization rather than prediction.
Editorial extensions
If this is right
- Chartist can produce task-specific scanpaths for bar charts with no new eye-tracking data, so chart-design evaluation and A/B comparison can be run as simulation before any user study.
- On region-based metrics the model outperforms all three baselines for the three analytical tasks, meaning fixation order over meaningful chart parts matches humans better than free-viewing or VQA models.
- All 27 eye-movement behavior statistics fall within one standard deviation of human means, so the model reproduces aggregate gaze behavior such as axis-heavy fixation and revisits.
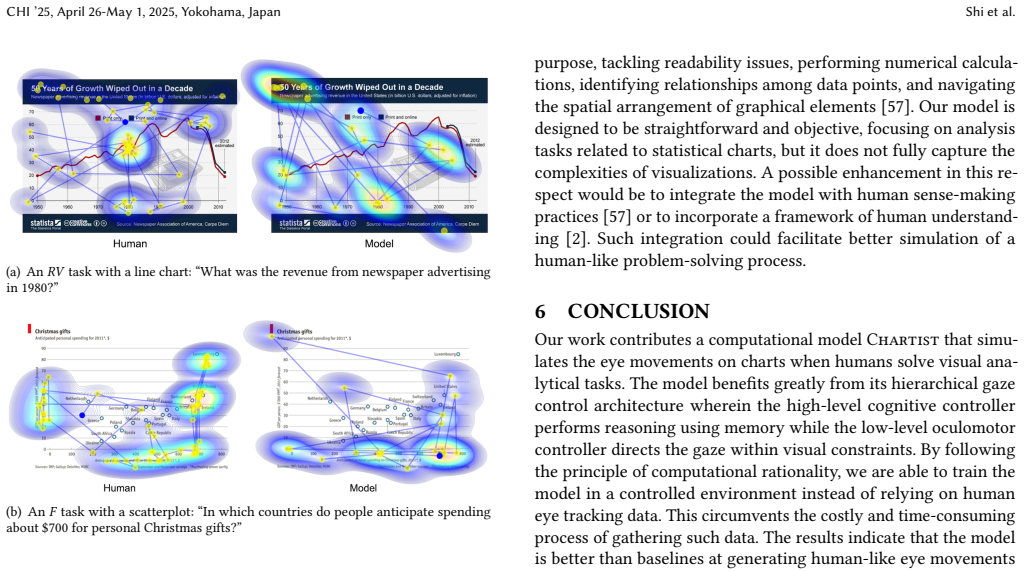
- The same architecture transfers to line charts and scatterplots with manual labeling and retraining, indicating task-driven scanpath prediction is not restricted to bar charts.
Reading between the lines
- A concrete way to stress-test the no-gaze-data claim is to ablate the task-driven saliency channel and retrain: if scanpath similarity collapses, the model's human-likeness may inherit the saliency model's training data rather than the hierarchical control.
- Because Chartist's fixation counts (about 48) are roughly half the human count (about 90), comparing models at matched fixation budgets, or adding duration information, could change the ranking on pixel-based metrics.
- A testable extension is to apply the same two-level controller to tables and heatmaps, where the value-reading operation would need cell or color decoding; the paper does not report such experiments.
Editorial analysis
A structured set of objections, weighed in public.
Referee Report
Summary. The paper introduces Chartist, a hierarchical computational model for predicting task-driven scanpaths on charts. A high-level cognitive controller powered by GPT-4o selects subtasks on the basis of an internal memory of previously fixated information, while low-level oculomotor controllers trained with PPO move the gaze in a 20x20 discretized fixation space. The model is trained without human eye-tracking data and is evaluated on 12 analytical tasks with horizontal bar charts from the Polatsek et al. dataset, covering retrieve-value, filter, and find-extreme tasks. The authors report scanpath similarity metrics (DTW, LEV, Sequence Score) and summary gaze statistics, comparing Chartist with VQA scanpath prediction, UMSS, and DeepGaze III. The central claim is that Chartist is the first computational model for predicting task-driven scanpaths on charts and that it produces scanpaths closest to human ground truth among the compared methods.
Significance. If the empirical claims hold, the paper makes a useful contribution to visualization and eye-tracking research: a task-driven scanpath model that does not require human gaze data for training, with a plausible two-level cognitive/oculomotor architecture. The evaluation is relatively rich: three tasks, four methods, scanpath metrics, and summary statistics, plus qualitative generalizations to line charts and scatterplots. The authors also explicitly acknowledge limitations in question-answering accuracy and generalization. However, the significance hinges on two provenance questions: whether the evaluation charts were separated from the RL training collection, and whether the task-driven saliency component SalChartQA was trained on human-derived attention data. Without resolving these, the 'without human eye-tracking data' contribution and the validity of Table 1 are not fully established. The paper would also be strengthened by inferential statistics for the scanpath metrics, since current reporting is based on point estimates and a permissive 'within one standard deviation' criterion.
major comments (4)
- [Section 3.5 vs. Section 4.1] The paper does not state whether the 12 horizontal bar charts used for evaluation were excluded from the chart collection used to build the RL training environment in Section 3.5. If any of the 12 test charts were included in Step 1, the PPO oculomotor policies could learn the AOI locations on the exact test stimuli, making the low-level gaze control behavior in Table 1 trivial and inflating the LEV and Sequence Score results. The sentence in Section 4.1 that 'none of the human eye movement data informed our training' addresses gaze labels, not chart images, so it does not rule out this overlap. Please state the chart-level split explicitly and, if needed, re-run the evaluation with the test charts excluded.
- [Section 3.4 and Section 3.5] The oculomotor observation uses a task-driven saliency model [80], SalChartQA, as one of its input components. The paper says that no human eye-tracking data informed training, but it does not disclose whether SalChartQA was trained on human-derived attention data such as crowdsourced mouse clicks or gaze data, nor whether that training data includes charts from the same evaluation set. If SalChartQA has absorbed human attention patterns on charts, then Chartist indirectly depends on human attention data, which weakens the claim of training 'without relying on human eye movement data.' Please clarify the provenance of SalChartQA's training data and consider an ablation without this component.
- [Section 4.3 and Table 1] The central claim that Chartist is closest to human scanpaths rests on point estimates of Sequence Score, LEV, and DTW, but the paper reports no confidence intervals or significance tests for these scanpath metrics. Given the large human variability visible in Table 1 (e.g., human number of fixations is 88.6 with SD 57.0, while Chartist produces 48.4 with SD 4.9), the criterion that values fall 'within one standard deviation of the human mean' is permissive and does not by itself establish similarity. Please add bootstrap or permutation-based intervals and tests over human-predicted scanpath pairs for the main similarity metrics, or clearly state the comparisons as descriptive only.
- [Section 4.3] The claim that 'all 27 of its values for the eye movement behavior metrics fall within one standard deviation of the human mean' is reported without a table or listing that enables the reader to verify this count for each task and metric. Since this count is used to argue that Chartist aligns more closely with human statistical patterns than the baselines, the per-metric comparison should be made explicit, preferably in a supplementary table with the exact calculation of 'within one standard deviation.'
minor comments (5)
- [Section 4.1] The text says 'we report the mean and best evaluation scores (see Table 2)', but the paper contains only Table 1; either renumber the table or correct the cross-reference.
- [Section 4.3] The sentence 'Chartist is the only model that successfully replicates this phenomenon by reproducing the human order of task-dependent AOI ratios: FE (10.6%), then RV (4.1%), and finally FE (0.2%)' appears to contain a labeling error; the sequence should probably be RV, F, FE, or the task labels should be corrected.
- [Section 3.5] There is a typo in Step 3: 'proximal policy pptimization' should be 'proximal policy optimization.'
- [Section 5.2] The generalization examples with a line chart and a scatterplot are illustrative but are not described with the same evaluation rigor as the main bar-chart results; it would help to label them as preliminary or anecdotal evidence.
- [General] The project page is mentioned, but the paper does not state whether code, the chart-level split, or the trained models will be released; providing an artifact would materially support reproducibility of the central results.
Circularity Check
No circular derivation: Chartist's predictions are empirical outputs evaluated against human scanpaths; the remaining concerns are data-provenance gaps, not definitional ties.
full rationale
This paper does not contain a circular derivation chain. Chartist is an empirical system with a hierarchical controller: an LLM-based cognitive policy selects subtasks and an RL-based oculomotor policy moves the gaze. The paper's central claim, that Chartist predicts human-like task-driven scanpaths, is supported by comparing generated scanpaths to held-out human eye-tracking data using DTW, Levenshtein distance, and Sequence Score. Those metrics are not fitted parameters and are not used to define the model's output. The most plausible circularity charge is a provenance gap: the paper does not state whether the 12 test charts from the human dataset [56] were excluded from the RL training collection described in Section 3.5, and it does not disclose whether the task-driven saliency component [80], whose authors overlap with the present paper, was trained on human attention data. However, these are empirical evaluation risks, not demonstrated reductions of a prediction to its inputs by construction. The self-citations to [80] and to the authors' prior modeling frameworks are used as component references and design motivation, not as a uniqueness theorem or as evidence that the model's output is forced. The paper also candidly states limitations on generalizability and question-answering accuracy. Because no equation, definition, or fitted parameter makes the reported scanpath similarity equivalent to the training signal, the appropriate circularity score is 0.
Assumptions & free parameters
free parameters (2)
- Forgetting weight rho =
0.1
- Oculomotor RL reward weights
assumptions (4)
- domain assumption GPT-4o can act as a chart-reading planning policy from textual memory summaries.
- domain assumption OCR extracts chart text and values accurately enough from foveal image patches.
- domain assumption RL policies trained on the collected real and synthetic charts transfer to the 12 test charts.
- domain assumption SalChartQA [80] provides a task-driven saliency input without leaking human gaze data into training.
Cite this review
Pith. "Pith review of Chartist: Task-driven Eye Movement Control for Chart Reading." pith.science (2026). https://pith.science/paper/TOZEO5BP
@misc{pith2026250203575,
  author       = {Pith},
  title        = {Pith review of: Chartist: Task-driven Eye Movement Control for Chart Reading},
  year         = {2026},
  howpublished = {\url{https://pith.science/paper/TOZEO5BP}},
  note         = {Machine review of arXiv:2502.03575}
}
read the original abstract
To design data visualizations that are easy to comprehend, we need to understand how people with different interests read them. Computational models of predicting scanpaths on charts could complement empirical studies by offering estimates of user performance inexpensively; however, previous models have been limited to gaze patterns and overlooked the effects of tasks. Here, we contribute Chartist, a computational model that simulates how users move their eyes to extract information from the chart in order to perform analysis tasks, including value retrieval, filtering, and finding extremes. The novel contribution lies in a two-level hierarchical control architecture. At the high level, the model uses LLMs to comprehend the information gained so far and applies this representation to select a goal for the lower-level controllers, which, in turn, move the eyes in accordance with a sampling policy learned via reinforcement learning. The model is capable of predicting human-like task-driven scanpaths across various tasks. It can be applied in fields such as explainable AI, visualization design evaluation, and optimization. While it displays limitations in terms of generalizability and accuracy, it takes modeling in a promising direction, toward understanding human behaviors in interacting with charts.
Figures


Figures from the paper (4 more)


Reference graph
Works this paper leans on
-
[80]
Yao Wang, Weitian Wang, Abdullah Abdelhafez, Mayar Elfares, Zhiming Hu, Mihai Bâce, and Andreas Bulling. 2024. SalChartQA: Question-driven saliency on information visualisations. In CHI ’24: Proceedings of the 2024 CHI Conference on Human Factors in Computing Systems . Article 763
work page 2024
-
[1]
Josh Achiam, Steven Adler, Sandhini Agarwal, Lama Ahmad, Ilge Akkaya, Floren- cia Leoni Aleman, Diogo Almeida, Janko Altenschmidt, Sam Altman, Shyamal Anadkat, et al. 2023. GPT-4 technical report. arXiv preprint arXiv:2303.08774 (2023)
arXiv 2023
-
[2]
Danielle Albers, Michael Correll, and Michael Gleicher. 2014. Task-driven eval- uation of aggregation in time series visualization. In Proceedings of the SIGCHI Conference on Human Factors in Computing Systems . 551–560
2014
-
[3]
George A Alvarez and Patrick Cavanagh. 2004. The capacity of visual short- term memory is set both by visual information load and by number of objects. Psychological Science 15, 2 (2004), 106–111
2004
-
[4]
Robert Amar, James Eagan, and John Stasko. 2005. Low-level components of analytic activity in information visualization. In IEEE Symposium on Information Visualization (INFOVIS). 111–117
2005
-
[5]
Marc Assens, Xavier Giro-i Nieto, Kevin McGuinness, and Noel E O’Connor. 2018. PathGAN: Visual scanpath prediction with generative adversarial networks. In Proceedings of the European Conference on Computer Vision (ECCV) . 406–422
2018
-
[6]
Marc Assens Reina, Xavier Giro-i Nieto, Kevin McGuinness, and Noel E O’Connor
-
[7]
Yunpeng Bai, Aleksi Ikkala, Antti Oulasvirta, Shengdong Zhao, Lucia J Wang, Pengzhi Yang, and Peisen Xu. 2024. Heads-Up Multitasker: Simulating attention switching on optical head-mounted displays. In CHI ’24: Proceedings of the 2024 CHI Conference on Human Factors in Computing Systems . Article 79
2024
Show all 94 references
-
[8]
Wentao Bao and Zhenzhong Chen. 2020. Human scanpath prediction based on deep convolutional saccadic model. Neurocomputing 404 (2020), 154–164
2020
-
[9]
Fabian Beck, Tanja Blascheck, Thomas Ertl, and Daniel Weiskopf. 2015. Word- sized eye-tracking visualizations. In Workshop on Eye Tracking and Visualization (ETVIS). 113–128
2015
-
[10]
Giuseppe Boccignone and Mario Ferraro. 2010. Gaze shifts as dynamical ran- dom sampling. In 2010 2nd European Workshop on Visual Information Processing (EUVIP). IEEE, 29–34
2010
-
[11]
Michelle A Borkin, Zoya Bylinskii, Nam Wook Kim, Constance May Bainbridge, Chelsea S Yeh, Daniel Borkin, Hanspeter Pfister, and Aude Oliva. 2015. Be- yond memorability: Visualization recognition and recall. IEEE Transactions on Visualization and Computer Graphics (TVCG) 22, 1 ...
2015
-
[12]
Michelle A Borkin, Azalea A Vo, Zoya Bylinskii, Phillip Isola, Shashank Sunkavalli, Aude Oliva, and Hanspeter Pfister. 2013. What makes a visualization memorable? IEEE Transactions on Visualization and Computer Graphics (TVCG) 19, 12 (2013), 2306–2315
2013
-
[13]
Matthew Michael Botvinick. 2012. Hierarchical reinforcement learning and decision making. Current Opinion in Neurobiology 22, 6 (2012), 956–962
2012
-
[14]
Dirk Brockmann and Theo Geisel. 2000. The ecology of gaze shifts. Neurocom- puting 32 (2000), 643–650
2000
-
[15]
Anthony Brohan, Yevgen Chebotar, Chelsea Finn, Karol Hausman, Alexander Herzog, Daniel Ho, Julian Ibarz, Alex Irpan, Eric Jang, Ryan Julian, et al. 2023. Do as I can, not as I say: Grounding language in robotic affordances. In Conference on Robot Learning. PMLR, 287–318
2023
-
[16]
Victor Cărbune, Hassan Mansoor, Fangyu Liu, Rahul Aralikatte, Gilles Baechler, Jindong Chen, and Abhanshu Sharma. 2024. Chart-based reasoning: Transferring capabilities from LLMs to VLMs. In Findings of the Association for Computational Linguistics: NAACL 2024. 989–1004
2024
-
[17]
Suyog Chandramouli, Danqing Shi, Aini Putkonen, Sebastiaan De Peuter, Shan- shan Zhang, Jussi Jokinen, Andrew Howes, and Antti Oulasvirta. 2024. A work- flow for building computationally rational models of human behavior. Computa- tional Brain & Behavior 7, 3 (2024), 399–419
2024
-
[18]
Shi Chen, Ming Jiang, Jinhui Yang, and Qi Zhao. 2020. AiR: Attention with Reasoning capability. In Computer Vision – ECCV 2020: 16th European Conference, Glasgow, UK, August 23–28, 2020, Proceedings, Part I 16 . Springer, 91–107
2020
-
[19]
Xianyu Chen, Ming Jiang, and Qi Zhao. 2021. Predicting human scanpaths in visual question answering. InProceedings of the IEEE/CVF Conference on Computer Vision and Pattern Recognition (CVPR) . 10876–10885
2021
-
[20]
Antoine Coutrot, Janet H Hsiao, and Antoni B Chan. 2018. Scanpath modeling and classification with hidden Markov models. Behavior Research Methods (BRM) 50, 1 (2018), 362–379
2018
-
[21]
Murtaza Dalal, Tarun Chiruvolu, Devendra Chaplot, and Ruslan Salakhutdinov
-
[22]
Gautier Drusch, JC Bastien, and Stéfane Paris. 2014. Analysing eye-tracking data: From scanpaths and heatmaps to the dynamic visualisation of areas of interest. In Advances in Science, Technology, Higher Education and Society in the Conceptual Age: STHESCA, Marek Tadeusz (Ed.)
2014
-
[23]
Andrew T Duchowski. 2018. Gaze-based interaction: A 30 year retrospective. Computers & Graphics 73 (2018), 59–69
2018
-
[24]
Manfred Eppe, Christian Gumbsch, Matthias Kerzel, Phuong DH Nguyen, Mar- tin V Butz, and Stefan Wermter. 2022. Intelligent problem-solving as integrated hierarchical reinforcement learning. Nature Machine Intelligence 4, 1 (2022), 11–20
2022
-
[25]
Camilo Fosco, Vincent Casser, Amish Kumar Bedi, Peter O’Donovan, Aaron Hertzmann, and Zoya Bylinskii. 2020. Predicting visual importance across graphic design types. In Proceedings of the 33rd Annual ACM Symposium on User Interface Software and Technology (UIST). 249–260
2020
-
[26]
Michael J Frank and David Badre. 2012. Mechanisms of hierarchical reinforcement learning in corticostriatal circuits 1: Computational analysis. Cerebral Cortex 22, 3 (2012), 509–526
2012
-
[27]
Joseph Goldberg and Jonathan Helfman. 2011. Eye tracking for visualization eval- uation: Reading values on linear versus radial graphs. Information Visualization 10, 3 (2011), 182–195
2011
-
[28]
Joseph H Goldberg and Jonathan I Helfman. 2010. Comparing information graph- ics: A critical look at eye tracking. In Proceedings of the 3rd BELIV’10 Workshop: BEyond time and errors: novel evaLuation methods for Information Visualization . 71–78
2010
-
[29]
Yi Guo, Nan Cao, Ligan Cai, Yanqiu Wu, Daniel Weiskopf, Danqing Shi, and Qing Chen. 2023. Datamator: An authoring tool for creating datamations via data query decomposition. Applied Sciences 13, 17 (2023), 9709
2023
-
[30]
Yi Guo, Danqing Shi, Mingjuan Guo, Yanqiu Wu, Nan Cao, and Qing Chen
-
[31]
Christopher Healey and James Enns. 2011. Attention and visual memory in visualization and computer graphics. IEEE Transactions on Visualization and Computer Graphics 18, 7 (2011), 1170–1188
2011
-
[32]
Stacie L Hibino. 1999. Task analysis for information visualization. InInternational Conference on Advances in Visual Information Systems . Springer, 139–146
1999
-
[33]
ACM Transactions on Interactive Intelligent Systems 14, 2 (2024), 1–24
Talk2data: A natural language interface for exploratory visual analysis via question decomposition. ACM Transactions on Interactive Intelligent Systems 14, 2 (2024), 1–24
2024
-
[34]
Wenlong Huang, Pieter Abbeel, Deepak Pathak, and Igor Mordatch. 2022. Lan- guage models as zero-shot planners: Extracting actionable knowledge for embod- ied agents. In International Conference on Machine Learning . PMLR, 9118–9147
2022
-
[35]
Wenlong Huang, Fei Xia, Ted Xiao, Harris Chan, Jacky Liang, Pete Florence, Andy Zeng, Jonathan Tompson, Igor Mordatch, Yevgen Chebotar, et al . 2023. Inner monologue: Embodied reasoning through planning with language models. In Conference on Robot Learning . PMLR, 1769–1782
2023
-
[36]
Weidong Huang. 2007. Using eye tracking to investigate graph layout effects. In 2007 6th International Asia-Pacific Symposium on Visualization . IEEE, 97–100
2007
-
[37]
Laurent Itti, Christof Koch, and Ernst Niebur. 1998. A model of saliency-based visual attention for rapid scene analysis. IEEE Transactions on Pattern Analysis and Machine Intelligence (TPAMI) 20, 11 (1998), 1254–1259
1998
-
[38]
Yue Jiang, Zixin Guo, Hamed Rezazadegan Tavakoli, Luis A Leiva, and Antti Oulasvirta. 2024. EyeFormer: Predicting personalized scanpaths with Transformer-guided reinforcement learning. In UIST ’24: Proceedings of the 37th Annual ACM Symposium on User Interface Software and Tec...
2024 doi
-
[39]
Laurent Itti and Christof Koch. 2000. A saliency-based search mechanism for overt and covert shifts of visual attention. Vision Research 40, 10–12 (2000), 1489–1506
2000
-
[40]
Florian Kadner, Yannik Keller, and Constantin Rothkopf. 2021. AdaptiFont: Increasing individuals’ reading speed with a generative font model and Bayesian optimization. In CHI ’21: Proceedings of the 2021 CHI Conference on Human Factors in Computing Systems. Article 585
2021
-
[41]
Matthias Kümmerer, Matthias Bethge, and Thomas SA Wallis. 2022. DeepGaze III: Modeling free-viewing human scanpaths with deep learning. Journal of Vision 22, 5, Article 7 (2022)
2022
-
[42]
Jussi PP Jokinen, Zhenxin Wang, Sayan Sarcar, Antti Oulasvirta, and Xiangshi Ren. 2020. Adaptive feature guidance: Modelling visual search with graphical layouts. International Journal of Human–Computer Studies 136, Article 102376 (2020)
2020
-
[43]
Boyi Li, Philipp Wu, Pieter Abbeel, and Jitendra Malik. 2023. Interactive task planning with language models. arXiv preprint arXiv:2310.10645 (2023)
2023 arXiv
-
[44]
Zhi Li, Yu-Jung Ko, Aini Putkonen, Shirin Feiz, Vikas Ashok, IV Ramakrishnan, Antti Oulasvirta, and Xiaojun Bi. 2023. Modeling touch-based menu selection performance of blind users via reinforcement learning. In CHI ’23: Proceedings of the 2023 CHI Conference on Human Factors ...
2023
-
[45]
Sébastien Lallé, Tiffany Wu, and Cristina Conati. 2020. Gaze-driven links for magazine style narrative visualizations. In 2020 IEEE Visualization Conference (VIS). 166–170
2020
-
[46]
Zhicheng Liu and John Stasko. 2010. Mental models, visual reasoning and inter- action in information visualization: A top-down perspective. IEEE Transactions on Visualization and Computer Graphics 16, 6 (2010), 999–1008
2010
-
[47]
Geoffrey R Loftus and Elizabeth F Loftus. 2019. Human memory: The processing of information. Psychology Press
2019
-
[48]
Jacky Liang, Wenlong Huang, Fei Xia, Peng Xu, Karol Hausman, Brian Ichter, Pete Florence, and Andy Zeng. 2023. Code as policies: Language model programs for embodied control. In 2023 IEEE International Conference on Robotics and Automation (ICRA). IEEE, 9493–9500
2023
-
[49]
Laura E Matzen, Michael J Haass, Kristin M Divis, Zhiyuan Wang, and Andrew T Wilson. 2017. Data visualization saliency model: A tool for evaluating abstract data visualizations. IEEE Transactions on Visualization and Computer Graphics (TVCG) 24, 1 (2017), 563–573
2017
-
[50]
Sounak Mondal, Zhibo Yang, Seoyoung Ahn, Dimitris Samaras, Gregory Zelinsky, and Minh Hoai. 2023. Gazeformer: Scalable, effective and fast prediction of goal- directed human attention. In Proceedings of the IEEE/CVF Conference on Computer Vision and Pattern Recognition (CVPR) ...
2023
-
[51]
Ahmed Masry, Xuan Long Do, Jia Qing Tan, Shafiq Joty, and Enamul Hoque
-
[52]
Saul B Needleman and Christian D Wunsch. 1970. A general method applicable to the search for similarities in the amino acid sequence of two proteins. Journal of Molecular Biology 48, 3 (1970), 443–453. CHI ’25, April 26-May 1, 2025, Yokohama, Japan Shi et al
1970
-
[53]
Truong-Huy D Nguyen, Magy Seif El-Nasr, and Derek M Isaacowitz. 2015. Inter- active visualization for understanding of attention patterns. In Workshop on Eye Tracking and Visualization (ETVIS) . 23–39
2015
-
[54]
Antti Oulasvirta, Jussi PP Jokinen, and Andrew Howes. 2022. Computational rationality as a theory of interaction. In CHI ’22: Proceedings of the 2022 CHI Conference on Human Factors in Computing Systems . Article 359
2022
-
[55]
Roderick Murray-Smith, Antti Oulasvirta, Andrew Howes, Jörg Müller, Aleksi Ikkala, Miroslav Bachinski, Arthur Fleig, Florian Fischer, and Markus Klar. 2022. What simulation can do for HCI research. Interactions 29, 6 (2022), 48–53
2022
-
[56]
Patrik Polatsek, Manuela Waldner, Ivan Viola, Peter Kapec, and Wanda Benesova
-
[57]
Maryam Rezaie, Melanie Tory, and Sheelagh Carpendale. 2024. Struggles and strategies in understanding information visualizations. IEEE Transactions on Visualization and Computer Graphics (2024)
2024
-
[58]
Arvind Satyanarayan, Dominik Moritz, Kanit Wongsuphasawat, and Jeffrey Heer
-
[59]
Richard W Pew. 1966. Acquisition of hierarchical control over the temporal organization of a skill. Journal of Experimental Psychology 71, 5 (1966), 764–771
1966
-
[60]
Hans-Jörg Schulz, Thomas Nocke, Magnus Heitzler, and Heidrun Schumann
-
[61]
Danqing Shi, Antti Oulasvirta, Tino Weinkauf, and Nan Cao. 2024. Understanding and automating graphical annotations on animated scatterplots. In 2024 IEEE 17th Pacific Visualization Conference (PacificVis) . IEEE, 212–221
2024
-
[62]
Danqing Shi, Yang Shi, Xinyue Xu, Nan Chen, Siwei Fu, Hongjin Wu, and Nan Cao. 2019. Task-oriented optimal sequencing of visualization charts. In 2019 IEEE Visualization in Data Science (VDS) . IEEE, 58–66
2019
-
[63]
Danqing Shi, Fuling Sun, Xinyue Xu, Xingyu Lan, David Gotz, and Nan Cao
-
[64]
Danqing Shi, Xinyue Xu, Fuling Sun, Yang Shi, and Nan Cao. 2020. Calliope: Automatic visual data story generation from a spreadsheet. IEEE Transactions on Visualization and Computer Graphics 27, 2 (2020), 453–463
2020
-
[65]
John Schulman, Filip Wolski, Prafulla Dhariwal, Alec Radford, and Oleg Klimov
-
[66]
arXiv preprint arXiv:1707.06347 (2017)
Proximal policy optimization algorithms. arXiv preprint arXiv:1707.06347 (2017)
2017 arXiv
-
[67]
Sungbok Shin, Sanghyun Hong, and Niklas Elmqvist. 2023. Perceptual Pat: A virtual human visual system for iterative visualization design. In CHI ’23: Proceedings of the 2023 CHI Conference on Human Factors in Computing Systems . Article 811
2023
-
[68]
Raghuraj Singh, Chandra Shekhar Yadav, Prabhat Verma, and Vibhash Yadav. 2010. Optical character recognition (OCR) for printed Devnagari script using artificial neural network. International Journal of Computer Science & Communication 1, 1 (2010), 91–95
2010
-
[69]
Ekta Sood, Fabian Kögel, Philipp Müller, Dominike Thomas, Mihai Bâce, and Andreas Bulling. 2023. Multimodal integration of human-like attention in visual question answering. InProceedings of the IEEE/CVF Conference on Computer Vision and Pattern Recognition. 2648–2658
2023
-
[70]
Arjun Srinivasan, Steven M Drucker, Alex Endert, and John Stasko. 2018. Aug- menting visualizations with interactive data facts to facilitate interpretation and communication. IEEE Transactions on Visualization and Computer Graphics 25, 1 (2018), 672–681
2018
-
[71]
Xiangjie Sui, Yuming Fang, Hanwei Zhu, Shiqi Wang, and Zhou Wang. 2023. ScanDMM: A deep Markov model of scanpath prediction for 360deg images. In Proceedings of the IEEE/CVF Conference on Computer Vision and Pattern Recogni- tion(CVPR). 6989–6999
2023
-
[72]
Wanjie Sun, Zhenzhong Chen, and Feng Wu. 2019. Visual scanpath prediction using IOR-ROI recurrent mixture density network. IEEE Transactions on Pattern Analysis and Machine Intelligence 43, 6 (2019), 2101–2118
2019
-
[73]
Hugo Touvron, Thibaut Lavril, Gautier Izacard, Xavier Martinet, Marie-Anne Lachaux, Timothée Lacroix, Baptiste Rozière, Naman Goyal, Eric Hambro, Faisal Azhar, et al. 2023. LLaMA: Open and efficient foundation language models. arXiv preprint arXiv:2302.13971 (2023)
2023 arXiv
-
[74]
Danqing Shi, Yujun Zhu, Jussi PP Jokinen, Aditya Acharya, Aini Putkonen, Shumin Zhai, and Antti Oulasvirta. 2024. CRTypist: Simulating touchscreen typing behavior via computational rationality. In CHI ’24: Proceedings of the 2024 CHI Conference on Human Factors in Computing Sy...
2024
-
[75]
Sungbok Shin, Sunghyo Chung, Sanghyun Hong, and Niklas Elmqvist. 2022. A scanner deeply: Predicting gaze heatmaps on visualizations using crowdsourced eye movement data. IEEE Transactions on Visualization and Computer Graphics (TVCG) 29, 1 (2022), 396–406
2022
-
[76]
Yao Wang, Mihai Bâce, and Andreas Bulling. 2024. Scanpath prediction on information visualisations. IEEE Transactions on Visualization and Computer Graphics (TVCG) 30, 7 (2024), 3902–3914
2024
-
[77]
Yao Wang, Yue Jiang, Zhiming Hu, Constantin Ruhdorfer, Mihai Bâce, and An- dreas Bulling. 2024. VisRecall++: Analysing and predicting visualisation re- callability from gaze behaviour. Proceedings of the ACM on Human–Computer Interaction 8, ETRA, Article 339 (2024)
2024
-
[78]
Yao Wang, Maurice Koch, Mihai Bâce, Daniel Weiskopf, and Andreas Bulling
-
[79]
Yixiu Wang, Bin Wang, Xiaofeng Wu, and Liming Zhang. 2017. Scanpath es- timation based on foveated image saliency. Cognitive Processing 18, 1 (2017), 87–95
2017
-
[81]
Hongjin Wu, Danqing Shi, Nan Chen, Yang Shi, Zhuochen Jin, and Nan Cao
-
[82]
Zhibo Yang, Lihan Huang, Yupei Chen, Zijun Wei, Seoyoung Ahn, Gregory Zelinsky, Dimitris Samaras, and Minh Hoai. 2020. Predicting goal-directed human attention using inverse reinforcement learning. In Proceedings of the IEEE/CVF Conference on Computer Vision and Pattern Recogn...
2020
-
[83]
Sai H Vemprala, Rogerio Bonatti, Arthur Bucker, and Ashish Kapoor. 2024. Chat- GPT for robotics: Design principles and model abilities. IEEE Access 12 (2024)
2024
-
[84]
Ashish Verma and Debashis Sen. 2019. HMM-based convolutional LSTM for visual scanpath prediction. In 2019 27th European Signal Processing Conference (EUSIPCO). 1–5
2019
-
[88]
In Proceedings of the ACM International Symposium on Eye Tracking Research and Applications (ETRA)
Impact of gaze uncertainty on AOIs in information visualisations. In Proceedings of the ACM International Symposium on Eye Tracking Research and Applications (ETRA). Article 60
-
[94]
Zhibo Yang, Sounak Mondal, Seoyoung Ahn, Ruoyu Xue, Gregory Zelinsky, Minh Hoai, and Dimitris Samaras. 2024. Unifying top-down and bottom-up scanpath prediction using Transformers. In Proceedings of the IEEE/CVF Conference on Computer Vision and Pattern Recognition . 1683–1693
2024
-
[2013]
IEEE Transactions on Visualization and Computer Graphics 19, 12 (2013), 2366–2375
A design space of visualization tasks. IEEE Transactions on Visualization and Computer Graphics 19, 12 (2013), 2366–2375
2013
-
[2016]
IEEE Transactions on Visual- ization and Computer Graphics 23, 1 (2016), 341–350
Vega-Lite: A grammar of interactive graphics. IEEE Transactions on Visual- ization and Computer Graphics 23, 1 (2016), 341–350
2016
-
[2017]
Saltinet: Scan-path prediction on 360 degree images using saliency volumes. Chartist: Task-driven Eye Movement Control for Chart Reading CHI ’25, April 26-May 1, 2025, Yokohama, Japan In Proceedings of the IEEE International Conference on Computer Vision Workshops . 2331–2338
2025
-
[2018]
Computers & Graphics 72 (2018), 26–38
Exploring visual attention and saliency modeling for task-based visual analysis. Computers & Graphics 72 (2018), 26–38
2018
-
[2020]
Journal of Visualization 23 (2020), 339–352
VisAct: a visualization design system based on semantic actions. Journal of Visualization 23 (2020), 339–352
2020
-
[2021]
40, 3 (2021), 495–505
AutoClips: An automatic approach to video generation from data facts. 40, 3 (2021), 495–505
2021
-
[2022]
In Findings of the Association for Computational Linguistics: ACL 2022
ChartQA: A benchmark for question answering about charts with visual and logical reasoning. In Findings of the Association for Computational Linguistics: ACL 2022. 2263–2279
2022
-
[2024]
International Conference on Learning Representations
Plan-Seq-Learn: Language model guided RL for solving long horizon robotics tasks. International Conference on Learning Representations
Reviewed August 9, 2026 · model on record in the stance chip above.
Discussion (0). Continue with ORCID to comment.