REVIEW 4 major objections 6 minor 1 cited by
Differential virial analysis: a new technique to determine the dynamical state of molecular clouds
T0 review · 4 major / 6 minor · reviewed 2026-08-10 · deepseek-v4-flash
Pith's one-line read The paper proposes differential virial analysis, which reads a molecular cloud's dynamical state from how its virial ratio changes with surface density, and uses it to show that most giant molecular clouds in Andromeda are inconsistent…
desk verdict A genuinely new diagnostic for GMC dynamical state, well demonstrated in principle; the M31 conclusion is plausible but not yet robust to the CO-to-mass bias the paper itself identifies. read the letter →
The pith
A machine-rendered reading of the paper's core claim, the machinery that carries it, and where it could break.
The reading
What carries the argument
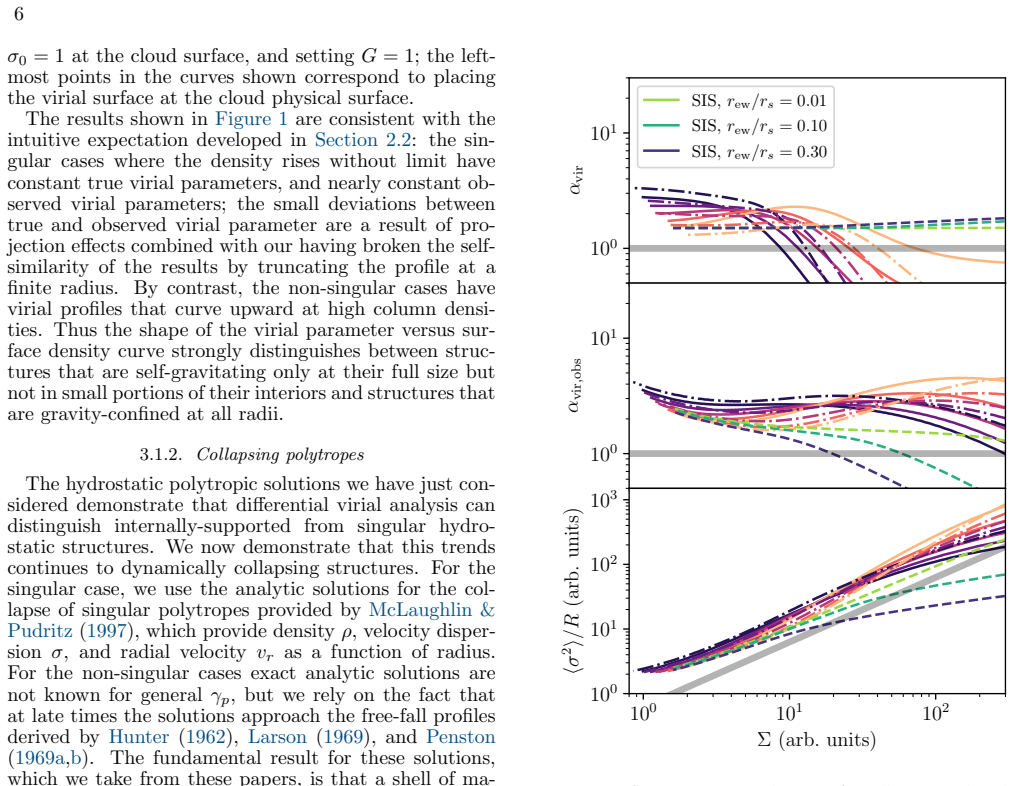
The central object is the differential virial diagram: a plot of σ²/R against mean surface density Σ for nested contour levels within one cloud, where the observer's virial parameter is αvir,obs = 5σ²/(πGΣR) and the line αvir,obs = 1 has unit slope. The diagnostic feature is the 'hook'—a systematic upward turn of αvir,obs at the highest surface densities, which the paper finds in analytic hydrostatic polytropes and in the supported phase of numerical simulations, and which is absent in singular and collapsing configurations. The mechanism is that pressure confinement of small interior substructures raises their kinetic-to-gravitational energy ratio, while in collapse gravity alone sets the energy balance at all scales. The paper also uses simulated CO line observations to show that tracer bias can flatten or steepen the curve, but cannot turn a collapsing cloud into a supported one when dust-calibrated masses are used.
What would settle it
A concrete test: take a cloud that independent observations show is collapsing—for example, one with large-scale inward motion or a singular density profile traced by dust—and measure its differential virial curve with the same contour method; if the curve rises at high surface density instead of staying flat or falling, the claimed hook would no longer be a unique marker of support.
Extended reading notes
Core claim
The central claim is that the differential change of the virial parameter with scale is a reliable dynamical probe even where the absolute virial parameter is not. Around one, the virial ratio αvir ≈ 2T/|W| is about 2 for free-fall collapse and 1 for virial equilibrium, but systematic uncertainties swamp the factor-of-two difference. The paper argues that as nested regions of a single cloud are examined at increasing surface density, a supported cloud shows a rising virial ratio—an upward 'hook' in the virial diagram of σ²/R versus Σ—because small interior regions are unbound and pressure-confined, whereas a globally collapsing cloud has gravity-driven motions on every scale and a virial ratio that stays nearly constant. The paper validates this signature with hydrostatic polytropes and with magnetohydrodynamic simulations that first support then collapse, and it applies the method to 50 Andromeda clouds, finding 32 of 50 (from ¹²CO) and 17 of 26 (from ¹³CO) show the rising signature. It concludes that most Andromeda GMCs cannot be in global collapse, and if global collapse occurs it occupies only a small fraction of cloud lifetimes.
Load-bearing premise
The load-bearing premise is that the internal mass distribution, the viewing geometry, and the importance of magnetic fields do not change systematically with scale within a single cloud, so they shift a cloud's absolute virial ratio but not the shape of its virial curve.
Editorial extensions
If this is right
- Most giant molecular clouds in Andromeda are supported against global collapse, with collapse, if it occurs, confined to brief or local episodes.
- The shape of the virial curve can be measured from any sufficiently deep extragalactic cloud survey, making the method a general tool for dynamical classification.
- Clouds that currently appear flat or falling often show hints of an upturn at the highest densities, so deeper observations should reveal more hooks.
- Agreement between ¹²CO and ¹³CO curve shapes, despite offsets in absolute virial ratio, confirms that differential analysis suppresses the main systematic errors.
- The technique separates local from global collapse within an individual cloud, something population averages and morphology alone cannot do.
Reading between the lines
- If the criterion holds, the hook should be absent or inverted in clouds caught during the brief collapse phase; forthcoming surveys could measure the fraction of collapsing clouds as a function of galactic environment and test what triggers collapse.
- Applying the same differential analysis to optically thin dense-gas tracers or dust-inferred cores should show the hook turning over at the scale of individual prestellar cores, where local collapse begins.
- A testable extension: within a cloud, the strength of the upward hook should anticorrelate with the presence of large-scale infall signatures, such as blue-asymmetric line profiles, if the picture is correct.
- Because the method is shape-based, it may transfer to other self-gravitating systems, such as clumps in high-redshift galaxies, where distance and geometry uncertainties are even larger.
Signed reviews
Editorial analysis
A structured set of objections, weighed in public.
Referee Report
Summary. The paper proposes a new observational technique, 'differential virial analysis,' for determining whether molecular clouds are in a state of global collapse. The key idea is that while the absolute virial ratio is too uncertain to distinguish supported from collapsing clouds, the shape of the virial-parameter versus surface-density curve is diagnostic: supported clouds show an upward 'hook' at high surface density, whereas collapsing clouds have flat or downward-curving profiles. The method is demonstrated on analytic hydrostatic and collapsing polytropes, tested on one set of 3D MHD simulations (Collins et al. 2012) that progresses from supported to collapsing states, and then applied to a sample of GMCs in Andromeda from Lada et al. (2024). The authors find that 32/50 (12CO) and 17/26 (13CO) measured clouds show the rising signature, and conclude that most GMCs in Andromeda are not in a state of global collapse.
Significance. If the central claim holds, the method offers a genuinely useful way around the long-standing factor-of-two systematic uncertainties in absolute virial measurements, because differential shapes within a single cloud are less affected by unknown geometry, distance, and mass-calibration offsets. The paper has clear strengths: the analytic polytrope calculations are exact and cover both supported and collapsing cases; the simulation test uses a realistic MHD simulation that transitions between the two dynamical states; the synthetic-observation analysis in Section 4.3 directly addresses kinematic and line-formation biases; and the authors release their analysis software and data, which will facilitate independent checks. The application to M31 is also a concrete, falsifiable prediction about a real cloud population. However, the M31 conclusion depends on an unquantified systematic bias that the paper itself identifies in Section 4.1, and the numerical validation rests on a single simulation suite; these issues need to be addressed before the strong concluding statement about the Andromeda clouds can be regarded as secure.
major comments (4)
- [Section 5, Eq. (12), and Section 4.1] The central M31 conclusion is not yet protected against the scale-dependent CO-to-mass bias that the paper itself identifies. Because Eq. (12) gives alpha_vir,obs proportional to Sigma^{-1} at fixed sigma^2/R, any systematic underestimation of column density preferentially at high Sigma will steepen the observed virial diagram and can turn a flat or falling collapse profile into a rising 'supported' profile. Section 4.1 explicitly states that if alpha_CO increases toward denser cloud parts, assuming constant alpha_CO will underestimate high-Sigma column densities, 'steepening the virial diagram and pushing collapsing clouds in the direction of appearing supported.' The authors note that M31 velocity dispersions are flat or weakly decreasing with column density, which suggests exactly this regime, but they label this a 'preliminary speculation' and do not correct for it or bound its magnitude. Since the Section 5 surface densities are CO-based and only calibrated against dust for a subset of clouds, the method sits between the paper's 'mixed' and 'line-only' cases, where the bias has not been quantified. The reported counts 32/50 and 17/26, and the conclusion that most M31 GMCs are not globally collapsing, are therefore not yet robust against a systematic the paper itself names.
- [Section 5, classification criteria] The binary classification of clouds as 'rising' versus 'flat/falling' relies on hand-chosen thresholds: alpha_vir must be strictly increasing over the five highest available contour levels, and the value at the highest contour must exceed the mean alpha_vir over all contour levels. No sensitivity analysis is provided, so it is unclear how stable the reported fractions (32/50 and 17/26) are to plausible variations in these criteria. The same applies to the 13CO detection SNR threshold (>=15) used to select contour levels. Because the paper's central observational claim is a numerical statement about the majority of Andromeda GMCs, the authors should quantify how the classification changes when these criteria are varied, or at minimum state the range of fractions obtained under conservative alternatives.
- [Section 6, concluding paragraph] The final paragraph states that in the simulations 'the hook feature is absent at times prior to the onset of global collapse but then appears as collapse begins.' This is the reverse of what Figure 4 shows. In Figure 4 the upward hook is present at t/tff = 0 and 0.1, when the simulation is supported, and flattens at t/tff = 0.3 and 0.6, when collapse has set in. As written, the conclusion asserts the opposite of the demonstrated result and must be corrected to avoid misleading readers about the direction of the diagnostic.
- [Section 3.2 and Section 6] The numerical validation of the method is based on a single simulation suite (Collins et al. 2012, plasma beta = 0.2) at 256^3 effective resolution. The authors acknowledge this limitation ('we have tested only a single particular set of simulations'), but the Section 6 conclusion that differential virial analysis 'can separate these two evolutionary phases' is stated generically. Because the proposed method is intended to be widely applicable, the generality of the numerical demonstration is not yet established. The paper should either add at least one independent simulation with different driving, magnetization, or feedback physics, or explicitly frame the simulation test as a single proof-of-concept case and soften the generalizing language.
minor comments (6)
- [Eq. (36)] Equation (36) contains a sign error: the integrand shows 1 - (vx - <vx>_L)^2, but it should be 1 + (vx - <vx>_L)^2 to match the definition in Eq. (29). As written, the formula could produce negative squared dispersions.
- [Figure 6 caption] The caption says '12CO J = 1 -> 0 (dashed) and 12CO J = 1 -> 0 (dotted)'; the second tracer should be 13CO, not 12CO.
- [Section 5, first paragraph] The phrase 'the 3 sigma_noise noise level' should be 'the 3-sigma noise level'.
- [Figures 7-9, notation] The use of 'alpha_vir/alpha_vir' for the normalized virial ratio is confusing because the same symbol appears in numerator and denominator; using a distinct notation such as <alpha_vir> for the mean would make the figures and text clearer.
- [Section 4.3, line labeling] In the text describing Figure 6, the dashed and dotted curves are said to correspond to '12CO' and '12CO', respectively; the second should be 13CO to match the actual comparison.
- [Section 2.1] The phrase 'commonly-expressed' has an unnecessary hyphen; it should be 'commonly expressed.'
Circularity Check
No significant circularity: the differential virial signature is derived from the virial theorem, tested on independent analytic and simulation models, and applied to M31 without fitting the classification to the data.
full rationale
The paper's central claim is that the shape of the virial-ratio versus surface-density curve distinguishes supported from collapsing clouds. This is not circular. Equation (12), αvir,obs = 5σ^2/R / (πGΣ), defines an observable quantity, but the predicted shape is an additional physical assertion: it is derived from the virial theorem in Section 2.2, demonstrated explicitly for hydrostatic and collapsing polytropes in Section 3.1, and tested against the Collins et al. (2012) simulations in Section 3.2. These analytic solutions and simulations were not constructed to produce the virial-diagram hook; the hook emerges from the calculations. The synthetic-observation tests in Section 4.3 use radiative-transfer modeling to check that plausible observational biases do not erase the signature, again without fitting the signature into the data. In the M31 application (Section 5), the classification of clouds as rising versus flat/falling is a measurement based on predefined criteria (strictly increasing αvir over the highest contours and αvir,N > mean), not a parameter fitted to reproduce the conclusion. The data come from the companion paper Lada et al. (2025) by overlapping authors, but that is a data source, not a load-bearing theoretical premise; the citation does not itself assert the dynamical conclusion. Section 4.1 identifies a real systematic concern—if αCO increases toward high column density, constant-αCO assumptions would steepen the virial diagram and make collapsing clouds appear supported—but the paper labels the relevant counterargument as 'preliminary speculation' and does not hide the limitation. That is an unresolved systematic uncertainty, not a circular reduction of the prediction to its inputs. No uniqueness theorem is imported from prior work by the same authors, no ansatz is smuggled in via self-citation, and no known result is merely renamed. The strongest caveat is that the M31 mass calibration is intermediate between the 'mixed' and 'line-only' cases, leaving the rising-fraction conclusion vulnerable to the Section 4.1 bias; however, this affects robustness and correctness risk, not circularity. Overall, the derivation chain is self-contained against independent external checks, so a low circularity score is appropriate.
Assumptions & free parameters
free parameters (3)
- Minimum contour levels for rising classification =
5
- 13CO detection SNR threshold =
15
- Simulation region size cutoff =
30 pixels
assumptions (5)
- domain assumption Eulerian virial theorem with magnetic and radiation terms dropped, plus assumptions of isothermal gas, spherical virial surface, and negligible mass flux across the surface.
- domain assumption Systematic uncertainties in geometry, mass distribution, and magnetic fields do not vary dramatically with scale within a single cloud, so they affect the location but not the shape of the virial diagram.
- ad hoc to paper The chosen analytic models and the single simulation suite (Collins et al. 2012, beta=0.2) are representative of supported and collapsing cloud states in general.
- domain assumption In the M31 application, line-based velocity dispersions and dust-calibrated masses reflect the true kinematic and column-density structure sufficiently for shape classification.
- domain assumption The flood-fill contour method and the choice to group all area within a contour into one object do not bias the shape classification.
Cite this review
Pith. "Pith review of Differential virial analysis: a new technique to determine the dynamical state of molecular clouds." pith.science (2026). https://pith.science/paper/TVNB63L7
@misc{pith2026250116474,
  author       = {Pith},
  title        = {Pith review of: Differential virial analysis: a new technique to determine the dynamical state of molecular clouds},
  year         = {2026},
  howpublished = {\url{https://pith.science/paper/TVNB63L7}},
  note         = {Machine review of arXiv:2501.16474}
}
read the original abstract
Since molecular clouds form stars, at least some parts of them must be in a state of collapse. However, there is a long-standing debate as to whether that collapse is local, involving only a small fraction of the cloud mass, or global, with most mass in a state of collapse up to the moment when it is dispersed by stellar feedback. In principle it is possible to distinguish these possibilities from clouds' virial ratios, which should be a factor of two larger for collapse than for equilibrium, but systematic uncertainties have thus far prevented such measurements. Here we propose a new analysis method to overcome this limitation: while the absolute value of a cloud's virial ratio is too uncertain to distinguish global from local collapse, the differential change in virial ratio as a function of surface density is also diagnostic of clouds' dynamical state, and can be measured with far fewer systematic uncertainties. We demonstrate the basic principles of the method using simple analytic models of supported and collapsing clouds, validate it from full 3D simulations, and discuss possible challenges in applying the method to real data. We then provide a preliminary application of the technique to recent observations of the molecular clouds in Andromeda, showing that most of them are inconsistent with being in a state of global collapse.
Figures


Figures from the paper (4 more)


Forward citations
Cited by 1 Pith paper
-
Searching for star formation towards the Eos molecular cloud
No young stellar population or kinematic clustering is found toward the Eos cloud, indicating it has not recently formed stars.
Reference graph
Works this paper leans on
-
[1]
Alves, J. F., Lada, C. J., & Lada, E. A. 2001, Nature, 409, 159, doi: 10.1038/35051509
doi:10.1038/35051509 2001
-
[2]
Anderson, M., Peretto, N., Ragan, S. E., et al. 2021, MNRAS, 508, 2964, doi: 10.1093/mnras/stab2674 Andr´ e, P., Belloche, A., Motte, F., & Peretto, N. 2007, A&A, 472, 519, doi: 10.1051/0004-6361:20077422
-
[3]
Armillotta, L., Krumholz, M. R., & Fujimoto, Y. 2018, MNRAS, 481, 5000, doi: 10.1093/mnras/sty2625 Astropy Collaboration, Robitaille, T. P., Tollerud, E. J., et al. 2013, A&A, 558, A33, doi: 10.1051/0004-6361/201322068 Astropy Collaboration, Price-Whelan, A. M., Sip˝ ocz, B. M., et al. 2018, AJ, 156, 123, doi: 10.3847/1538-3881/aabc4f Astropy Collaboratio...
-
[4]
2006, MNRAS, 372, 443, doi: 10.1111/j.1365-2966.2006.10880.x
Ballesteros-Paredes, J. 2006, MNRAS, 372, 443, doi: 10.1111/j.1365-2966.2006.10880.x
arXiv 2006
-
[5]
Heitsch, F., & Zamora-Avil´ es, M. A. 2011, MNRAS, 411, 65, doi: 10.1111/j.1365-2966.2010.17657.x
arXiv 2011
-
[6]
2024, MNRAS, 534, 1043, doi: 10.1093/mnras/stae2036
Ballesteros-Paredes, J., Zamora-Avil´ es, M., Rom´ an-Z´ u˜ niga, C., et al. 2024, MNRAS, 534, 1043, doi: 10.1093/mnras/stae2036
-
[7]
Bertoldi, F., & McKee, C. F. 1992, ApJ, 395, 140, doi: 10.1086/171638
doi:10.1086/171638 1992
-
[8]
Blair, G. N., Evans, N. J., I., Vanden Bout, P. A., & Peters, W. L., I. 1978, ApJ, 219, 896, doi: 10.1086/155853
Show all 75 references
-
[9]
1980, ApJ, 241, 676, doi: 10.1086/158379
Blitz, L., & Thaddeus, P. 1980, ApJ, 241, 676, doi: 10.1086/158379
1980 doi
-
[10]
D., Wolfire, M., & Leroy, A
Bolatto, A. D., Wolfire, M., & Leroy, A. K. 2013, ARA&A, 51, 207, doi: 10.1146/annurev-astro-082812-140944
2013 doi
-
[11]
Bonnor, W. B. 1956, MNRAS, 116, 351, doi: 10.1093/mnras/116.3.351
1956 doi
-
[12]
J., et al
Bosomworth, C., Forbrich, J., Lada, C. J., et al. 2025, MNRAS, 536, 3803, doi: 10.1093/mnras/stae2805
2025 doi
-
[13]
C., & Lazarian, A
Burkhart, B., Collins, D. C., & Lazarian, A. 2015, ApJ, 808, 48, doi: 10.1088/0004-637X/808/1/48
2015 doi
-
[14]
M., Bialy, S., et al
Burkhart, B., Appel, S. M., Bialy, S., et al. 2020, ApJ, 905, 14, doi: 10.3847/1538-4357/abc484
2020 doi
-
[15]
2020, ApJ, 903, 46, doi: 10.3847/1538-4357/abb8d4
Camacho, V., V´ azquez-Semadeni, E., Palau, A., Busquet, G., & Zamora-Avil´ es, M. 2020, ApJ, 903, 46, doi: 10.3847/1538-4357/abb8d4
2020 doi
-
[16]
2023, MNRAS, 523, 3376, doi: 10.1093/mnras/stad1581 16
Camacho, V., V´ azquez-Semadeni, E., Palau, A., & Zamora-Avil´ es, M. 2023, MNRAS, 523, 3376, doi: 10.1093/mnras/stad1581 16
2023 doi
- [17]
-
[18]
Chevance, M., Kruijssen, J. M. D., Hygate, A. P. S., et al. 2020, MNRAS, 493, 2872, doi: 10.1093/mnras/stz3525
2020 doi
-
[19]
C., Kritsuk, A
Collins, D. C., Kritsuk, A. G., Padoan, P., et al. 2012, ApJ, 750, 13, doi: 10.1088/0004-637X/750/1/13
2012 doi
-
[20]
L., Krumholz, M
Dobbs, C. L., Krumholz, M. R., Ballesteros-Paredes, J., et al. 2014, Protostars and Planets VI, 3, doi: 10.2458/azu uapress 9780816531240-ch001
2014 doi
-
[21]
J., Kim, J.-G., & Ostriker, E
Evans, N. J., Kim, J.-G., & Ostriker, E. C. 2022, ApJ, 929, L18, doi: 10.3847/2041-8213/ac6427
2022 doi
-
[22]
J., Heiderman, A., & Vutisalchavakul, N
Evans, II, N. J., Heiderman, A., & Vutisalchavakul, N. 2014, ApJ, 782, 114, doi: 10.1088/0004-637X/782/2/114
2014 doi
-
[23]
M., Lada, C
Faesi, C. M., Lada, C. J., & Forbrich, J. 2018, ApJ, 857, 19, doi: 10.3847/1538-4357/aaad60
2018 doi
-
[24]
Federrath, C., & Klessen, R. S. 2012, ApJ, 761, 156, doi: 10.1088/0004-637X/761/2/156
2012 doi
-
[25]
Feng, Y., & Krumholz, M. R. 2014, Nature, 513, 523, doi: 10.1038/nature13662
2014 doi
-
[27]
J., Viaene, S., & Petitpas, G
Forbrich, J., Lada, C. J., Viaene, S., & Petitpas, G. 2020, ApJ, 890, 42, doi: 10.3847/1538-4357/ab68de
2020 doi
-
[28]
1974, ApJ, 189, 441, doi: 10.1086/152821
Goldreich, P., & Kwan, J. 1974, ApJ, 189, 441, doi: 10.1086/152821
1974 doi
-
[29]
C., Kim, C.-G., & Kim, J.-G
Gong, M., Ostriker, E. C., Kim, C.-G., & Kim, J.-G. 2020, ApJ, 903, 142, doi: 10.3847/1538-4357/abbdab
2020 doi
-
[30]
2016, A&A, 591, A104, doi: 10.1051/0004-6361/201527319
Hacar, A., Alves, J., Burkert, A., & Goldsmith, P. 2016, A&A, 591, A104, doi: 10.1051/0004-6361/201527319
2016 doi
-
[31]
R., Millman, K
Harris, C. R., Millman, K. J., van der Walt, S. J., et al. 2020, Nature, 585, 357, doi: 10.1038/s41586-020-2649-2
2020 doi
-
[32]
2011, ApJ, 743, L29, doi: 10.1088/2041-8205/743/2/L29
Hennebelle, P., & Chabrier, G. 2011, ApJ, 743, L29, doi: 10.1088/2041-8205/743/2/L29
2011 doi
-
[33]
S., et al
Heyer, M., Gutermuth, R., Urquhart, J. S., et al. 2016, A&A, 588, A29, doi: 10.1051/0004-6361/201527681
2016 doi
-
[34]
Heyer, M., Krawczyk, C., Duval, J., & Jackson, J. M. 2009, ApJ, 699, 1092, doi: 10.1088/0004-637X/699/2/1092
2009 doi
-
[35]
Hopkins, P. F. 2013, MNRAS, 430, 1653, doi: 10.1093/mnras/sts704
2013 doi
-
[36]
Hu, C.-Y., Schruba, A., Sternberg, A., & van Dishoeck, E. F. 2022a, ApJ, 931, 28, doi: 10.3847/1538-4357/ac65fd
-
[37]
R., Pokhrel, R., & Gutermuth, R
Hu, Z., Krumholz, M. R., Pokhrel, R., & Gutermuth, R. A. 2022b, MNRAS, 511, 1431, doi: 10.1093/mnras/stac174
-
[38]
1962, ApJ, 136, 594, doi: 10.1086/147410
Hunter, C. 1962, ApJ, 136, 594, doi: 10.1086/147410
1962 doi
-
[39]
Hunter, J. D. 2007, Computing in Science & Engineering, 9, 90, doi: 10.1109/MCSE.2007.55
2007 doi
-
[40]
Jeffreson, S. M. R., Semenov, V. A., & Krumholz, M. R. 2024, MNRAS, 527, 7093, doi: 10.1093/mnras/stad3550
2024 doi
- [41]
-
[42]
2007, ApJ, 668, 1042, doi: 10.1086/521395
Kirk, H., Johnstone, D., & Tafalla, M. 2007, ApJ, 668, 1042, doi: 10.1086/521395
2007 doi
-
[43]
Krumholz, M. R. 2014, MNRAS, 437, 1662, doi: 10.1093/mnras/stt2000
2014 doi
-
[44]
R., Dekel, A., & McKee, C
Krumholz, M. R., Dekel, A., & McKee, C. F. 2012, ApJ, 745, 69, doi: 10.1088/0004-637X/745/1/69
2012 doi
- [45]
-
[46]
R., McKee, C
Krumholz, M. R., McKee, C. F., & Bland -Hawthorn, J. 2019, ARA&A, 57, 227, doi: 10.1146/annurev-astro-091918-104430
2019 doi
- [47]
-
[48]
Lada, C. J. 1976, ApJS, 32, 603, doi: 10.1086/190409
1976 doi
- [49]
- [50]
-
[51]
J., Forbrich, J., Petitpas, G., & Viaene, S
Lada, C. J., Forbrich, J., Petitpas, G., & Viaene, S. 2024, ApJ, 966, 193, doi: 10.3847/1538-4357/ad38bf
2024 doi
-
[52]
Larson, R. B. 1969, MNRAS, 145, 271, doi: 10.1093/mnras/145.3.271
1969 doi
-
[53]
A., Lada, C
Lewis, J. A., Lada, C. J., Bieging, J., et al. 2021, ApJ, 908, 76, doi: 10.3847/1538-4357/abc41f
2021 doi
-
[54]
Lombardi, M., Bouy, H., Alves, J., & Lada, C. J. 2014, A&A, 566, A45, doi: 10.1051/0004-6361/201323293 Mac Low, M.-M., & Klessen, R. S. 2004, Reviews of Modern Physics, 76, 125, doi: 10.1103/RevModPhys.76.125
2014 doi
-
[55]
F., & Holliman, John H., I
McKee, C. F., & Holliman, John H., I. 1999, ApJ, 522, 313, doi: 10.1086/307613
1999 doi
- [56]
-
[57]
E., & Pudritz, R
McLaughlin, D. E., & Pudritz, R. E. 1997, ApJ, 476, 750, doi: 10.1086/303657
1997 doi
- [58]
-
[59]
2007, ApJ, 671, 1820, doi: 10.1086/523265
Lombardi, M. 2007, ApJ, 671, 1820, doi: 10.1086/523265
2007 doi
-
[60]
C., & Hernquist, L
Narayanan, D., Krumholz, M., Ostriker, E. C., & Hernquist, L. 2011, MNRAS, 418, 664, doi: 10.1111/j.1365-2966.2011.19516.x
2011
-
[61]
R., Ostriker, E
Narayanan, D., Krumholz, M. R., Ostriker, E. C., & Hernquist, L. 2012, MNRAS, 421, 3127, doi: 10.1111/j.1365-2966.2012.20536.x
2012
-
[62]
Noriega-Mendoza, H., & Aguilar, L. A. 2018, Rev. Mexicana Astron. Astrofis., 54, 179
2018
-
[63]
Offner, S. S. R., Krumholz, M. R., Klein, R. I., & McKee, C. F. 2008, AJ, 136, 404, doi: 10.1088/0004-6256/136/1/404
2008 doi
-
[64]
R., & Federrath, C
Onus, A., Krumholz, M. R., & Federrath, C. 2018, MNRAS, 479, 1702, doi: 10.1093/mnras/sty1662
2018 doi
-
[65]
Penston, M. V. 1969a, MNRAS, 144, 425, doi: 10.1093/mnras/144.4.425 —. 1969b, MNRAS, 145, 457, doi: 10.1093/mnras/145.4.457
-
[66]
J., Louvet, F., et al
Peretto, N., Rigby, A. J., Louvet, F., et al. 2023, MNRAS, 525, 2935, doi: 10.1093/mnras/stad2453
2023 doi
-
[67]
A., Krumholz, M
Pokhrel, R., Gutermuth, R. A., Krumholz, M. R., et al. 2021, ApJ, 912, L19, doi: 10.3847/2041-8213/abf564
2021 doi
-
[68]
W., Pineda, J
Rosolowsky, E. W., Pineda, J. E., Kauffmann, J., & Goodman, A. A. 2008, ApJ, 679, 1338, doi: 10.1086/587685 Sch¨ oier, F. L., van der Tak, F. F. S., van Dishoeck, E. F., & Black, J. H. 2005, A&A, 432, 369, doi: 10.1051/0004-6361:20041729
2008 doi
-
[69]
Shu, F. H. 1977, ApJ, 214, 488, doi: 10.1086/155274
1977 doi
-
[70]
M., Sun, J., et al
Teng, Y.-H., Sandstrom, K. M., Sun, J., et al. 2023, ApJ, 950, 119, doi: 10.3847/1538-4357/accb86 van der Walt, S., Sch¨ onberger, J. L., Nunez-Iglesias, J., et al. 2014, PeerJ, 2, e453, doi: 10.7717/peerj.453 V´ azquez-Semadeni, E., G´ omez, G. C., Jappsen, A. K., et al. 2007...
2023 doi
-
[71]
J., Petitpas, G., & Faesi, C
Viaene, S., Forbrich, J., Lada, C. J., Petitpas, G., & Faesi, C. 2021, ApJ, 912, 68, doi: 10.3847/1538-4357/abe629
2021 doi
-
[72]
E., et al
Virtanen, P., Gommers, R., Oliphant, T. E., et al. 2020, Nature Methods, 17, 261, doi: 10.1038/s41592-019-0686-2
2020 doi
-
[73]
C., Balakrishnan, N., & Forrey, R
Yang, B., Stancil, P. C., Balakrishnan, N., & Forrey, R. C. 2010, ApJ, 718, 1062, doi: 10.1088/0004-637X/718/2/1062
2010 doi
-
[74]
R., & Burkhart, B
Yuan, Y., Krumholz, M. R., & Burkhart, B. 2020, MNRAS, 498, 2440, doi: 10.1093/mnras/staa2432
2020 doi
- [75]
-
[76]
Zuckerman, B., & Evans, II, N. J. 1974, ApJ, 192, L149, doi: 10.1086/181613 This paper was built using the Open Journal of As- trophysics LATEX template. The OJA is a journal which provides fast and easy peer review for new papers in the astro-ph section of the arXiv, making t...
1974 doi
Reviewed August 10, 2026 · model on record in the stance chip above.
Discussion (0). Continue with ORCID to comment.