REVIEW 4 major objections 6 minor 47 references
OOD Detection with immature Models
T0 review · 4 major / 6 minor · reviewed 2026-08-09 · deepseek-v4-flash
Pith's one-line read Partially trained generative models can match or beat fully converged models at out-of-distribution detection when scored by layer-wise gradient norms, making full convergence unnecessary for this task.
desk verdict A genuinely new observation about immature GLOW checkpoints for OOD detection, but the reported AUROCs are compromised by using the same ID test split for both fitting Gaussian statistics and scoring, plus post-hoc epoch selection; the claim needs a protocol fix before it can be believed. read the letter →
The pith
A machine-rendered reading of the paper's core claim, the machinery that carries it, and where it could break.
The reading
What carries the argument
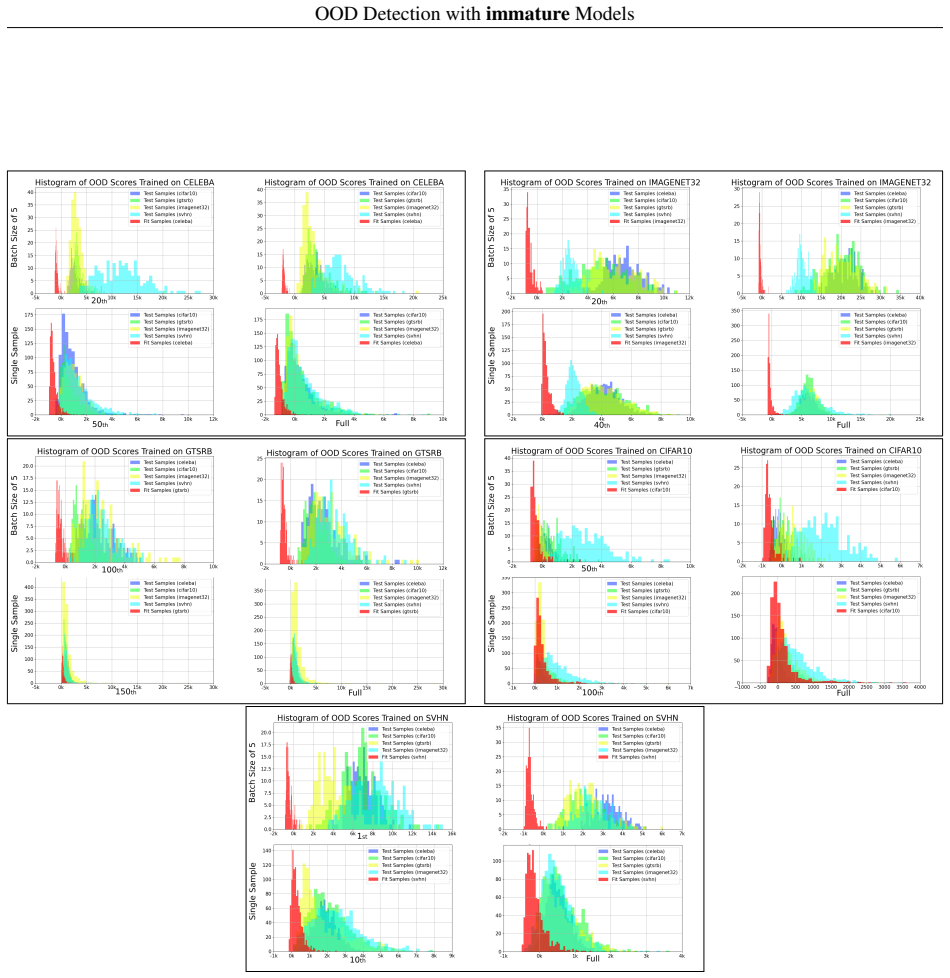
The central object is the layer-wise gradient-norm OOD score from Equations 8–12: for a test sample (or batch of $b$ samples) the model takes one back-propagation step and records the squared $\ell^2$ norm of the gradient of the log-likelihood with respect to each parameter layer, log-transformed so each layer's scores are approximately normal. A Gaussian is fitted to each layer on ID data, and the final score is the summed Gaussian negative log-likelihood across layers (Equation 12). The explanatory mechanism is support overlap between the histograms of these scores for ID and OOD data: when the supports overlap, a deliberately misestimated model of the form $P_\theta = (1/C) P/Q$ can outperform the true density $P$ because the induced likelihood-ratio test is uniformly most powerful by the Neyman-Pearson lemma. The paper uses this mechanism to argue that early checkpoints can produce a wider useful gap, while converged models sometimes let the gap collapse into overlap.
What would settle it
Run GLOW on SVHN (and on one other simple dataset), commit before any test evaluation to a single rule—always use the 10th epoch—and compute AUROC on the held-out OOD test sets. If this fixed-rule checkpoint does not beat or match the fully converged model on most ID/OOD pairs, the paper's claim that immature models are sufficient for OOD detection fails.
Extended reading notes
Core claim
Treating the identity-approximated Fisher information as a Euclidean gradient norm, the paper defines a per-layer OOD score $S_{\boldsymbol\theta^{(l)}}(\mathbf{x}_b)=\log\|\nabla_{\boldsymbol\theta^{(l)}}\sum_b \ell(\mathbf{x}_b)\|_2^2$ and combines layers by fitting a Gaussian to each layer's scores. Applying this score to GLOW checkpoints, it finds that a partially trained model—e.g., SVHN at epoch 10 instead of 250, or Omniglot at epoch 1—achieves AUROC values that are equal to or higher than the fully converged model on almost every reported ID/OOD pair, and that batch-of-five scoring reaches near-perfect separation. The paper explains the result by the support overlap between ID and OOD score histograms: for complex datasets the separating gap appears early and only widens with extra training, while for simple datasets continued training turns an early gap into overlap, degrading detection. The conclusion is that full convergence is not needed for OOD detection, and that the mature-model assumption in prior gradient-based OOD work should be revisited.
Load-bearing premise
The finding depends on picking each dataset's best early checkpoint after seeing the test results, so it does not yet show that a fixed early-stopping rule would work in practice.
Editorial extensions
If this is right
- OOD detection with layer-wise gradient scores can be performed on an early checkpoint of a normalizing flow, substantially reducing training time and energy without sacrificing AUROC.
- For in-distribution datasets that are simpler than the OOD data, full training actively hurts detection because the score gap turns into overlap; a practitioner should stop early.
- For complex in-distribution datasets, a sufficient ID/OOD gap emerges within tens of epochs, so the remaining training only improves image quality, not OOD separation.
- Benchmarking OOD detection methods should no longer assume converged generative models as the only setting; reporting epoch-wise performance would reveal where the useful information is learned.
- Using a batch of five samples for the goodness-of-fit combination makes partial training near-perfect on most reported pairs, including first-epoch Omniglot.
Reading between the lines
- The paper evaluates a grid of checkpoints and reports the best partial epoch per dataset; a prospective stopping rule—such as choosing the epoch with minimal overlap between validation ID/OOD score histograms—would turn this retrospective finding into a practical procedure.
- The support-overlap argument suggests a cheap training diagnostic: monitor the overlap coefficient of gradient-score histograms during training and stop when it stops shrinking, avoiding the cost of full convergence.
- Because the gradient score is defined for any likelihood-based generative model, the same early-training advantage may extend to diffusion models, VAEs, and autoregressive models; the paper only tests GLOW, so this remains an open prediction.
- The Neyman-Pearson argument implies that a model that has not yet learned the full support of the ID distribution can be a better detector than one that has—connecting this result to the broader puzzle of why likelihoods mis-rank OOD data.
Editorial analysis
A structured set of objections, weighed in public.
Referee Report
Summary. The paper studies out-of-distribution (OOD) detection with the GLOW normalizing flow, using layer-wise gradient norms as the OOD score. It claims that partially trained ('immature') models, stopped early, achieve AUROC comparable to or better than fully trained models, and offers a support-overlap explanation. Tables 1 and 2 report AUROC for nine datasets, with scores computed via Gaussian negative log-likelihood over layer-wise log gradient norms (Eq. 12). The authors also release source code.
Significance. If the claim holds under a leakage-free protocol, the finding is practically valuable (reduced compute) and conceptually interesting for understanding training dynamics. The paper's strengths include a simple, falsifiable claim, a broad set of dataset pairs, and public code. However, the current evidence is compromised by calibration/evaluation overlap and post-hoc epoch selection, so the central claim is not yet established.
major comments (4)
- [Section 5.1 (Eqs. 10-12)] The same ID test split is used both to fit the layer-wise Gaussian statistics (mean and variance of log gradient norms) and to compute the ID scores entering the AUROC. Since the OOD scores are always out-of-sample, this calibration/evaluation overlap concentrates the ID score distribution and can inflate AUROC; the inflation is not guaranteed to be constant across training epochs, so it can manufacture or exaggerate the immature-model advantage. Please refit the statistics on a held-out split (e.g., a validation split) and re-report all AUROC numbers.
- [Tables 1 and 2] For each ID dataset, the reported 'partial training' epoch is selected from the checkpoint grid after seeing the AUROC results (e.g., SVHN epoch 10, CelebA epoch 50, CIFAR-10 epoch 100, GTSRB epoch 150, ImageNet32 epoch 40). This makes the headline comparison a selected-best result rather than a demonstrated stopping policy. Please report AUROC for all evaluated checkpoints, or commit to a pre-specified early-stopping rule, and show that the immature-model advantage survives under that rule.
- [Section 4] The proposed explanation constructs a model P_theta(x) proportional to P(x)/Q(x), which requires knowledge of the OOD distribution Q, whereas the paper's setting is unsupervised OOD detection without access to OOD data at training time. Moreover, the Neyman-Pearson optimality argument applies to tests based on the likelihood ratio, not to the layer-wise gradient score S_theta(x) of Eq. 12; no formal link is provided. As a result, the explanation is not connected to the reported gradient-based results and should be either derived rigorously or presented as a heuristic.
- [Section 5 and Appendix D] All AUROC numbers come from a single training run per dataset and one GLOW architecture, with no standard errors or multiple seeds; many differences in Tables 1 and 2 are in the third or fourth decimal place (e.g., the KMNIST rows for b=5). Without variance estimates, the reader cannot tell whether the reported partial-vs-mature differences are statistically meaningful. Please provide at least 3-5 seeds with error bars, or state precisely which differences are robust.
minor comments (6)
- [Throughout] The model name is spelled inconsistently ('GLOW' vs. 'Glow'); standardize to one form.
- [References] The same work by Zhang, Goldstein, and Ranganath is cited as both 'L. Zhang et al., 2021' and 'L. H. Zhang et al., 2021'; unify the citation and the reference entry.
- [Figure 3 caption] The caption does not define which checkpoint counts as 'partially trained' and which as 'fully trained' in the left and right panels, and the axes are not labeled; add this information.
- [Table 1 caption] The caption states that epochs are 'sampled from every tenth epoch,' but the Omniglot row uses the 1st epoch; reconcile this wording with the actual protocol.
- [Section D] The abbreviation 'ACL layers' appears to be a typo for 'affine coupling layers'; correct it.
- [Section 4] The notation phi_Ptheta and phi_P is used without definition; define these test statistics before stating the inequality.
Circularity Check
No equation-level or self-citation circularity; the central immature-vs-mature AUROC comparison is an empirical evaluation, with same-split Gaussian fitting and post-hoc epoch selection flagged as non-circular correctness risks.
full rationale
The paper's derivation chain is not circular. Equations (1)-(8) define gradient-based scores using standard approximations (identity FIM, log-normal layer norms), and Eqs. (9)-(12) combine layer-wise log-norms via fitted Gaussian statistics; no target quantity (e.g., the AUROC or the immature-vs-mature comparison) appears in the definition of the score or the training objective. The central claim is supported by direct AUROC evaluations on GLOW checkpoints (Tables 1-2), and those scores are not defined in terms of the claim they support. The paper does cite prior work (Dauncey et al., Choi et al., Zhang et al.) for the score construction and the support-overlap explanation, but these citations are external and not load-bearing self-citations; they provide the baseline method rather than the paper's new finding. Two concerns should be weighed but do not constitute circularity: (i) Section 5.1 uses the ID test split both to fit the Gaussian statistics in Eqs. (10)-(11) and to draw the 1,000 ID samples scored by Eq. (12), making the ID scores in-sample; this is an evaluation-leakage risk that can inflate AUROC, but it is not a derivation that reduces the prediction to its inputs. (ii) The partial epochs reported in Tables 1-2 are selected post hoc from a checkpoint grid without a fixed early-stopping rule, so the headline 'partial training wins' is partly a selected-best result; again, this is selection bias rather than circular reasoning. The paper's stated limitations (only GLOW, only image data) further limit generality but do not create a circular chain. Overall, the core empirical claim has independent content and is not forced by definition or by self-citation.
Assumptions & free parameters
free parameters (1)
- Partial training epoch checkpoint per ID dataset =
Varies per dataset; e.g., SVHN 10th, CelebA 50th, CIFAR-10 100th, ImageNet32 40th, Omniglot 1st
assumptions (4)
- domain assumption Layer-wise log-gradient norm scores are approximately normally distributed (Eq 10-12).
- domain assumption The Fisher Information Matrix is approximated as the identity (Eq 7), reducing the FIM norm to the Euclidean norm.
- domain assumption GLOW is representative of likelihood-based deep generative models for this phenomenon.
- domain assumption The support-overlap explanation constructs P_theta proportional to P/Q and invokes the Neyman-Pearson lemma (Section 4).
Cite this review
Pith. "Pith review of OOD Detection with immature Models." pith.science (2026). https://pith.science/paper/UCJQM3PW
@misc{pith2026250200820,
  author       = {Pith},
  title        = {Pith review of: OOD Detection with immature Models},
  year         = {2026},
  howpublished = {\url{https://pith.science/paper/UCJQM3PW}},
  note         = {Machine review of arXiv:2502.00820}
}
read the original abstract
Likelihood-based deep generative models (DGMs) have gained significant attention for their ability to approximate the distributions of high-dimensional data. However, these models lack a performance guarantee in assigning higher likelihood values to in-distribution (ID) inputs, data the models are trained on, compared to out-of-distribution (OOD) inputs. This counter-intuitive behaviour is particularly pronounced when ID inputs are more complex than OOD data points. One potential approach to address this challenge involves leveraging the gradient of a data point with respect to the parameters of the DGMs. A recent OOD detection framework proposed estimating the joint density of layer-wise gradient norms for a given data point as a model-agnostic method, demonstrating superior performance compared to the Typicality Test across likelihood-based DGMs and image dataset pairs. In particular, most existing methods presuppose access to fully converged models, the training of which is both time-intensive and computationally demanding. In this work, we demonstrate that using immature models,stopped at early stages of training, can mostly achieve equivalent or even superior results on this downstream task compared to mature models capable of generating high-quality samples that closely resemble ID data. This novel finding enhances our understanding of how DGMs learn the distribution of ID data and highlights the potential of leveraging partially trained models for downstream tasks. Furthermore, we offer a possible explanation for this unexpected behaviour through the concept of support overlap.
Figures


Figures from the paper (6 more)




Reference graph
Works this paper leans on
-
[1]
Bartlett, M. S., & Kendall, D. G. (1946). The statistical analysis of variance-heterogeneity and the logarithmic transformation.Supplement to the Journal of the Royal Statistical Society,8(1), 128–138. Retrieved September 1, 2024, from http://www.jstor.org/stable/2983618
-
[2]
Bengio, Y., Courville, A. C., & Vincent, P. (2012). Unsupervised feature learning and deep learning: A review and new perspectives.CoRR,abs/1206.5538. http://arxiv.org/abs/1206.5538
arXiv 2012
-
[3]
D., Senetaire, H., Schmutz, H., Maaløe, L., Hauberg, S., & Frellsen, J
Bergamin, F., Mattei, P.-A., Havtorn, J. D., Senetaire, H., Schmutz, H., Maaløe, L., Hauberg, S., & Frellsen, J. (2022). Model-agnostic out-of-distribution detection using combined statistical tests.International Conference on Artificial Intelligence and Statistics, 10753–10776
work page 2022
-
[4]
Bishop, C. M. (1994). Novelty detection and neural network validation.IEE Proceedings-Vision, Image and Signal Processing,141(4), 217–222
work page 1994
-
[5]
Chen, D., & Ye, W. (2024). Generalized groves of neural additive models: Pursuing transparent and accurate machine learning models in finance. https://arxiv.org/abs/2209.10082
work page Pith review arXiv 2024
-
[6]
Choi, H., Jang, E., & Alemi, A. A. (2019). Waic, but why? generative ensembles for robust anomaly detection. https://arxiv.org/abs/1810.01392
arXiv 2019
-
[7]
Choi, J., Yoon, C., Bae, J., & Kang, M. (2021). Robust out-of-distribution detection on deep probabilistic generative models
work page 2021
-
[8]
Perret-Gentil, D. C., & Polak, R. (2020). Concepts of design assurance for neural networks (codann).Public Report Extract Version 1.0. https://www.easa.europa.eu/en/document-library/general-publications/concepts- design-assurance-neural-networks-codann
work page 2020
Show all 47 references
-
[9]
Dauncey, S., Holmes, C., Williams, C., & Falck, F. (2024). Approximations to the fisher information metric of deep generative models for out-of-distribution detection. https://arxiv.org/abs/2403.01485 Dauncey,S.,Holmes,C.C.,Williams,C.,&Falck,F.(2023).Ongradientsofdeepgenerati...
2024 arXiv
-
[10]
L., & LaRiccia, V
Eubank, R. L., & LaRiccia, V. N. (1992). Asymptotic Comparison of Cramer-von Mises and Nonparametric Function Estimation Techniques for Testing Goodness-of-Fit.The Annals of Statistics, 20(4), 2071–2086. https: //doi.org/10.1214/aos/1176348903
1992
-
[11]
Fisher, R. A. (1920). A mathematical examination of the methods of determining the accuracy of observation by the mean error, and by the mean square error.Monthly Notices of the Royal Astronomical Society, 80(8), 758–770. https://doi.org/10.1093/mnras/80.8.758
1920 doi
-
[12]
George, T., Laurent, C., Bouthillier, X., Ballas, N., & Vincent, P. (2018). Fast approximate natural gradient descent in a kronecker-factored eigenbasis.CoRR,abs/1806.03884. http://arxiv.org/abs/1806.03884
2018 arXiv
-
[13]
right to explanation
Goodman, B., & Flaxman, S. (2017). European union regulations on algorithmic decision making and a “right to explanation”.AI Magazine, 38(3), 50–57. https://doi.org/10.1609/aimag.v38i3.2741
2017 doi
-
[14]
Haroush, M., Frostig, T., Heller, R., & Soudry, D. (2021). Statistical testing for efficient out of distribution detection in deep neural networks.CoRR,abs/2102.12967. https://arxiv.org/abs/2102.12967 Havtorn,J.D.,Frellsen,J.,Hauberg,S.,&Maaløe,L.(2021).Hierarchicalvaesknowwha...
2021 arXiv
-
[15]
Hendrycks, D., Mazeika, M., & Dietterich, T. G. (2018). Deep anomaly detection with outlier exposure.CoRR, abs/1812.04606. http://arxiv.org/abs/1812.04606
2018 arXiv
-
[16]
Ho, J., Jain, A., & Abbeel, P. (2020). Denoising diffusion probabilistic models.CoRR, abs/2006.11239. https: //arxiv.org/abs/2006.11239
2020 arXiv
-
[17]
L., Cresswell, J
Kamkari, H., Ross, B. L., Cresswell, J. C., Caterini, A. L., Krishnan, R. G., & Loaiza-Ganem, G. (2024). A geometric explanation of the likelihood ood detection paradox. https://arxiv.org/abs/2403.18910
2024 arXiv
-
[18]
P., & Welling, M
Kingma, D. P., & Welling, M. (2014). Auto-encoding variational bayes.arXiv preprint arXiv:1312.6114
2014 arXiv
-
[19]
P., & Dhariwal, P
Kingma, D. P., & Dhariwal, P. (2018). Glow: Generative flow with invertible 1x1 convolutions. In S. Bengio, H
2018
-
[20]
Larochelle, K
Wallach, H. Larochelle, K. Grauman, N. Cesa-Bianchi, & R. Garnett (Eds.),Advances in neural information processing systems(Vol. 31). Curran Associates, Inc. https://proceedings.neurips.cc/paper/2018/file/ d139db6a236200b21cc7f752979132d0-Paper.pdf
2018
-
[21]
C., Veness, J., Desjardins, G., Rusu, A
Kirkpatrick, J., Pascanu, R., Rabinowitz, N. C., Veness, J., Desjardins, G., Rusu, A. A., Milan, K., Quan, J., Ramalho, T., Grabska-Barwinska, A., Hassabis, D., Clopath, C., Kumaran, D., & Hadsell, R. (2016). Overcoming catastrophic forgetting in neural networks.CoRR, abs/1612...
2016 arXiv
-
[22]
LeCun, Y., Chopra, S., Hadsell, R., Ranzato, M., & Huang, F. J. (2006). A tutorial on energy-based learning.Predicting structured data, 1–57
2006
-
[23]
T., Ting, K
Liu, F. T., Ting, K. M., & Zhou, Z.-H. (2012). Isolation-based anomaly detection.ACM Trans. Knowl. Discov. Data, 6(1). https://doi.org/10.1145/2133360.2133363
2012
-
[24]
P., & Wagenmakers, E.-J
Ly, A., Marsman, M., Verhagen, J., Grasman, R. P., & Wagenmakers, E.-J. (2017). A tutorial on fisher information. Journal of Mathematical Psychology,80, 40–55. https://doi.org/https://doi.org/10.1016/j.jmp.2017.05.006
2017 doi
-
[25]
Martens, J. (2016). Second-order optimization for neural networks[PhD Thesis]. University of Toronto. http: //hdl.handle.net/1807/71732
2016
-
[26]
Morningstar, W., Ham, C., Gallagher, A., Lakshminarayanan, B., Alemi, A., & Dillon, J. (2021). Density of states estimation for out of distribution detection. In A. Banerjee & K. Fukumizu (Eds.),Proceedings of the 24th international conference on artificial intelligence and st...
2021
-
[27]
W., & Lakshminarayanan, B
Nalisnick, E., Matsukawa, A., Teh, Y. W., & Lakshminarayanan, B. (2019). Detecting out-of-distribution inputs to deep generative models using typicality. https://arxiv.org/abs/1906.02994
2019 arXiv
-
[28]
Neyman, J., & Pearson, E. (1933). On the problem of the most efficient tests of statistical hypotheses.Philosophical Transactions of the Royal Society A: Mathematical, Physical and Engineering Sciences, 231, 289–337
1933
-
[29]
Oord, A. v. d., Dieleman, S., Zen, H., et al. (2016). Wavenet: A generative model for raw audio.arXiv preprint arXiv:1609.03499
2016 arXiv
-
[30]
Oord, A. v. d., Kalchbrenner, N., & Kavukcuoglu, K. (2016). Pixel recurrent neural networks.International Conference on Machine Learning, 1747–1756
2016
-
[31]
J., Mohamed, S., & Lakshminarayanan, B
Papamakarios, G., Nalisnick, E., Rezende, D. J., Mohamed, S., & Lakshminarayanan, B. (2021). Normalizing flows for probabilistic modeling and inference.The Journal of Machine Learning Research,22(1), 2617–2680
2021
-
[32]
Pope, P., Zhu, C., Abdelkader, A., Goldblum, M., & Goldstein, T. (2021). The intrinsic dimension of images and its impact on learning.CoRR,abs/2104.08894. https://arxiv.org/abs/2104.08894
2021 arXiv
-
[33]
J., Fertig, E., Snoek, J., Poplin, R., Depristo, M., Dillon, J., & Lakshminarayanan, B
Ren, J., Liu, P. J., Fertig, E., Snoek, J., Poplin, R., Depristo, M., Dillon, J., & Lakshminarayanan, B. (2019). Likelihood ratios for out-of-distribution detection. In H. Wallach, H. Larochelle, A. Beygelzimer, F. d’Alché-Buc, E. Fox, & R. Garnett (Eds.),Advances in neural in...
2019
-
[34]
J., Mohamed, S., & Wierstra, D
Rezende, D. J., Mohamed, S., & Wierstra, D. (2014). Stochastic backpropagation and approximate inference in deep generative models.International Conference on Machine Learning, 1278–1286
2014
-
[35]
Salimans, T., Karpathy, A., Chen, X., & Kingma, D. P. (2017). Pixelcnn++: Improving the pixelcnn with discretized logistic mixture likelihood and other modifications.CoRR,abs/1701.05517. http://arxiv.org/abs/1701.05517 Schirrmeister,R.,Zhou,Y.,Ball,T.,&Zhang,D.(2020).Understan...
2017 arXiv
-
[36]
Shannon, C. E. (1948). A mathematical theory of communication.The Bell System Technical Journal, 27(3), 379–423. https://doi.org/10.1002/j.1538-7305.1948.tb01338.x
1948
-
[37]
Sohl-Dickstein, J., Weiss, E., Maheswaranathan, N., & Ganguli, S. (2015). Deep unsupervised learning using nonequilibriumthermodynamics.InF.Bach&D.Blei(Eds.), Proceedingsofthe32ndinternationalconference onmachinelearning (pp.2256–2265,Vol.37).PMLR.https://proceedings.mlr.press...
2015
-
[38]
Su, H., & Lee, J. (2024). Machine learning approaches for diagnostics and prognostics of industrial systems using open source data from phm data challenges: A review. https://arxiv.org/abs/2312.16810
2024 arXiv
-
[39]
Varoquaux, G., & Cheplygina, V. (2022). Machine learning for medical imaging: Methodological failures and recommendations for the future.npj Digital Medicine, 5(1). https://doi.org/10.1038/s41746-022-00592-y
2022 doi
-
[40]
Voronin, S., Siddique, A., & Iqbal, M. (2024). Enhancing object detection accuracy in autonomous vehicles using synthetic data. https://arxiv.org/abs/2411.15602
2024 arXiv
-
[41]
Walker, S. G. (2021). A new measure of overlap: An alternative to the p–value. https://arxiv.org/abs/2106.01821
2021 arXiv
-
[42]
Wei, H., Xie, R., Cheng, H., Feng, L., An, B., & Li, Y. (2022). Mitigating neural network overconfidence with logit normalization. https://arxiv.org/abs/2205.09310
2022 arXiv
-
[43]
Weitzman, M. S. (1970). Measures of overlap of income distributions of white and negro families in the united states. Journal of the American Statistical Association,65(330), 578–588
1970
-
[44]
Xiao, Z., Yan, Q., & Amit, Y. (2020). Likelihood regret: An out-of-distribution detection score for variational auto-encoder.CoRR,abs/2003.02977. https://arxiv.org/abs/2003.02977
2020 arXiv
-
[45]
Xie, J., Lu, Y., Gao, R., et al. (2016). Theories and models of energy-based models.arXiv preprint arXiv:1611.01799
2016 arXiv
-
[46]
Zhang, L., Goldstein, M., & Ranganath, R. (2021). Understanding failures in out-of-distribution detection with deep generative models.International Conference on Machine Learning, 12427–12436. 12 OOD Detection withimmatureModels
2021
-
[47]
H., Goldstein, M., & Ranganath, R
Zhang, L. H., Goldstein, M., & Ranganath, R. (2021). Understanding failures in out-of-distribution detection with deep generative models.CoRR, abs/2107.06908. https://arxiv.org/abs/2107.06908 A Additional Results This section provides a comprehensive overview of how partial tr...
2021 arXiv
Reviewed August 9, 2026 · model on record in the stance chip above.
Discussion (0). Continue with ORCID to comment.