REVIEW 2 major objections 5 minor 1 cited by
Fine-structure Line Atlas for Multi-wavelength Extragalactic Study (FLAMES) II: Photoionization Model View of Ionized to Neutral Gas Emission
T0 review · 2 major / 5 minor · reviewed 2026-08-06 · deepseek-v4-flash
Pith's one-line read A five-parameter power law captures the ratios of far-infrared fine-structure lines, leaving three independent ISM quantities.
desk verdict A genuinely useful FIR-line diagnostic paper whose power-law scalings are solid but conditional on the dust-radiation-pressure-free grid; deserves peer review with requested revisions. read the letter →
The pith
A machine-rendered reading of the paper's core claim, the machinery that carries it, and where it could break.
The reading
What carries the argument
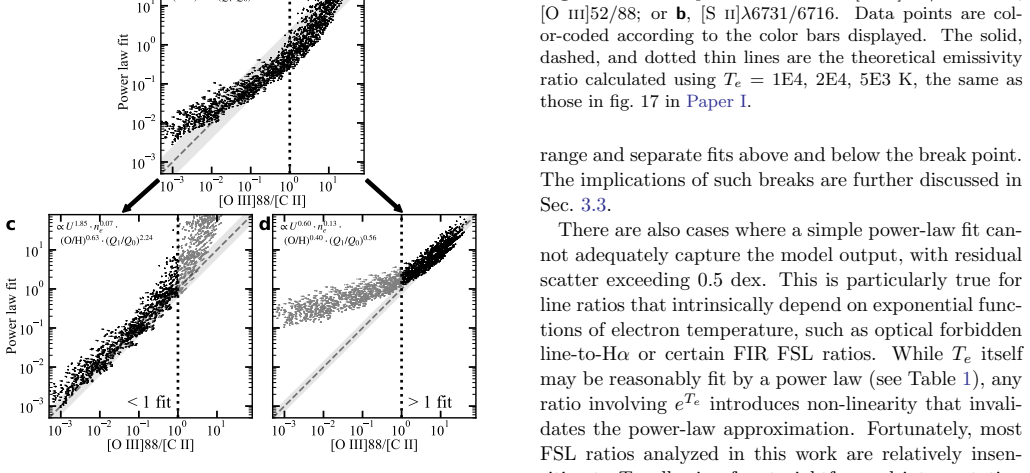
The load-bearing object is the five-parameter power-law fit of Eq. 1, applied to every diagnosed line ratio over the photoionization grid; the fitted exponent of each parameter is the claim about what that ratio traces. The grid itself is the supporting mechanism, computed with the Cloudy photoionization code as a plane-parallel, constant-gas-pressure slab including dust, PAHs, CMB, X-rays, and cosmic rays, with radiation hardness defined as $Q_1/Q_0$ (helium-ionizing to total ionizing photon luminosity ratio). Segmented fits above and below a break in ratios such as [O iii]88/[C ii] handle the shift of the dominant oxygen and nitrogen ionization stage, and the residual scatter quoted for each fit measures how completely the power law closes over the grid.
What would settle it
Measure [N iii]/[O iii]88 and [O iii]88/[C ii] in galaxies with independently known N/O, $n_e$, and ionizing spectral hardness; the model predicts an almost exactly linear slope for the N/O diagnostic (index 1.0) and $U_1$ scaling near index 1.2 for [O iii]88/[C ii], so a slope outside the reported scatter would falsify the mapping. A rerun of the grid with dust radiation pressure included is the second check: if the Table 1 exponents shift by more than their residual scatter, the diagnostics inherit the neglected-pressure structure.
Extended reading notes
Core claim
The central discovery is a quantitative mapping from observable line ratios to physical conditions. Using a grid of 20,446 photoionization models computed in a single plane-parallel, constant-pressure structure that contains both the H ii region and the PDR, the authors fit each ratio as a product of power laws (Eq. 1) in $U$, $n_e$, N/O, O/H, and $Q_1/Q_0$. The fits show that high-to-low ionization ratios such as [O iii]88/[C ii] and [N iii]/[N ii] are governed by the composite helium-ionization parameter $U_1=U(Q_1/Q_0)$, that [Ne iii]/[Ne ii] scales about as $U(Q_1/Q_0)^3$ and therefore breaks the $U$--$Q_1/Q_0$ degeneracy, and that [N iii]/[O iii]88 and [N ii]/[C ii] track N/O nearly linearly. The observed tightness of galaxy relations is attributed to marginalization: real galaxies sit near $n_e\approx 50$ cm$^{-3}$ and follow an O/H--$U$--$Q_1/Q_0$ correlation, so the apparent one-parameter drivers are not single physical variables. The authors conclude that the eight standard FIR lines contain about three independent pieces of information, fixing only $U_1$, $n_e$, and N/O.
Load-bearing premise
Everything rests on treating a single plane-parallel, constant-gas-pressure slab, run to $A_V=100$ mag or $T_e=10$ K with dust radiation pressure turned off, as an adequate stand-in for the luminosity-averaged, galaxy-integrated line emission; the paper itself shows that including dust radiation pressure cuts the slab depth by more than half, lowers $U$ by 0.5 dex, and caps $\log U$ near $-2$.
Editorial extensions
If this is right
- A galaxy's FIR fine-structure spectrum carries at most three independent ISM numbers: $U_1$, $n_e$, and N/O, fixed respectively by [O iii]88/[C ii] (or [N iii]/[N ii]122), by [N ii]122/205 or [O i]145/[C ii], and by [N iii]/[O iii]88 or [N ii]/[C ii].
- The steep $Q_1/Q_0$ dependence of [Ne iii]/[Ne ii] provides the practical lever for separating ionization parameter from radiation hardness, which oxygen ratios alone cannot do.
- Tight observed correlations among FIR ratios reflect small real variation in $n_e$ (near 50 cm$^{-3}$) plus an intrinsic O/H--$U$--$Q_1/Q_0$ correlation, rather than a single dominant physical parameter.
- MIR and optical lines remain necessary for recovering $Q_1/Q_0$, O/H, and electron temperature separately, so FIR-only studies of the ISM hit a fundamental information barrier.
Reading between the lines
- If the three-parameter saturation is correct, adding more FIR lines beyond the standard set will not break the $U_1$--$n_e$--N/O degeneracy; the next gains come from joint FIR/optical/MIR fitting or from resolved maps that separate H ii regions from PDRs.
- The dust-radiation-pressure cap, $U$ below roughly $0.005(D/G)^{-1/2}(Q_1/Q_0)^{1/3}$, suggests a testable explanation for why compact dusty H ii regions and some high-redshift systems appear to sit at lower effective $U$ than local dwarf galaxies.
- The model's persistent over-prediction of [O i]63/[O i]145 relative to the observed value near 10 points to missing neutral-gas physics or unresolved [O i]63 self-absorption; resolved observations of individual star-forming regions could locate the discrepancy.
Editorial analysis
A structured set of objections, weighed in public.
Referee Report
Summary. This paper presents the second installment of the FLAMES series, using a large grid of Cloudy photoionization models (20,446 converged models) to interpret far- and mid-infrared fine-structure line ratios from both ionized and neutral gas phases in a unified plane-parallel, constant-gas-pressure framework. The authors fit multi-dimensional power laws (Eq. 1) to line ratios as functions of ionization parameter U, electron density ne, abundance ratios N/O and O/H, and radiation hardness Q1/Q0. They report fitted indices (Table 1), identify segmented (broken) power-law behavior in high-to-low ionization ratios, compare model predictions to the empirical relations from Paper I, and argue that FIR FSLs effectively constrain only three independent physical parameters: U1 = U × (Q1/Q0), ne, and N/O. The paper also discusses parameter marginalization, the degeneracy between U and Q1/Q0, and the role of dust radiation pressure, explicitly acknowledging that the default grid neglects radiation pressure.
Significance. If the fitted power laws are robust, this paper provides a valuable quantitative framework for interpreting FIR FSL observations and for understanding why galaxy-integrated line ratios often form tight empirical sequences. The public model catalog (Appendix A, Table 2) and the explicit, candid discussion of model failures (e.g., the [O i]63/145 ratio, residual scatter above 0.5 dex, and the radiation-pressure issue) are strengths. The paper is also careful to distinguish parameter degeneracies and marginalization effects, which is a useful contribution to the field. The main uncertainty is whether the quantitative indices in Table 1 survive a more complete treatment of dust radiation pressure; the authors themselves show in Sec. 4.3.1 that this modeling choice alters the gas structure substantially.
major comments (2)
- [Sec. 4.3.1 and Table 1] The central quantitative claim—that FIR FSL ratios are captured by the Eq. (1) power law with the indices in Table 1, and that they constrain only U1, ne, and N/O—is derived from the default grid, which assumes constant gas pressure and neglects dust radiation pressure (Sec. 2.1). In Sec. 4.3.1, the authors show that including radiation pressure at constant total pressure reduces model depth by more than half, lowers output log U by ~0.5 dex, raises the neutral gas column by ~0.5 dex, and caps output log U below about -2 at high D/G (Fig. 15 and 16). This is a structural change large enough to affect the least-squares exponents in Table 1, yet the paper does not report how those exponents would change under the radiation-pressure-inclusive grid, even for the parameter range where that grid is not deemed unphysical. The quoted indices (e.g., [N iii]/[O iii] with N/O index 1.00, and [Ne iii]/[Ne ii] scaling as U × (Q1/Q0)^3) are therefore presented without a robustness check. I ask the authors to either (a) fit Eq. (1) on a radiation-pressure-inclusive grid (or on a sub-grid restricted to parameter combinations where the unphysical density jumps are mild) and show that the Table 1 indices remain consistent within some tolerance, or (b) explicitly qualify, in the abstract and summary, that all fitted indices and the three-parameter constraint are conditional on the gas-pressure-only assumption. As written, the headline 'tracer' interpretation has not been shown to survive this modeling choice.
- [Table 1] No uncertainties are reported for the fitted power-law indices x1–x5 (only the residual scatter Δ is given). Since the paper's interpretation relies on distinguishing e.g. an index of 1.00 for [N iii]/[O iii] vs N/O from an index of 0.97 or 1.05, standard errors or bootstrap confidence intervals are needed to assess whether differences between indices are significant. Please add uncertainties to each fitted index and describe the least-squares weighting (equal weights per model? any outlier rejection?).
minor comments (5)
- [Table 1] In the [O iii]88/[C ii] row, the residual scatter column reads '0.38.0.16,0.24', which appears to be a typo for '0.38,0.16,0.24'. Please correct.
- [Sec. 2.1] The sentence 'Dust is included in both neutral and ionized gas, as its presence ... is importance in the heating' contains a grammatical error; 'is importance' should be 'is important'.
- [Sec. 3.1 and Table 1] The segmented-fit thresholds (e.g., [O iii]88/[C ii] >1/<1, [N iii]/[N ii]122 >5/<5, [N iii]/[N ii]205 >10/<10) appear arbitrary. The paper should state how these thresholds were chosen and whether the break points were fit as free parameters or fixed a priori; otherwise, the reported residual scatter for the segmented fits may be optimistically biased.
- [Fig. 10 caption] The caption contains typos: 'bsfc- e (middel)' should likely be '(b)–(e) (middle)'.
- [Sec. 4.3.1] The paper uses the scaling from the radiation-pressure-inclusive models (Fig. 16, U < 0.005 (D/G)^-1/2 (Q1/Q0)^1/3) to argue for the O/H–U–Q1/Q0 correlation, while simultaneously stating that such models produce unphysical structures and 'should not be used for normalization'. Please clarify the logical status of this scaling relation: if the models are unphysical, why are their scaling relations considered informative?
Circularity Check
No significant circularity: the Table 1 exponents are least-squares fits to an independently computed Cloudy grid, and Paper I is used as an external observational comparison rather than as a premise of the model.
full rationale
The paper's central quantitative claim is the five-parameter power-law fit in Eq. (1). Each exponent in Table 1 is a least-squares slope fitted to line ratios that are outputs of Cloudy C23.01 calculations; the independent variables (log U, log ne, log(N/O), log(O/H), log(Q1/Q0)) are either explicit grid inputs (N/O, O/H), stellar-SED-derived quantities (Q1/Q0), or model-output average quantities (U, ne). The fitted quantity is not the same variable as any predictor: for instance, [N III]/[O III]88 is an integrated intensity ratio, whereas N/O is an input abundance, so the claimed exponent 1.00 is extracted from the model, not imposed by construction. The U1 = U × (Q1/Q0) combination is a post-fit composite justified by comparable indices, and the steep Q1/Q0 dependence of [Ne III]/[Ne II] is likewise a fitted result from the grid, not an input. Paper I is an empirically assembled catalog from separate observations; the model grid is compared against it as external validation, and the paper explicitly warns (Sec. 4.4) that photoionization models are not the endpoint of line diagnostics. The dust-radiation-pressure discussion (Sec. 4.3.1) is an acknowledged modeling limitation: the default grid neglects radiation pressure, and including it changes the structure, so the Table 1 exponents are model-dependent—a robustness caveat, not a circular reduction. No step in the derivation chain equates the claimed prediction with its input by definition, and no load-bearing argument rests on a self-citation chain.
Assumptions & free parameters
free parameters (3)
- Power-law exponents x1...x5 =
Table 1 values, e.g., [N iii]/[O iii]88: x3=1.00, x5=-0.52
- Segmented fit break points =
Break at [O iii]88/[C ii] ~ 1; breaks at [N iii]/[N ii] ~ 5 and ~10 for 122 and 205 um variants; similar for optical…
- Index cutoff at 0.05 =
Indices with |x| < 0.05 are set to zero in Table 1
assumptions (7)
- standard math Cloudy C23.01 atomic data and physical processes are correct for FIR FSL emissivities
- domain assumption POPSTAR 2009 stellar population SEDs with Chabrier IMF accurately represent the ionizing radiation in star-forming galaxies
- domain assumption Plane-parallel, constant gas pressure equilibrium with dust radiation pressure neglected is a valid representation of galaxy-integrated ISM emission
- domain assumption Dust-to-gas ratio scales linearly with O/H from a solar value of 0.01
- domain assumption Fixed solar abundance ratios for elements other than N and O, with independent N/O variation
- domain assumption Line width of 3 km/s and stopping at AV=100 mag or Te=10 K does not materially affect integrated line ratios
- domain assumption Galaxy-integrated FIR FSL emission can be modeled by a single uniform slab
Cite this review
Pith. "Pith review of Fine-structure Line Atlas for Multi-wavelength Extragalactic Study (FLAMES) II: Photoionization Model View of Ionized to Neutral Gas Emission." pith.science (2026). https://pith.science/paper/UEO6IDAN
@misc{pith2026250711829,
  author       = {Pith},
  title        = {Pith review of: Fine-structure Line Atlas for Multi-wavelength Extragalactic Study (FLAMES) II: Photoionization Model View of Ionized to Neutral Gas Emission},
  year         = {2026},
  howpublished = {\url{https://pith.science/paper/UEO6IDAN}},
  note         = {Machine review of arXiv:2507.11829}
}
abstract
Far-infrared (FIR) and mid-infrared (MIR) fine-structure lines (FSLs) provide key diagnostics of physical conditions in the interstellar medium (ISM). Building on empirical relations established in our previous work, we use photoionization models to systematically investigate the emission from both ionized and neutral gas phases in a coherent structure. By applying power-law fits to model parameters, we quantitatively capture how key FIR FSL ratios scale with physical properties such as density, radiation field strength and hardness, and elemental abundances. Our analysis confirms the primary dependencies behind most observed empirical trends and establishes certain FIR FSL ratios as tracers of physical parameters, while revealing that parameter marginalization-particularly in density and the O/H-$U$-$Q_1/Q_0$ relation-plays a crucial role in shaping tight correlations seen in galaxies. We also identify persistent challenges, including degeneracies between ionization parameter and radiation field hardness, uncertainties in neutral gas density, and difficulties in modeling dusty H II regions. We outline the fundamental observational and theoretical limitations of current FIR FSL diagnostics, and highlight prospects for advancing the field through comprehensive, multi-wavelength studies of diverse galaxy populations.
Figures


Figures from the paper (12 more)



Forward citations
Cited by 1 Pith paper
-
Fine-structure Line Atlas for Multi-wavelength Extragalactic Study (FLAMES) III: [C II] as Tracer, Crisis of SFR, [O III]/[C II] at High-z, New Answers and New Questions
A universal gas-line deficit relative to infrared luminosity, seen in [C II], [O I], [N II], and extinction-corrected H-alpha, breaks standard SFR calibrations in the brightest dusty galaxies and implies a metallicity...
Reference graph
Works this paper leans on
-
[1]
Abel, N. P., Ferland, G. J., Shaw, G., & van Hoof, P. A. M. 2005, ApJS, 161, 65, doi: 10.1086/432913
doi:10.1086/432913 2005
-
[2]
Asplund, M., Grevesse, N., Sauval, A. J., & Scott, P. 2009, ARA&A, 47, 481, doi: 10.1146/annurev.astro.46.060407.145222 Astropy Collaboration, Robitaille, T. P., Tollerud, E. J., et al. 2013, A&A, 558, A33, doi: 10.1051/0004-6361/201322068 Astropy Collaboration, Price-Whelan, A. M., Sip˝ ocz, B. M., et al. 2018, AJ, 156, 123, doi: 10.3847/1538-3881/aabc4f
arXiv 2009
-
[3]
Brauher, J. R., Dale, D. A., & Helou, G. 2008, ApJS, 178, 280, doi: 10.1086/590249
doi:10.1086/590249 2008
-
[4]
2003, PASP, 115, 763, doi: 10.1086/376392
Chabrier, G. 2003, PASP, 115, 763, doi: 10.1086/376392
doi:10.1086/376392 2003
-
[5]
2023, RMxAA, 59, 327, doi: 10.22201/ia.01851101p.2023.59.02.12
Chatzikos, M., Bianchi, S., Camilloni, F., et al. 2023, RMxAA, 59, 327, doi: 10.22201/ia.01851101p.2023.59.02.12
-
[6]
Cormier, D., Madden, S. C., Lebouteiller, V., et al. 2015, A&A, 578, A53, doi: 10.1051/0004-6361/201425207
-
[7]
Cormier, D., Abel, N. P., Hony, S., et al. 2019, A&A, 626, A23, doi: 10.1051/0004-6361/201834457
-
[8]
Cunningham, D. J. M., Chapman, S. C., Aravena, M., et al. 2020, MNRAS, 494, 4090, doi: 10.1093/mnras/staa820
Show all 53 references
-
[9]
D., et al
Deharveng, L., Schuller, F., Anderson, L. D., et al. 2010, A&A, 523, A6, doi: 10.1051/0004-6361/201014422 D’Hendecourt, L. B., & Leger, A. 1987, A&A, 180, L9 D ´ ıaz-Santos, T., Armus, L., Charmandaris, V., et al. 2017, ApJ, 846, 32, doi: 10.3847/1538-4357/aa81d7
2010 doi
-
[10]
Dimaratos, A., Cormier, D., Bigiel, F., & Madden, S. C. 2015, A&A, 580, A135, doi: 10.1051/0004-6361/201526447
2015 doi
-
[11]
A., Fischera, J., Sutherland, R
Dopita, M. A., Fischera, J., Sutherland, R. S., et al. 2006, ApJ, 647, 244, doi: 10.1086/505418
2006 doi
-
[12]
Draine, B. T. 2011, ApJ, 732, 100, doi: 10.1088/0004-637X/732/2/100
2011 doi
-
[13]
T., Dale, D
Draine, B. T., Dale, D. A., Bendo, G., et al. 2007, ApJ, 663, 866, doi: 10.1086/518306
2007 doi
-
[14]
G., & Pagel, B
Edmunds, M. G., & Pagel, B. E. J. 1978, MNRAS, 185, 77P, doi: 10.1093/mnras/185.1.77P
1978 doi
-
[15]
Farrah, D., Lebouteiller, V., Spoon, H. W. W., et al. 2013, ApJ, 776, 38, doi: 10.1088/0004-637X/776/1/38 Fern´ andez Aranda, R., D ´ ıaz Santos, T., Hatziminaoglou, E., et al. 2024, A&A, 682, A166, doi: 10.1051/0004-6361/202347869 Fern´ andez-Ontiveros, J. A., Spinoglio, L., ...
2013 doi
-
[16]
P., Gonz´ alez-Alfonso, E., et al
Fischer, J., Abel, N. P., Gonz´ alez-Alfonso, E., et al. 2014, ApJ, 795, 117, doi: 10.1088/0004-637X/795/2/117
2014 doi
- [17]
-
[18]
Grevesse, N., & Sauval, A. J. 1998, SSRv, 85, 161, doi: 10.1023/A:1005161325181
1998 doi
-
[19]
Ferland, G. J. 2023, Research Notes of the American Astronomical Society, 7, 246, doi: 10.3847/2515-5172/ad0e75
2023 doi
-
[20]
Henry, R. B. C., Edmunds, M. G., & K¨ oppen, J. 2000, ApJ, 541, 660, doi: 10.1086/309471
2000 doi
-
[21]
2018, ApJ, 861, 94, doi: 10.3847/1538-4357/aac0f6
Herrera-Camus, R., Sturm, E., Graci´ a-Carpio, J., et al. 2018, ApJ, 861, 94, doi: 10.3847/1538-4357/aac0f6
2018 doi
-
[22]
K., & Hirashita, H
Hunt, L. K., & Hirashita, H. 2009, A&A, 507, 1327, doi: 10.1051/0004-6361/200912020
2009 doi
-
[23]
R., Oka, T., & McCall, B
Indriolo, N., Geballe, T. R., Oka, T., & McCall, B. J. 2007, ApJ, 671, 1736, doi: 10.1086/523036
2007 doi
-
[24]
Inoue, A. K. 2002, ApJ, 570, 688, doi: 10.1086/339788
2002 doi
-
[25]
R., & Conley, A
Kamenetzky, J., Rangwala, N., Glenn, J., Maloney, P. R., & Conley, A. 2016, ApJ, 829, 93, doi: 10.3847/0004-637X/829/2/93
2016 doi
-
[26]
2014, A&A, 562, A45, doi: 10.1051/0004-6361/201321954
Karska, A., Herpin, F., Bruderer, S., et al. 2014, A&A, 562, A45, doi: 10.1051/0004-6361/201321954
2014 doi
-
[27]
J., Wolfire, M
Kaufman, M. J., Wolfire, M. G., & Hollenbach, D. J. 2006, ApJ, 644, 283, doi: 10.1086/503596
2006 doi
-
[28]
Kennicutt, R. C., J. 1984, ApJ, 287, 116, doi: 10.1086/162669
1984 doi
-
[29]
K., & Hodge, P
Kennicutt, Robert C., J., Edgar, B. K., & Hodge, P. W. 1989, ApJ, 337, 761, doi: 10.1086/167147
1989 doi
-
[30]
2021, MNRAS, 508, 1084, doi: 10.1093/mnras/stab2495
Maiolino, R. 2021, MNRAS, 508, 1084, doi: 10.1093/mnras/stab2495
2021 doi
-
[31]
C., Young, L
Lapham, R. C., Young, L. M., & Crocker, A. 2017, ApJ, 840, 51, doi: 10.3847/1538-4357/aa6d83
2017 doi
-
[32]
K., Sandstrom, K., Rosolowsky, E., et al
Leroy, A. K., Sandstrom, K., Rosolowsky, E., et al. 2023, ApJL, 944, L9, doi: 10.3847/2041-8213/acaf85
2023 doi
-
[33]
C., Marrone, D
Litke, K. C., Marrone, D. P., Aravena, M., et al. 2022, ApJ, 928, 179, doi: 10.3847/1538-4357/ac58f9
2022 doi
-
[34]
2017, ApJS, 230, 1, doi: 10.3847/1538-4365/aa6476
Lu, N., Zhao, Y., D ´ ıaz-Santos, T., et al. 2017, ApJS, 230, 1, doi: 10.3847/1538-4365/aa6476
2017 doi
-
[35]
C., Galliano, F., Jones, A
Madden, S. C., Galliano, F., Jones, A. P., & Sauvage, M. 2006, A&A, 446, 877, doi: 10.1051/0004-6361:20053890
2006 doi
-
[36]
C., R´ emy-Ruyer, A., Galametz, M., et al
Madden, S. C., R´ emy-Ruyer, A., Galametz, M., et al. 2013, PASP, 125, 600, doi: 10.1086/671138 Mart ´ ın-Hern´ andez, N. L., Vermeij, R., & van der Hulst, J. M. 2005, A&A, 433, 205, doi: 10.1051/0004-6361:20042143 Moll´ a, M., Garc ´ ıa-Vargas, M. L., & Bressan, A. 2009, MNRA...
2013
-
[37]
2025, Fine-structure Line Atlas for Multi-wavelength Extragalactic Study (FLAMES) I: Comprehensive Low and High Redshift Catalogs and Empirical Relations for Probing Gas Conditions
Peng, B., Lamarche, C., Ball, C., et al. 2025, Fine-structure Line Atlas for Multi-wavelength Extragalactic Study (FLAMES) I: Comprehensive Low and High Redshift Catalogs and Empirical Relations for Probing Gas Conditions. https://arxiv.org/abs/2507.10702
2025 arXiv
-
[38]
J., et al
Peng, B., Lamarche, C., Stacey, G. J., et al. 2021, ApJ, 908, 166, doi: 10.3847/1538-4357/abd4e2
2021 doi
-
[39]
S., Thuan, T
Pilyugin, L. S., Thuan, T. X., & V ´ ılchez, J. M. 2003, A&A, 397, 487, doi: 10.1051/0004-6361:20021458
2003 doi
-
[40]
D., Spilker, J
Reuter, C., Vieira, J. D., Spilker, J. S., et al. 2020, ApJ, 902, 78, doi: 10.3847/1538-4357/abb599
2020 doi
-
[41]
Rosenberg, M. J. F., van der Werf, P. P., Aalto, S., et al. 2015, ApJ, 801, 72, doi: 10.1088/0004-637X/801/2/72
2015 doi
-
[42]
A., Vegetti, S., et al
Rybak, M., Hodge, J. A., Vegetti, S., et al. 2020, MNRAS, 494, 5542, doi: 10.1093/mnras/staa879
2020 doi
-
[43]
2022, A&A, 658, A188, doi: 10.1051/0004-6361/202141907
Santoro, F., Kreckel, K., Belfiore, F., et al. 2022, A&A, 658, A188, doi: 10.1051/0004-6361/202141907
2022 doi
-
[44]
2002, A&A, 382, 28, doi: 10.1051/0004-6361:20011619
Schaerer, D. 2002, A&A, 382, 28, doi: 10.1051/0004-6361:20011619
2002 doi
-
[45]
S., Harnden, F
Sciortino, S., Vaiana, G. S., Harnden, F. R., J., et al. 1990, ApJ, 361, 621, doi: 10.1086/169225
1990 doi
-
[46]
M., et al
Spinoglio, L., Pereira-Santaella, M., Dasyra, K. M., et al. 2015, ApJ, 799, 21, doi: 10.1088/0004-637X/799/1/21
2015 doi
-
[47]
A., Malkan, M
Spinoglio, L., Fern´ andez-Ontiveros, J. A., Malkan, M. A., et al. 2022, ApJ, 926, 55, doi: 10.3847/1538-4357/ac37b7 Stasi´ nska, G., Cid Fernandes, R., Mateus, A., Sodr´ e, L., &
2022 doi
-
[48]
Asari, N. V. 2006, MNRAS, 371, 972, doi: 10.1111/j.1365-2966.2006.10732.x
2006
-
[49]
A., Croxall, K
Sutter, J., Dale, D. A., Croxall, K. V., et al. 2019, ApJ, 886, 60, doi: 10.3847/1538-4357/ab4da5
2019 doi
-
[50]
Tielens, A. G. G. M. 2008, ARA&A, 46, 289, doi: 10.1146/annurev.astro.46.060407.145211
2008
-
[51]
Tielens, A. G. G. M., & Hollenbach, D. 1985, ApJ, 291, 722, doi: 10.1086/163111 Vale Asari, N., Stasi´ nska, G., Morisset, C., & Cid
1985 doi
-
[52]
2016, MNRAS, 460, 1739, doi: 10.1093/mnras/stw971
Fernandes, R. 2016, MNRAS, 460, 1739, doi: 10.1093/mnras/stw971
2016 doi
-
[53]
K., et al
Zhao, Y., Lu, N., Xu, C. K., et al. 2016, ApJ, 819, 69, doi: 10.3847/0004-637X/819/1/69
2016 doi
Reviewed August 6, 2026 · model on record in the stance chip above.
Discussion (0). Continue with ORCID to comment.