REVIEW 3 major objections 6 minor 54 references
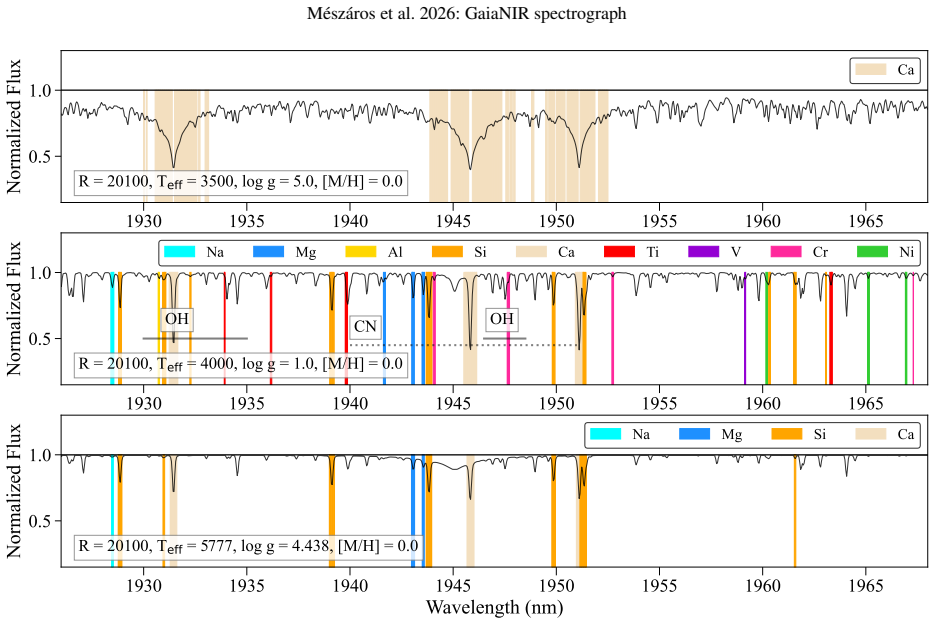
The GaiaNIR spectrograph should observe a 42 nm window at 1926–1968 nm in the K band at R≈16,000–20,000, where it can match Gaia's radial-velocity and stellar-parameter precision while seeing through roughly 7.4 times less interstellar dust
Reviewed by Pith at T0; open to challenge. T0 means a machine referee read the full paper against a public rubric. the ladder, T0–T4 →
T0 review · deepseek-v4-flash
2026-08-01 22:17 UTC pith:UYXYEVJD
load-bearing objection Plausible case for the K-band GaiaNIR window, but the central claim still needs empirical K-band validation before it should drive hardware decisions. the 3 major comments →
Radial velocity and atmospheric parameter calculations for the GaiaNIR spectrograph
The pith
A machine-rendered reading of the paper's core claim, the machinery that carries it, and where it could break.
Core claim
The central claim is that the optimal spectral range for the GaiaNIR spectrograph is the K-band window 1926–1968 nm at a resolution around 16,100–20,100. Using synthetic BOSZ spectra with injected noise and Doppler shifts, the authors show that this window delivers radial-velocity precision of roughly 160–260 m/s for the brightest FGKM stars and atmospheric-parameter precisions better than 100 K in effective temperature and 0.08 dex in metallicity—values they argue are on par with Gaia's RVS. The same window supports abundance measurements of ten species (O, Na, Mg, Si, Ca, Ti, V, Cr, Mn, Ni) for cool giants while taking advantage of the K band's roughly 7.4-fold reduction in interstellar ex
What carries the argument
The analysis is carried by a simulation pipeline built on the BOSZ synthetic spectral library: 10,000 random stellar parameter combinations (Teff 2800–10,000 K, log g 0–5.5, [M/H] −1.5 to 0.5) were rendered at resolutions 5000–20,000, shifted by random radial velocities, given Gaussian noise, and cross-correlated against noise-free templates to measure velocity scatter. Candidate windows were then fit with FERRE to estimate Teff, log g, and [M/H] precision. The detector-resolution relation R = λC·NR/(λr·NP) ties window width to achievable resolution, and a 1% flux-difference threshold defines detectable abundance species.
Load-bearing premise
The recommendation assumes the BOSZ synthetic spectra are accurate enough in the 1926–1968 nm window—especially the line list and H2O opacity—to make the relative ranking of windows by scatter trustworthy; the method is validated only in the optical RVS window, not in the K band.
What would settle it
Observe a set of bright FGKM standard stars with an existing high-resolution K-band spectrograph covering 1926–1968 nm and compare measured radial velocities and atmospheric parameters against precise literature values. If the empirical scatter is substantially larger than the 160–260 m/s and <100 K/0.08 dex predicted here—or if the synthetic line list is found to miss strong lines in that window—the optimal wavelength and resolution recommendation would need to move.
If this is right
- If adopted, a single 42 nm K-band window would give GaiaNIR the same radial-velocity and stellar-parameter capabilities as Gaia's optical RVS, but for stars hidden behind dust.
- The quoted precisions hold for bright (S/N>40) FGKM stars; the paper cautions that low-S/N velocities are underestimated by a factor of 2–3 and need further study.
- The K-band window yields ten measurable species in cool giants (O, Na, Mg, Si, Ca, Ti, V, Cr, Mn, Ni), enabling chemical-tagging and accretion-history science in the obscured Milky Way.
- M-dwarf spectra in the K band are dominated by H2O, leaving Ca as the only measurable abundance; the 1158–1202 nm window would recover six species for the coolest dwarfs.
- The recommended window is a compromise: the 1984–2000 nm sub-window gives better radial velocities (~118 m/s) but much worse atmospheric parameters, while the full 1926–2000 nm range gives poorer velocities unless resolution is pushed to ~14,000.
Where Pith is reading between the lines
- The paper validates its precision estimates only against Gaia's 845–872 nm window, so the K-band numbers carry an implicit assumption that the synthetic line list is complete in that region; an empirical K-band accuracy test against a few dozen standard stars would be the natural next step.
- If the K-band window is selected, the mission's ability to study M dwarfs—expected to be a large fraction of targets—depends on either improving H2O line treatment or pairing the K-band spectrograph with the 1158–1202 nm window.
- The 7.4× extinction advantage rests on a standard extinction law; in dense, highly variable sightlines the actual gain may differ, which could shift the optimal wavelength choice for specific survey fields.
- The same simulation pipeline could be rerun for a hypothetical two-window configuration—one K-band channel for giants and a shorter channel for dwarfs/hot stars—to test whether the abundance and temperature coverage gains outweigh detector and crowding costs.
Editorial analysis
A structured set of objections, weighed in public.
Referee Report
Summary. This manuscript addresses the design of the GaiaNIR spectrograph by searching the 800–2300 nm range for the wavelength window that best balances radial-velocity (RV) precision, atmospheric-parameter precision, and interstellar extinction. Using 10,000 BOSZ synthetic spectra with injected noise and Doppler shifts, the authors cross-correlate mock observations with ideal templates to map RV scatter versus wavelength and resolution, then use FERRE to estimate Teff/logg/[M/H] precision in six down-selected windows. They validate their simulation pipeline against Gaia RVS performance at 845–872 nm (§3.1), then recommend 1926–1968 nm at R ≈ 16100–20100 as the optimal compromise, with a secondary 1158–1202 nm window, claiming RVs of 160–260 m/s for bright FGKM stars and atmospheric-parameter precisions better than 100 K in Teff and 0.08 dex in metallicity.
Significance. The result is potentially important: if the K-band window performs as predicted, GaiaNIR could obtain Gaia-RVS-comparable spectroscopy through roughly 7 times lower extinction than the optical, enabling the mission's core obscured-Milky-Way science. The study is systematic and transparent: the parameter sweep is broad, the RV and atmospheric-parameter metrics are clearly defined, and the comparison with Gaia DR3 provides a useful external check. No parameter is fitted to force the recommended window; the recommendation emerges from the simulations. The main caveat is external validity: the Gaia validation is at 845–872 nm only, and the K-band recommendation rests entirely on BOSZ synthetic spectra whose line lists and opacities are unvalidated in this region. The paper itself acknowledges major line-list work remains.
major comments (3)
- [§3.1 / §4] The method is validated only in the 845–872 nm RVS range against Gaia DR3; no observed K-band spectra are used to test BOSZ in the recommended 1926–1968 nm window. Because the central conclusion is a ranking of windows based on simulated scatter, a line-list defect, missing opacity, or wrong gf-values in the K band could change the ranking and the recommended window. The paper's own conclusion ('significant effort will need to be put forward creating a new line list') underscores this risk. I ask for either (a) a direct validation of BOSZ K-band spectra against high-resolution observed spectra (e.g., infrared atlases of FGK standards), or (b) a sensitivity analysis that perturbs line lists/opacities in the candidate windows and shows the 1926–1968 nm recommendation is robust. Without this, the headline recommendation is not fully supported.
- [§3.1] The authors report that at low S/N their simulated RV scatter is a factor of 2–3 smaller than Gaia DR3's observed precision, and they note that 'the bulk of GaiaNIR targets will be fainter.' This is a load-bearing limitation: the quoted 160–260 m/s applies to the brightest stars at S/N>40, while the mission's scientific return for the dust-obscured Milky Way depends on fainter targets. The paper should either model the expected S/N distribution of GaiaNIR targets and propagate the corrected low-S/N errors, or clearly scope the recommendation as applying only to the bright-star regime and explain why the window choice is insensitive to the low-S/N correction.
- [§3.2] The abundance detectability test uses a +0.2 dex perturbation and a 1% flux-difference threshold at S/N=100 with no noise realizations or recovery fraction. The list of 'available species' in Table 1 and the abstract is a central part of the optimal-window argument, since the paper weighs the number of measurable species when comparing windows. A more robust injection-recovery test (varying the perturbation size, including noise, and quantifying completeness) is needed to support the claim that ten species can be derived from the recommended window.
minor comments (6)
- [Table 1 / Abstract / Conclusions] Species counts are inconsistent: the abstract lists 'O, Na, Mg, Si, Ca, Ti, V, Cr, Mn, Ni' for the K band, but Table 1 and §3.5 indicate that in the recommended 1926–1968 nm window Mn is absent and Al is present; the Conclusions say 'nine distinct species' and then enumerate 11. Please harmonize.
- [§3.2] 'Figures 8−7' should be 'Figures 7−8'.
- [Fig. 2] The bottom panel caption should specify the line styles/colors used for the four resolutions (5000, 10000, 15000, 20000).
- [§2.3] Provide a version or citation for PyAstronomy's crosscorrRV function.
- [Table 1] Define σ_v, σ_Teff, σ_logg, and σ_[M/H] in the caption and visually separate the five detector configurations per window for readability.
- [§3.1] Clarify the S/N definition (per pixel? per resolution element?) and whether 'scatter' is the standard deviation of residuals after the ±50 km/s outlier rejection.
Circularity Check
No significant circularity; the 1926–1968 nm recommendation is an externally benchmarked simulation, not a fitted prediction.
full rationale
The derivation chain is self-contained and does not reduce to its inputs. The RV precision per 100 nm window is measured by injecting noise and a random Doppler shift into BOSZ spectra and cross-correlating each mock with its own noise-free 'ideal template' (§2.3). This is a controlled self-consistency experiment; the paper explicitly states that it 'excluded systematic errors from a template mismatch,' and it applies the identical procedure to all windows, so the relative ranking of windows is meaningful even if absolute precision is optimistic. No parameter is fitted to force the recommended window: the six candidates emerge from uniform scatter statistics, and the preference for longer wavelengths is an exogenous science priority (7.4 times lower extinction, Cardelli et al. 1989), not an output of the fit. The method is externally anchored in §3.1: simulated precisions for the 845–872 nm window (83.1 K in Teff, 0.15 dex in logg, 0.06 dex in [M/H], ~157 m/s at S/N=100) are compared with Gaia DR3 empirical scatter (90.3 K, 0.19 dex, 0.13 dex, 120–140 m/s), i.e., independent external benchmarks; the comparison is favorable and honestly notes the low-S/N mismatch. The only notable self-citation is the BOSZ grid (Mészáros et al. 2024), co-authored by the paper's first author, which is the input spectral library. This is not load-bearing circularity: BOSZ is a published, parameter-free grid with stated assumptions, and the target result (optimal window selection) is not an input to its construction; the window recommendation is not used to validate BOSZ. The genuine risk is K-band model fidelity — line-list completeness and opacity accuracy at 1926–1968 nm are not validated against observed K-band spectra, a limitation the authors themselves flag ('Significant effort will need to be put forward creating a new line list'). That is an external-validity correctness risk, not an internal circular step. Accordingly the score is a low 2, reflecting the minor self-citation and the self-consistent (ideal-template) methodology, with the central derivation otherwise independent.
Axiom & Free-Parameter Ledger
free parameters (4)
- Abundance detectability threshold =
1% flux residual for +0.2 dex abundance change
- RV outlier exclusion cut =
±50 km/s
- Microturbulent velocity =
2 km/s
- Atmospheric-parameter sample cuts =
S/N > 40; 4000 < Teff < 7000 K for Table 2.4
axioms (6)
- domain assumption BOSZ LTE synthetic spectra with MARCS/ATLAS9 atmospheres and 23 molecular line lists are realistic enough to rank RV and parameter precision across 800–2300 nm.
- domain assumption The Cardelli et al. extinction law describes NIR extinction, with K-band extinction roughly 7.4 times lower than optical.
- domain assumption Cross-correlation against the true noiseless template is a valid proxy for relative RV precision across different windows.
- domain assumption FERRE's grid interpolation with χ² minimization recovers Teff, logg, and [M/H] without bias beyond the reported scatter.
- domain assumption A Gaia-RVS-like architecture with 3 pixels per resolution element and Equation 1 determines the achievable resolution for a given window and detector size.
- domain assumption The atomic and molecular line lists used in the abundance detectability study (VALD3 plus Plez molecular lists) are complete enough in the K band.
read the original abstract
Context. The upcoming GaiaNIR mission is currently planning to add a near-infrared spectrograph to its payload in order to enhance its scientific return, particularly for mapping the dust-obscured regions of the Milky Way. Aims. This study aims to identify the optimal wavelength region between 800 and 2300 nm for the proposed GaiaNIR spectrograph to maximize the precision of radial velocities and atmospheric parameters. Methods. To find its spectral range, we generated 10000 synthetic spectra from the BOSZ library across a wide range of stellar parameters, with resolutions varying from 5000 to 20000. By cross-correlating these mock observations with ideal templates, we assessed the statistical scatter of velocity residuals to isolate six candidate windows for further atmospheric parameter testing. Results. Our analysis finds that the 1926 - 1968 nm window at R = 16100 - 20100 in the K-band is the preferred strategic choice, because it has the potential to reach radial velocity precision for the brightest FGKM stars of about 160 - 260 m/s depending on resolution, while providing precision of the atmospheric parameters close to Gaia's Radial Velocity Spectrometer. We also identified a second region between 1158 and 1202 nm (R = 9300 - 11600), that has slightly lower radial velocity precision, but at a wider temperature range than the K-band. Both regions make it possible to derive abundances of ten species at these resolutions: O, Na, Mg, Si, Ca, Ti, V, Cr, Mn, Ni in the K-band, and Mg, Si, K, Ca, Ti, V, Cr, Mn, Co, Ni between 1158 - 1202 nm. Conclusions. The K-band delivers sufficiently precise measurements for the mission's primary cool star targets while taking advantage of significantly lower interstellar extinction, enabling the mapping of the dust-obscured regions of the Milky Way.
Figures



Reference graph
Works this paper leans on
-
[1]
Summary of the contents and survey properties
Gaia Early Data Release 3. Summary of the contents and survey properties. , keywords =. doi:10.1051/0004-6361/202039657 , archivePrefix =. 2012.01533 , primaryClass =
Pith/arXiv arXiv 2012
-
[2]
InfTars - Információs Társadalom , keywords =
The Past, Present and Future of the ELKH Cloud. InfTars - Információs Társadalom , keywords =. doi:inftars.XXII.2022.2.8 , adsurl =
2022
-
[3]
The Solar Chemical Composition. , keywords =. doi:10.1007/s11214-007-9173-7 , adsurl =
-
[4]
, year = 2015, month = may, volume =
A major upgrade of the VALD database. , year = 2015, month = may, volume =. doi:10.1088/0031-8949/90/5/054005 , adsurl =
-
[5]
The Relationship between Infrared, Optical, and Ultraviolet Extinction. , keywords =. doi:10.1086/167900 , adsurl =
-
[6]
G _ RVS photometry from the RVS spectra
Gaia Data Release 3. G _ RVS photometry from the RVS spectra. , keywords =. doi:10.1051/0004-6361/202243615 , archivePrefix =. 2206.05725 , primaryClass =
-
[7]
Properties and validation of the radial velocities
Gaia Data Release 3. Properties and validation of the radial velocities. , keywords =. doi:10.1051/0004-6361/202244220 , archivePrefix =. 2206.05902 , primaryClass =
-
[8]
Analysis of RVS spectra using the General Stellar Parametriser from spectroscopy
Gaia Data Release 3. Analysis of RVS spectra using the General Stellar Parametriser from spectroscopy. , keywords =. doi:10.1051/0004-6361/202243750 , archivePrefix =. 2206.05541 , primaryClass =
-
[9]
Sloan Digital Sky Survey. V. Pioneering Panoptic Spectroscopy. , keywords =. doi:10.3847/1538-3881/ae0576 , archivePrefix =. 2507.06989 , primaryClass =
-
[10]
SDSS-V Milky Way Mapper (MWM): ASPCAP Stellar Parameters and Abundances in SDSS-V Data Release 19. , keywords =. doi:10.3847/1538-3881/ade4b9 , archivePrefix =. 2506.07845 , primaryClass =
-
[11]
Gaia Radial Velocity Spectrometer
Gaia Data Release 2. Gaia Radial Velocity Spectrometer. , keywords =. doi:10.1051/0004-6361/201832763 , archivePrefix =. 1804.09369 , primaryClass =
-
[12]
Experimental Astronomy , keywords =
All-sky visible and near infrared space astrometry. Experimental Astronomy , keywords =. doi:10.1007/s10686-021-09705-z , archivePrefix =. 1907.12535 , primaryClass =
Pith/arXiv arXiv 1907
-
[13]
GaiaNIR: Combining optical and Near-Infra-Red (NIR) capabilities with Time-Delay-Integration (TDI) sensors for a future Gaia-like mission. arXiv e-prints , keywords =. doi:10.48550/arXiv.1609.07325 , archivePrefix =. 1609.07325 , primaryClass =
-
[14]
Summary of the contents and survey properties
Gaia Data Release 2. Summary of the contents and survey properties. , keywords =. doi:10.1051/0004-6361/201833051 , archivePrefix =. 1804.09365 , primaryClass =
-
[15]
Summary of the astrometric, photometric, and survey properties
Gaia Data Release 1. Summary of the astrometric, photometric, and survey properties. , keywords =. doi:10.1051/0004-6361/201629512 , archivePrefix =. 1609.04172 , primaryClass =
-
[16]
The Gaia mission. , keywords =. doi:10.1051/0004-6361/201629272 , archivePrefix =. 1609.04153 , primaryClass =
-
[17]
The updated BOSZ synthetic stellar spectral library. , keywords =. doi:10.1051/0004-6361/202449306 , archivePrefix =. 2407.10872 , primaryClass =
-
[18]
ASPCAP: The APOGEE Stellar Parameter and Chemical Abundances Pipeline. , keywords =. doi:10.3847/0004-6256/151/6/144 , archivePrefix =. 1510.07635 , primaryClass =
-
[19]
APOGEE Data and Spectral Analysis from SDSS Data Release 16: Seven Years of Observations Including First Results from APOGEE-South. , keywords =. doi:10.3847/1538-3881/aba592 , archivePrefix =. 2007.05537 , primaryClass =
Pith/arXiv arXiv 2007
-
[20]
The GALAH survey: effective temperature calibration from the InfraRed Flux Method in the Gaia system. , keywords =. doi:10.1093/mnras/stab2304 , archivePrefix =. 2011.02517 , primaryClass =
Pith/arXiv arXiv 2011
-
[21]
The Southern clusters and overview
Homogeneous analysis of globular clusters from the APOGEE survey with the BACCHUS code - II. The Southern clusters and overview. , keywords =. doi:10.1093/mnras/stz3496 , archivePrefix =. 1912.04839 , primaryClass =
Pith/arXiv arXiv 1912
-
[22]
Homogeneous analysis of globular clusters from the APOGEE survey with the BACCHUS code. I. The northern clusters. , keywords =. doi:10.1051/0004-6361/201834550 , archivePrefix =. 1812.08817 , primaryClass =
-
[23]
Exploring Anticorrelations and Light Element Variations in Northern Globular Clusters Observed by the APOGEE Survey. , keywords =. doi:10.1088/0004-6256/149/5/153 , archivePrefix =. 1501.05127 , primaryClass =
-
[24]
The Open Cluster Chemical Abundances and Mapping Survey. VI. Galactic Chemical Gradient Analysis from APOGEE DR17. , keywords =. doi:10.3847/1538-3881/ac7ce5 , archivePrefix =. 2206.13650 , primaryClass =
-
[25]
The Open Cluster Chemical Abundances and Mapping Survey. IV. Abundances for 128 Open Clusters Using SDSS/APOGEE DR16. , keywords =. doi:10.3847/1538-3881/ab77bc , archivePrefix =. 2002.08980 , primaryClass =
Pith/arXiv arXiv 2002
-
[26]
The Open Cluster Chemical Abundances and Mapping Survey. II. Precision Cluster Abundances for APOGEE Using SDSS DR14. , keywords =. doi:10.3847/1538-3881/aad635 , archivePrefix =. 1807.09791 , primaryClass =
-
[27]
Summary of the content and survey properties
Gaia Data Release 3. Summary of the content and survey properties. , keywords =. doi:10.1051/0004-6361/202243940 , archivePrefix =. 2208.00211 , primaryClass =
-
[28]
The Gaia-ESO Public Spectroscopic Survey: Implementation, data products, open cluster survey, science, and legacy. , keywords =. doi:10.1051/0004-6361/202243141 , archivePrefix =. 2206.02901 , primaryClass =
-
[29]
Calibrations of Atmospheric Parameters Obtained from the First Year of SDSS-III APOGEE Observations. , keywords =. doi:10.1088/0004-6256/146/5/133 , archivePrefix =. 1308.6617 , primaryClass =
-
[30]
The APOGEE Data Release 16 Spectral Line List. , keywords =. doi:10.3847/1538-3881/abefdc , archivePrefix =. 2103.10112 , primaryClass =
-
[31]
SDSS-V: Pioneering Panoptic Spectroscopy. arXiv e-prints , keywords =. doi:10.48550/arXiv.1711.03234 , archivePrefix =. 1711.03234 , primaryClass =
-
[32]
APOGEE Data Releases 13 and 14: Data and Analysis. , keywords =. doi:10.3847/1538-3881/aad4f9 , archivePrefix =. 1807.09773 , primaryClass =
-
[33]
NLTE for APOGEE: simultaneous multi-element NLTE radiative transfer. , keywords =. doi:10.1051/0004-6361/201937054 , archivePrefix =. 2003.13353 , primaryClass =
Pith/arXiv arXiv 2003
-
[34]
TLUSTY and SYNSPEC Users's Guide IV: Upgraded Versions 208 and 54. arXiv e-prints , keywords =. doi:10.48550/arXiv.2104.02829 , archivePrefix =. 2104.02829 , primaryClass =
-
[35]
APOGEE Net: An Expanded Spectral Model of Both Low-mass and High-mass Stars. , keywords =. doi:10.3847/1538-3881/ac4de7 , archivePrefix =. 2201.03661 , primaryClass =
-
[36]
A Spectroscopic Study of the Ancient Milky Way: F- and G-Type Stars in the Third Data Release of the Sloan Digital Sky Survey. , keywords =. doi:10.1086/498131 , archivePrefix =. astro-ph/0509812 , primaryClass =
-
[37]
The Dartmouth Stellar Evolution Database. , keywords =. doi:10.1086/589654 , archivePrefix =. 0804.4473 , primaryClass =
-
[38]
The Galaxy in your preferred colours: Synthetic photometry from Gaia low-resolution spectra
Gaia Data Release 3. The Galaxy in your preferred colours: Synthetic photometry from Gaia low-resolution spectra. , keywords =. doi:10.1051/0004-6361/202243709 , archivePrefix =. 2206.06215 , primaryClass =
-
[39]
Gaia FGK benchmark stars: Effective temperatures and surface gravities. , keywords =. doi:10.1051/0004-6361/201526319 , archivePrefix =. 1506.06095 , primaryClass =
-
[40]
SF2A-2023: Proceedings of the Annual meeting of the French Society of Astronomy and Astrophysics , year = 2023, month = dec, pages =
The third version of the Gaia FGK Benchmark Stars. SF2A-2023: Proceedings of the Annual meeting of the French Society of Astronomy and Astrophysics , year = 2023, month = dec, pages =
2023
-
[41]
A new implementation of the infrared flux method using the 2MASS catalogue. , keywords =. doi:10.1051/0004-6361/200810904 , archivePrefix =. 0901.3034 , primaryClass =
-
[42]
The Apache Point Observatory Galactic Evolution Experiment (APOGEE) Spectrographs. , keywords =. doi:10.1088/1538-3873/ab0075 , archivePrefix =. 1902.00928 , primaryClass =
Pith/arXiv arXiv 1902
-
[43]
telescope and of the Ir \'e n \'e e DuPont telescope at Las Campanas Observatory, Chile
The optical design of the 40-in. telescope and of the Ir \'e n \'e e DuPont telescope at Las Campanas Observatory, Chile. , year = 1973, month = jan, volume =. doi:10.1364/AO.12.001430 , adsurl =
-
[44]
The 2.5 m Telescope of the Sloan Digital Sky Survey. , keywords =. doi:10.1086/500975 , archivePrefix =. astro-ph/0602326 , primaryClass =
-
[45]
Gaia FGK benchmark stars: Fundamental T _ eff and log g of the third version. , keywords =. doi:10.1051/0004-6361/202347136 , archivePrefix =. 2310.11302 , primaryClass =
-
[46]
Cosmic Abundances as Records of Stellar Evolution and Nucleosynthesis , year = 2005, editor =
The Solar Chemical Composition. Cosmic Abundances as Records of Stellar Evolution and Nucleosynthesis , year = 2005, editor =
2005
-
[47]
A grid of MARCS model atmospheres for late-type stars. I. Methods and general properties. , keywords =. doi:10.1051/0004-6361:200809724 , archivePrefix =. 0805.0554 , primaryClass =
-
[48]
New ATLAS9 and MARCS Model Atmosphere Grids for the Apache Point Observatory Galactic Evolution Experiment (APOGEE). , keywords =. doi:10.1088/0004-6256/144/4/120 , archivePrefix =. 1208.1916 , primaryClass =
Pith/arXiv arXiv 1916
-
[49]
Model atmospheres for G, F, A, B, and O stars. , keywords =. doi:10.1086/190589 , adsurl =
-
[50]
The GALAH+ survey: Third data release. , keywords =. doi:10.1093/mnras/stab1242 , archivePrefix =. 2011.02505 , primaryClass =
Pith/arXiv arXiv 2011
-
[51]
The Apache Point Observatory Galactic Evolution Experiment (APOGEE). , keywords =. doi:10.3847/1538-3881/aa784d , archivePrefix =. 1509.05420 , primaryClass =
-
[52]
The Gaia-ESO Survey: Homogenisation of stellar parameters and elemental abundances. , keywords =. doi:10.1051/0004-6361/202345910 , archivePrefix =. 2304.07720 , primaryClass =
-
[53]
The Seventeenth Data Release of the Sloan Digital Sky Surveys: Complete Release of MaNGA, MaStar, and APOGEE-2 Data. , keywords =. doi:10.3847/1538-4365/ac4414 , archivePrefix =. 2112.02026 , primaryClass =
-
[54]
Sloan Digital Sky Survey IV: Mapping the Milky Way, Nearby Galaxies, and the Distant Universe. , keywords =. doi:10.3847/1538-3881/aa7567 , archivePrefix =. 1703.00052 , primaryClass =
discussion (0)
Sign in with ORCID, Apple, or X to comment. Anyone can read and Pith papers without signing in.