REVIEW 4 major objections 7 minor 3 references
ARGUS: Production-Scale Tracing and Performance Diagnosis for over 10,000-GPU Clusters
T0 review · 4 major / 7 minor · reviewed 2026-07-12 · grok-4.5
Pith's one-line read ARGUS keeps always-on, kernel-level tracing under 2% overhead on 10,000-GPU LLM clusters and compresses events ~3,700× so real-time straggler diagnosis becomes practical.
desk verdict Solid production systems paper that actually closes the always-on + kernel-level + 10k-scale gap; L3 fidelity is under-tested but not load-bearing for the main claim. read the letter →
The pith
A machine-rendered reading of the paper's core claim, the machinery that carries it, and where it could break.
The reading
What carries the argument
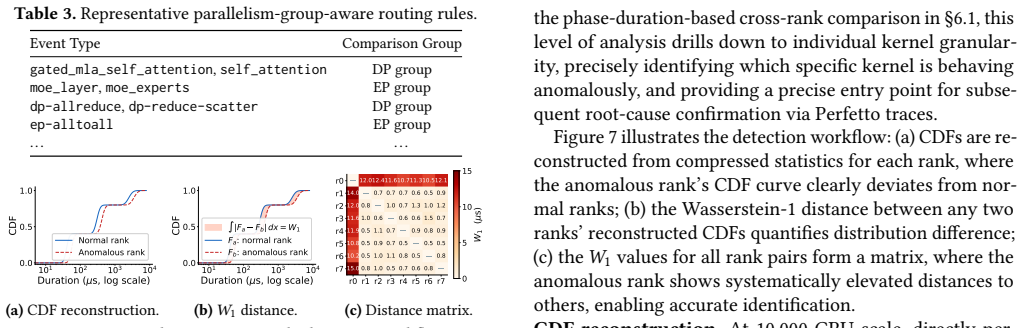
Online KDE valley clustering of log-duration samples per (kernel, stream, rank) window, followed by log-normal CDF reconstruction from only (count, p50, p99) per cluster and Wasserstein-1 distance matrices for cross-rank anomaly detection. This compresses ~10 MB of raw kernel events to ~2.7 KB per rank per step while retaining enough distributional fidelity for automated L3 localization.
What would settle it
Run a production-scale job whose kernel duration distributions are highly irregular or non-stationary; if the compressed (count, p50, p99) summaries plus Wasserstein-1 tests then fail to flag known injected stragglers while raw-trace analysis succeeds, the central compression claim collapses.
Extended reading notes
Core claim
A hierarchical, three-signal tracing design plus online KDE-based statistical compression of kernel durations makes always-on, fine-grained, real-time cross-rank diagnosis feasible at 10,000-GPU scale under a combined overhead of less than 2%, and the resulting progressive L1–L3 pipeline isolates anomalous windows, straggler ranks and degraded kernels in production.
Load-bearing premise
Kernel timings on ranks that share the same parallel role stay regular enough that a few per-mode percentiles still capture the differences needed to spot a true straggler.
Editorial extensions
If this is right
- Always-on kernel-level observability becomes practical rather than a short-window sampling luxury at 10k-GPU scale.
- Fail-slow diagnosis can move from machine- or link-level alerts to named kernels and host-side stack frames without waiting for offline post-mortems.
- The same progressive pipeline can surface performance-optimization opportunities (imbalance, poor overlap, JIT stalls) in addition to hard faults.
- Trace data volumes drop three orders of magnitude, bringing online cross-rank comparison inside ordinary time-series storage budgets.
- Production clusters can keep continuous fail-slow detection running for months instead of only during suspected incidents.
Reading between the lines
- The same hierarchical-signal plus lossy-but-fidelity-preserving compression pattern could be ported to large-scale inference serving or reinforcement-learning training with only modest re-instrumentation.
- If the log-normal mixture reconstruction proves robust, other distributed systems that generate repetitive multimodal event streams (databases, ML serving) could adopt analogous online statistical summaries instead of raw traces.
- Masking effects under pipeline parallelism shown in the case studies suggest that purely iteration-time or phase-level detectors will systematically under-detect stragglers whenever a global sync is present; future detectors may need explicit dependency models.
Signed reviews
Editorial analysis
A structured set of objections, weighed in public.
Referee Report
Summary. ARGUS is a production tracing and diagnosis system for LLM training on 10,000+ GPU clusters. It decomposes observation into CPU call stacks (py-spy), framework phase semantics (CUDA Events), and GPU kernel activity (CUPTI), claiming combined always-on overhead under 2%. A host-side Processor converts traces to Perfetto and compresses kernel events online via KDE valley clustering into (count, p50, p99) summaries (~3,700×, 10 MB → 2.7 KB per rank per step). Progressive diagnosis runs L1 (iteration-time anomalies), L2 (parallelism-group-aware phase CV/z-score), and L3 (log-normal CDF reconstruction + Wasserstein-1 + IQR) in parallel, with L4/L5 for manual deep-dive. The system has been deployed for over six months; five production case studies cover compute stragglers, link degradation, pipeline-bubble masking, FlashAttention JIT stalls, and compute faults misread as network issues.
Significance. If the claims hold, ARGUS fills a genuine gap between always-on coarse monitors (Greyhound, C4, Minder, etc.) and high-overhead or triggered fine profilers (nsys, PyTorch Profiler, EROICA). Always-on kernel-level cross-rank comparison at 10k-GPU scale with sub-2% overhead and multi-month production use would be a substantial systems contribution for LLM training reliability and efficiency. Strengths include concrete overhead and memory measurements against strong baselines, quantified compression, a clear progressive diagnosis design, and five production cases with remediation outcomes (node replacement, PCIe repair, JIT disk cache). The work is empirical and falsifiable rather than circular: numbers are measured against external tools and production ground truth.
major comments (4)
- §5.2–§6.2 (KDE clustering, log-normal mixture CDF from (count,p50,p99), W1 + IQR): The paper’s central differentiator is always-on kernel-level online cross-rank diagnosis at 10k-GPU scale. That claim rests on lossy summaries preserving enough fidelity for W1 detection. There is no reconstruction-error measurement (true W1 on raw samples vs. reconstructed CDFs), no controlled kernel-slowdown injection with precision/recall, and no evaluation under non-stationary modes (JIT, dynamic MoE routing, shape-varying attention). Case 2 is the only clean L3 success on stable communication kernels; Cases 1 and 5 are caught at L2; Case 3 never fires L1–L3; Case 4 is diluted in L3 windows and needs L4. Without fidelity/ablation evidence, the L3 path—and thus the claim of kernel-level online comparison at scale—is under-supported relative to how strongly it is positioned in the abstract, Table 1, and
- §8.2 and Figures 8–9: Overhead and RSS are measured only on 8- and 32-GPU runs. The production claim is 10,000+ GPUs for six months, yet there is no quantitative always-on overhead, memory, or Processor/pipeline cost at that scale (or even at a few hundred GPUs). Small-scale <2% is encouraging and the streaming design is sound, but the load-bearing “always-on under 2% at production scale” claim needs at least production-side overhead evidence or a larger controlled run; otherwise the evaluation does not match the scale of the claim.
- §6 and §9 / Appendix D: Diagnosis effectiveness is shown only via five narrative case studies. There is no aggregate report of alert volume, false-positive rate, time-to-localization, or coverage over the six-month deployment (e.g., how often L3 alone localized vs. L2 vs. manual L4). Table 6 maps fault classes to levels but is not backed by measured detection rates. For a production diagnosis system, some quantitative operational metrics—or a controlled fault-injection suite covering the Table 6 categories—are needed to substantiate continuous fail-slow detection beyond selected successes.
- §6.2 Eq. (4) and §5.2 (Scott bandwidth, valley filters): Free parameters (IQR coefficient α, KDE bandwidth constant, cluster-level and spacing filters) are not sensitivity-analyzed. Because L3 anomaly flags depend on these choices, the paper should state default values used in production and show that detection outcomes are stable under reasonable variation, or justify them from data rather than leaving them as unexamined knobs.
minor comments (7)
- Table 1: FLARE is marked Always-on Cont. with Fine granularity ✓, yet the text says coverage is limited to a predefined operator set; a footnote clarifying “fine” vs. “arbitrary kernel” would avoid overstating the comparison.
- Figure 1 caption and body: GPU-hours wasted (23,758) and 7% figure would be clearer if the job duration and expected iteration time baseline method were stated in one place.
- §4.2: Stream selection for NCCL (device vs. peer group rank) is important; a short pseudocode or table of rules would help reproducibility.
- §5.2 / Figure 6: Units and axes (log2 duration) are fine, but stating the window length used for clustering in production would aid interpretation of compression numbers in Table 4.
- §8.1 vs. Appendix C: Evaluation uses HunYuan-V3 Preview with EP=8; case studies use different hybrid parallelisms. A sentence noting that overhead results are for one MoE config and may vary with PP-heavy or VLM shape diversity would set expectations.
- Typos/clarity: “LLMS” → “LLMs” (Intro); “aoutlier-based nomaly” → “outlier-based anomaly” (§6.2); “Cont.=continuous” formatting in Table 1 is slightly cramped.
- Related work: Aegis [12] is mentioned briefly; if it is concurrent production work, a clearer capability contrast (beyond communication-layer bound) would strengthen §2.2.
Circularity Check
No circularity: empirical systems paper whose overhead, compression, and diagnosis claims are measured against external baselines, not derived from self-referential fits or load-bearing self-citations.
full rationale
ARGUS is an engineering/systems contribution, not a first-principles derivation. Its load-bearing claims—combined always-on overhead <2%, ~3700× kernel compression (10 MB→2.7 KB per rank per step), and progressive L1–L3 localization—are established by direct measurement against external tools (PyTorch Profiler, nsys) and production outcomes (node replacement, NCCL tests, JIT cache fixes), not by equations that reduce a claimed prediction to a fitted free parameter. The KDE valley clustering, (count, p50, p99) summaries, log-normal mixture CDF reconstruction, Wasserstein-1 distances, and IQR fences are standard statistical design choices applied to observed traces; they are not presented as uniqueness theorems or as predictions forced by parameters fitted to the same target. Citations are to independent systems and libraries (CUPTI, Perfetto, NCCL, Greyhound, Holmes, MegaScale, etc.), not to prior uniqueness results by the same authors that forbid alternatives. Weaknesses noted by the skeptic (limited L3 stress tests, reconstruction-error ablations) concern evaluation completeness and assumption fidelity, not circular reduction of outputs to inputs. Score 0 with empty steps is therefore the correct finding.
Assumptions & free parameters
free parameters (3)
- IQR anomaly coefficient α
- KDE bandwidth (Scott’s rule constant 1.06)
- Cluster-level and spacing filters for KDE valleys
assumptions (4)
- domain assumption Ranks that share the same parallel role execute identical kernel sequences whose duration distributions are statistically comparable under normal conditions.
- domain assumption Kernel duration distributions within each mode are approximately log-normal, so two percentiles (p50, p99) suffice to reconstruct a usable CDF.
- domain assumption CUDA Event timestamps on the correct stream accurately reflect GPU-side phase duration independent of host scheduling.
- standard math Standard statistical tools (Gaussian KDE, Scott bandwidth, Wasserstein-1, IQR fences) are valid for online anomaly detection on the compressed summaries.
invented entities (2)
-
ARGUS progressive diagnosis levels L1–L5
independent evidence
-
Online KDE statistical compression of CUPTI kernel traces
independent evidence
Cite this review
Pith. "Pith review of ARGUS: Production-Scale Tracing and Performance Diagnosis for over 10,000-GPU Clusters." pith.science (2026). https://pith.science/paper/V3ANHHQJ
@misc{pith2026260620374,
  author       = {Pith},
  title        = {Pith review of: ARGUS: Production-Scale Tracing and Performance Diagnosis for over 10,000-GPU Clusters},
  year         = {2026},
  howpublished = {\url{https://pith.science/paper/V3ANHHQJ}},
  note         = {Machine review of arXiv:2606.20374}
}
read the original abstract
Large-scale LLM training requires always-on, fine-grained observability for effective performance diagnosis at scale. Coarse resource monitors alone cannot localize root causes, and fine-grained profilers incur prohibitive (5%-30%) overheads and massive trace volumes, making always-on deployment impractical in large production clusters. We propose ARGUS, a low-overhead, fine-grained, always-on tracing and real-time analysis system for training workloads in 10,000+ GPU-scale production clusters. ARGUS decomposes observation along the training call hierarchy into CPU call stacks, framework semantics, and GPU kernel execution, with always-on collection under a combined overhead of less than 2%. It builds a unified data pipeline and compresses raw kernel events by approximately 3,700x from 10 MB to 2.7 KB per rank per step. Its progressive diagnosis framework automatically isolates anomalous windows, straggler ranks, and degraded kernels through iteration-time, phase-level, and kernel-level analysis. Deployed for over six months on a 10,000+ GPU production cluster, ARGUS has supported continuous fail-slow detection and performance optimization. Our case studies further demonstrate its effectiveness across representative anomalies, including compute stragglers, link degradation, pipeline-bubble amplification, FlashAttention JIT stalls, and compute stragglers masked by communication symptoms.
Figures


Figures from the paper (10 more)




Reference graph
Works this paper leans on
-
[1]
ARGUS: Production-Scale Tracing and Performance Diagnosis for over 10,000-GPU Clusters Jiasheng Zhou Tencent Longbin Zeng Tencent Clavis Chen Tencent Ruiming Lu Tencent Qinwei Yang Tencent Leyi Ye Tencent Ray Ying Tencent Key Zhang Tencent Abstract Large-scale LLM training requires always-on, fine-grained observability for effective performance diagnosis ...
arXiv 2026
-
[2]
transport
For pure computation events such as self_attention and moe_experts, a high CV within the corresponding group directly indicates a straggler rank whose compute is slower. For communication events such as dp-allreduce and ep-alltoall, the system additionally determines whether the prolonged duration originates from the rank itself or waiting for a slow peer...
2023
-
[3]
server port down
uses runtime JIT: the first invocation of an un- cached kernel configuration lowers DSL code to PTX/cubin and caches the result [7]. Under the default configuration, compilation results are cached only in process memory; any fault-tolerance event (fatal node replacement, StepHang re- covery, configuration hot-update) that restarts the process clears the c...
Reviewed July 12, 2026 · model on record in the stance chip above.
Discussion (0). Continue with ORCID to comment.