REVIEW 2 major objections 5 minor 39 references
The Limits of Line Broadening: Modeling Stellar Spectra and Formation Temperatures at High Resolution
T0 review · 2 major / 5 minor · reviewed 2026-08-03 · deepseek-v4-flash
Pith's one-line read Convolution-based stellar spectral models mis-model line shapes by a few percent at high resolution, and formation temperatures computed from disk-center intensity instead of flux come out hundreds of kelvin too hot.
desk verdict Worth reading for the convolution-error result; the formation-temperature critique is plausible but unverifiable without the original equation. read the letter →
The pith
A machine-rendered reading of the paper's core claim, the machinery that carries it, and where it could break.
The reading
What carries the argument
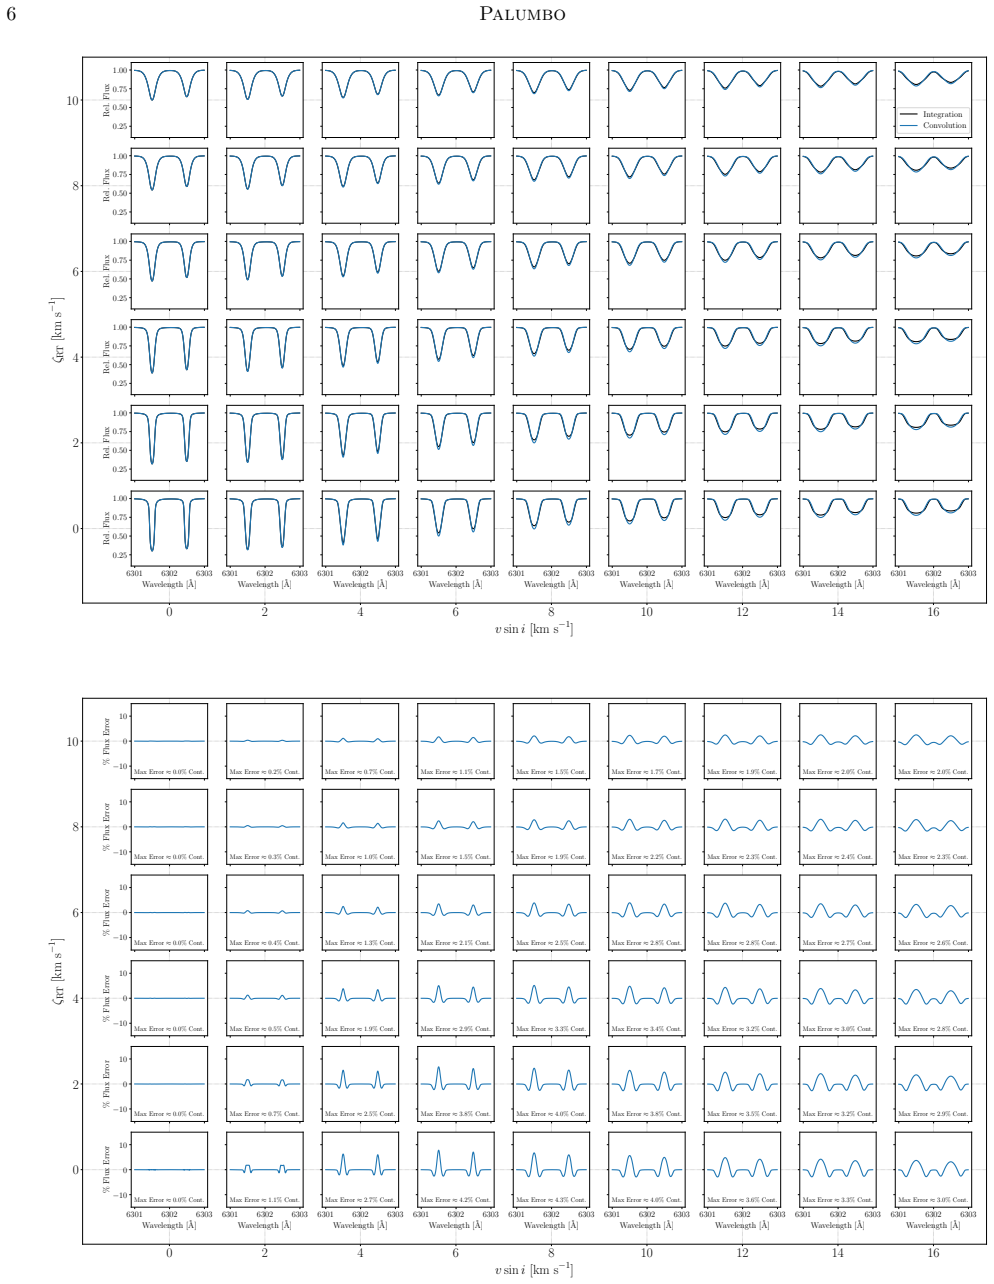
The intensity contribution function C_nu(t_nu, mu) = (1/mu) S_nu e^{-t_nu/mu} and the flux contribution function C_nu(t_nu) = S_nu E2(t_nu), where E2 is the second exponential integral, are the central objects. The paper contrasts explicit disk integration of local, anisotropically broadened intensities against the analytic convolution-kernel approach to quantify the error introduced by the convolution assumptions of achromatic limb darkening, solid-body rotation, and negligible center-to-limb variation in normalized line profiles.
What would settle it
Obtain Al Moulla et al. (2022) Equation 2 and check whether it equals (1/mu) S e^{-t/mu} at mu=1; if it is instead a disk-averaged quantity, the claimed bias disappears. Separately, compare convolution and disk-integrated synthetic line profiles against high-resolution (R>100,000) solar atlas data for an Fe I line; if the convolution profile matches the observed line shape as well as the disk-integrated profile, the flux-error claim is weakened.
Extended reading notes
Core claim
For an unresolved star, the emergent spectrum is the flux, and its contribution function is the disk-weighted integral of the intensity contribution functions. Prior work used the intensity contribution function at disk center, which weights the deep, hot photosphere more heavily, making the modeled formation temperature too hot. The paper demonstrates this with MARCS solar models and two Fe I lines, showing differences of hundreds of kelvin in the continuum and dozens of kelvin in line cores. It further shows that including rotation and macroturbulence in the contribution function perturbs T1/2 even after the intensity/flux distinction is fixed, with root-mean-square errors up to roughly 30
Load-bearing premise
The formation-temperature result rests on reading the cited prior work's Equation 2 as the disk-center intensity contribution function labeled 'flux'; the paper never reproduces that equation, so the size of the claimed error cannot be independently checked from this preprint.
Editorial extensions
If this is right
- Extreme-precision radial-velocity spectrum modeling at resolving power above about 10^5 should use disk-integrated synthesis rather than a single convolution kernel if line-shape fidelity matters.
- Formation-temperature analyses for unresolved stars should be redone using the flux contribution function; published T1/2 values based on disk-center intensity may be systematically too high.
- Rotational velocity is the dominant driver of convolution error, so stars above the Kraft break are the most affected by the approximation.
- Spectral elements sharing the same formation temperature can have very different contribution functions, so T1/2 alone is not a reliable proxy for the formation region.
- The accompanying software allows computing broadened contribution functions without the convolution approximation, enabling future studies to use the full contribution function instead of a single percentile.
Reading between the lines
- If the convolution error propagates into abundance analyses, differential abundance measurements may require resolution-dependent corrections at high resolving power, beyond the radial-velocity case the paper emphasizes.
- A direct observational test would compare convolution-modeled and disk-integrated synthetic line profiles against high-resolution solar atlas spectra; the model that reproduces observed center-to-limb asymmetries would validate the error claim.
- The specific claim about the prior work's equation depends on the exact definition in that paper; if their contribution function already included a disk average, the hundreds-of-kelvin offset would be a matter of convention rather than an error.
Editorial analysis
A structured set of objections, weighed in public.
Referee Report
Summary. This paper examines two assumptions in stellar spectral modeling: (i) that nonthermal broadening (rotation and radial-tangential macroturbulence) can be applied to a 'stationary' model flux by convolution with a single kernel, and (ii) that intensity and flux contribution functions can be used interchangeably when assigning formation temperatures. The author computes disk-integrated spectra with explicit tiling and compares them to the standard convolution route for two Fe I lines in a MARCS solar atmosphere, reporting flux errors of order a few percent of the continuum at R > 10^4, growing with v sin i. He then defines intensity and flux contribution functions, argues that K. Al Moulla et al. (2022) used the μ=1 intensity contribution function while calling it the flux contribution function, and shows that this conflation changes T1/2 by hundreds of kelvin. A Julia package (FormationTemperatures.jl) is provided.
Significance. Strengths: the convolution-vs-integration comparison is a clean, internally consistent numerical experiment; the disk-integrated route is the correct fiducial, and the input velocities/limb-darkening parameters are explicitly stated test values rather than tuned parameters. The manuscript ships reproducible code and scripts, a concrete benefit to the community. If the Al Moulla attribution is correct, the T1/2 correction is important for the growing use of formation-temperature binning in precise RV variability studies. The paper also usefully cautions that a single summary statistic like T1/2 can obscure qualitatively different contribution functions. The main risk is not internal logic but the external attribution in §3.1, which is not verifiable from the preprint as written.
major comments (2)
- [§3.1, Eq. (15) and Figure 6] The paper's second central claim is that K. Al Moulla et al. (2022) 'use the intensity contribution function (their Equation 2) evaluated at μ = 1.0 ... erroneously referring to it as the flux contribution function,' and that this makes their formation temperatures 'artificially hot.' This attribution is load-bearing, but the manuscript never displays Al Moulla et al.'s Eq. 2 or their T1/2 definition. A reader cannot check whether Eq. (15) is indeed their expression, whether their cumulative normalization is the same, or whether their quantity was intended as a defined flux-type or pseudo-flux quantity. If the attribution is wrong, the hundreds-kelvin difference in Figure 6 is an artifact of comparing different definitions. Please reproduce the original equation and definition, state the mapping precisely, and either compute T1/2 with the same spectral lines, atmosphere, and wavelength s
- [§2.1.4 and Figures 2–3] The reported error magnitude is computed for one MARCS solar model, two Fe I lines, and a single set of free parameters. The abstract's qualitative claim ('can break down') is well supported, but the quantitative statements in the abstract and §2.2 ('will have mis-modeled fluxes at the few percent level') generalize beyond the evidence. The integrated route is still 1D LTE and excludes convective asymmetries, so the error budget is not the error relative to a real star. The manuscript acknowledges model dependence in §4.3 but the abstract and conclusions do not carry this caveat. Please either add a sensitivity check (e.g., a different Teff/log g, a different line, or an alternative atmosphere) or soften the quantitative wording so that it is clearly conditional on the adopted model.
minor comments (5)
- [Eqs. (5) and (17), Figs. 5–6] The 2π factor is missing relative to Eq. (6). Because T1/2 uses normalized cumulative functions, the formation-temperature results are unaffected, but the absolute axes in Figs. 5–6 and the stated dimensions of the flux contribution function are wrong. Please make the convention consistent.
- [§2.2, paragraph 2] The cross-reference 'shown in Figure 2.1.4' should be 'Figure 3.'
- [§4.3, limiting assumptions] The paper states it assumes a 'gray' atmosphere, but the MARCS model and Korg synthesis are wavelength-dependent. Please correct this mischaracterization.
- [Abstract / Conclusions] The quantitative statement that EPRV spectroscopy 'will have mis-modeled fluxes at the few percent level' is stronger than the evidence, which is based on one atmosphere model and two Fe I lines. The limitations from §4.3 should be reflected in the abstract and conclusions.
- [Software availability] The FormationTemperatures.jl package is mentioned but no version/DOI or a demonstration that it reproduces the figures is given. Adding a tagged release with a reproducibility statement would strengthen the contribution.
Circularity Check
No material circularity; the central convolution-vs-integration and intensity-vs-flux derivations are independent. One explicitly acknowledged, non-load-bearing tautology appears in the §4.1 stellar-sample illustration.
-
other
[§4.1 (Flux Errors Across a Stellar Sample), Figure 8 discussion]
"We acknowledge that this exercise is somewhat tautological: stellar properties are often measured by fitting model spectra to data, and so any errors resulting from erroneous assumption made in the flux model (i.e., Figure 2) will propagate to errors in the inferred parameters that are then used as input to produce Figure 8."
The sample exercise feeds the assumption under test back into its inputs: the Brewer et al. stellar parameters (v sin i, Teff, etc.) were themselves inferred from model fits, so any bias from the convolution approximation is already encoded in them; the Figure 8 error distribution is therefore partly a restatement of the same modeling assumption rather than an independent prediction. The paper explicitly labels this 'somewhat tautological' and disclaims individual-star accuracy, and the central results (§2.1.4, §3.1) do not depend on this exercise.
full rationale
The paper's central derivation chain starts from the standard plane-parallel radiative transfer equation (Eq. 1), obtains emergent intensity (Eq. 2), emergent flux (Eqs. 5-6), and defines intensity and flux contribution functions as the integrands of those equations (Eqs. 15 and 17). The convolution-vs-integration comparison in §2.1.4 evaluates two independent numerical implementations of the same well-established physics: a stationary flux convolved with the Hirano et al. kernel versus an explicit disk integration over local intensities with Gray's anisotropic radial-tangential kernel. The input velocities, limb-darkening coefficients, and atmospheric parameters are chosen test values, not tuned to force the conclusion, and the comparison is internally consistent and falsifiable. The §3.1 intensity-vs-flux formation-temperature result follows mathematically from the distinct integrands C(tν, μ=1)=S e^{-t} and C(tν)=S E2(t); no fitted parameter is renamed as a prediction. The critique of Al Moulla et al. rests on an external attribution that the preprint does not reproduce in full, but that is a verification/correctness concern rather than circularity. There is no load-bearing self-citation, no imported uniqueness theorem, and no ansatz smuggled in via citation. The only acknowledged feedback loop is the §4.1 stellar-sample illustration, which the author explicitly calls 'somewhat tautological' and explicitly disclaims as an accurate per-star prediction; it is not load-bearing for the paper's main claims. Overall, the derivation is self-contained and not circular in any significant way.
Assumptions & free parameters
free parameters (6)
- v sin i (rotational broadening) =
grid 0–16 km/s; solar case 2.1 km/s
- ζRT (radial-tangential macroturbulence velocity) =
grid 0–10 km/s; solar case 3 km/s
- Microturbulent velocity ξ =
1.4 km/s in two-line runs; Bruntt et al. (2010) T_eff-parameterization for sample
- Quadratic limb-darkening coefficients u1, u2 =
u1 ≈ 0.465, u2 ≈ 0.165
- AR = AT (radial/tangential photon fractions) =
0.5
- ζR = ζT =
ζRT
assumptions (6)
- domain assumption LTE: source function Sν = Planck function Bν (§2, Eq. 1–2)
- domain assumption Plane-parallel, horizontally homogeneous, time-static 1D atmosphere (§2, §4.3)
- domain assumption Isotropic Gaussian microturbulence broadens the absorption coefficient (Eq. 7)
- domain assumption Radial-tangential macroturbulence with ζR=ζT=ζRT and AR=AT=0.5 (§2.1.3, §2.1.4)
- domain assumption Solid-body rotation for both convolution and disk-integrated spectra (§2.1.2, §2.1.4)
- domain assumption MARCS model atmospheres, Asplund et al. (2021) abundances, and VALD line data are adequate for the comparison (§2.1.4, Table 1)
Cite this review
Pith. "Pith review of The Limits of Line Broadening: Modeling Stellar Spectra and Formation Temperatures at High Resolution." pith.science (2026). https://pith.science/paper/V6EEIWRI
@misc{pith2026251209861,
  author       = {Pith},
  title        = {Pith review of: The Limits of Line Broadening: Modeling Stellar Spectra and Formation Temperatures at High Resolution},
  year         = {2026},
  howpublished = {\url{https://pith.science/paper/V6EEIWRI}},
  note         = {Machine review of arXiv:2512.09861}
}
read the original abstract
The modeling of stellar spectra is pervasive in astronomy. Conventionally, the shapes of absorption lines are modeled by convolving thermal profiles (computed given some model stellar atmosphere and line list) with broadening kernels intended to account for the effects of rotation and other nonthermal sources of broadening (i.e., macroturbulence). Here, we show that the assumptions that permit this convolution can break down at high spectral resolution and produce appreciable errors in the modeled flux. We then consider the effects of rotation, microturbulence, and macroturbulence on the intensity and flux contribution functions, which astronomers use to map individual spectral segments to quasi-physical formation "locations" in the stellar atmosphere. We show that proper consideration of 1) the distinction between intensity and flux and 2) the inclusion of rotation and macroturbulence in the contribution function can dramatically change the modeled formation temperatures. To complement this analysis, we provide a package -- FormationTemperatures -- which quickly computes model line contribution functions and formation parameters given bulk stellar properties as input. In closing, we emphasize the assumptions inherent to this analysis, consider in which regimes the convolution expression for flux should be avoided, and caution how the concept of a singular "formation temperature" can oversimplify some realities of radiative transfer.
Figures


Figures from the paper (6 more)


Reference graph
Works this paper leans on
-
[1]
Abramowitz, M., & Stegun, I. A. 1972, Handbook of Mathematical Functions Al Moulla, K., Dumusque, X., & Cretignier, M. 2024, A&A, 683, A106, doi: 10.1051/0004-6361/202348150 Al Moulla, K., Dumusque, X., Cretignier, M., Zhao, Y., &
-
[2]
Valenti, J. A. 2022, A&A, 664, A34, doi: 10.1051/0004-6361/202243276 Anna John, A., Al Moulla, K., O’Sullivan, N. K., et al. 2025, MNRAS, 543, 1974, doi: 10.1093/mnras/staf1523
-
[3]
Asplund, M., Amarsi, A. M., & Grevesse, N. 2021, A&A, 653, A141, doi: 10.1051/0004-6361/202140445
-
[4]
Baum, A. C., Wright, J. T., Luhn, J. K., & Isaacson, H. 2022, AJ, 163, 183, doi: 10.3847/1538-3881/ac5683
-
[5]
Behmard, A., Ness, M. K., Casey, A. R., et al. 2025, ApJ, 982, 13, doi: 10.3847/1538-4357/adaf1f
-
[6]
2018, IEEE Transactions on Parallel and Distributed Systems, doi: 10.1109/TPDS.2018.2872064
Besard, T., Foket, C., & De Sutter, B. 2018, IEEE Transactions on Parallel and Distributed Systems, doi: 10.1109/TPDS.2018.2872064
arXiv 2018
-
[7]
Bezanson, J., Edelman, A., Karpinski, S., & Shah, V. B. 2017, SIAM Review, 59, 65, doi: 10.1137/141000671
-
[8]
2001, A&A, 374, 733, doi: 10.1051/0004-6361:20010730
Bouchy, F., Pepe, F., & Queloz, D. 2001, A&A, 374, 733, doi: 10.1051/0004-6361:20010730
Show all 39 references
-
[9]
M., & Fischer, D
Brewer, J. M., & Fischer, D. A. 2018, ApJS, 237, 38, doi: 10.3847/1538-4365/aad501
2018 doi
-
[10]
M., Fischer, D
Brewer, J. M., Fischer, D. A., Valenti, J. A., & Piskunov, N. 2016, ApJS, 225, 32, doi: 10.3847/0067-0049/225/2/32
2016 doi
-
[11]
M., Fischer, D
Brewer, J. M., Fischer, D. A., Valenti, J. A., & Piskunov, N. 2017, ApJS, 230, 12, doi: 10.3847/1538-4365/aa6d5a
2017 doi
-
[12]
R., Quirion, P.-O., et al
Bruntt, H., Bedding, T. R., Quirion, P.-O., et al. 2010, MNRAS, 405, 1907, doi: 10.1111/j.1365-2966.2010.16575.x
2010
- [13]
-
[14]
2020, A&A, 635, A206, doi: 10.1051/0004-6361/201937221
Casasayas-Barris, N., Pallé, E., Yan, F., et al. 2020, A&A, 635, A206, doi: 10.1051/0004-6361/201937221
2020 doi
-
[15]
1950, Radiative transfer
Chandrasekhar, S. 1950, Radiative transfer
1950
- [16]
-
[17]
M., Anderson, D
Doyle, L., Cegla, H. M., Anderson, D. R., et al. 2023, MNRAS, 522, 4499, doi: 10.1093/mnras/stad1240
2023 doi
-
[18]
M., Witzke, V., et al
Frame, G., Cegla, H. M., Witzke, V., et al. 2025, MNRAS, 539, 2248, doi: 10.1093/mnras/staf639 García Pérez, A. E., Allende Prieto, C., Holtzman, J. A., et al. 2016, AJ, 151, 144, doi: 10.3847/0004-6256/151/6/144
2025 doi
-
[19]
Gray, D. F. 1982, ApJ, 255, 200, doi: 10.1086/159818
1982 doi
-
[20]
Gray, D. F. 2008, The Observation and Analysis of Stellar Photospheres
2008
-
[21]
2008, A&A, 486, 951, doi: 10.1051/0004-6361:200809724
Gustafsson, B., Edvardsson, B., Eriksson, K., et al. 2008, A&A, 486, 951, doi: 10.1051/0004-6361:200809724
2008 doi
-
[22]
N., et al
Hirano, T., Suto, Y., Winn, J. N., et al. 2011, ApJ, 742, 69, doi: 10.1088/0004-637X/742/2/69
2011 doi
-
[23]
Hunter, J. D. 2007, Computing in Science and Engineering, 9, 90, doi: 10.1109/MCSE.2007.55
2007 doi
-
[24]
2003, ApJL, 584, L107, doi: 10.1086/374037
Johansson, S., Litzén, U., Lundberg, H., & Zhang, Z. 2003, ApJL, 584, L107, doi: 10.1086/374037
2003 doi
- [25]
-
[26]
M., & Lind, K
Lagae, C., Amarsi, A. M., & Lind, K. 2025, A&A, 697, A60, doi: 10.1051/0004-6361/202452874
2025 doi
-
[27]
D., et al
Leitherer, C., Schaerer, D., Goldader, J. D., et al. 1999, ApJS, 123, 3, doi: 10.1086/313233
1999 doi
-
[28]
Baum, A. C. 2022, ApJL, 936, L23, doi: 10.3847/2041-8213/ac8b13
2022 doi
-
[29]
1994, SoPh, 153, 91, doi: 10.1007/BF00712494
Neckel, H., & Labs, D. 1994, SoPh, 153, 91, doi: 10.1007/BF00712494
1994 doi
-
[30]
2002, A&A, 388, 632, doi: 10.1051/0004-6361:20020433 Broadening Kernels and Formation Temperatures 15
Pepe, F., Mayor, M., Galland, F., et al. 2002, A&A, 388, 632, doi: 10.1051/0004-6361:20020433 Broadening Kernels and Formation Temperatures 15
2002 doi
-
[31]
2002, A&A, 381, 736, doi: 10.1051/0004-6361:20011517
Piskunov, N., & Kochukhov, O. 2002, A&A, 381, 736, doi: 10.1051/0004-6361:20011517
2002 doi
-
[32]
E., Kupka, F., Ryabchikova, T
Piskunov, N. E., Kupka, F., Ryabchikova, T. A., Weiss, W. W., & Jeffery, C. S. 1995, A&AS, 112, 525
1995
-
[33]
2016, A&A, 586, A67, doi: 10.1051/0004-6361/201527439
Asplund, M. 2016, A&A, 586, A67, doi: 10.1051/0004-6361/201527439
2016 doi
-
[34]
Rutten, R. J. 2003, Radiative Transfer in Stellar Atmospheres
2003
-
[35]
1906, Nachrichten von der Königlichen Gesellschaft der Wissenschaften zu Göttingen
Schwarzschild, K. 1906, Nachrichten von der Königlichen Gesellschaft der Wissenschaften zu Göttingen. Math.-phys. Klasse, 195, 41
1906
-
[36]
A., & Piskunov, N
Valenti, J. A., & Piskunov, N. 1996, A&AS, 118, 595
1996
-
[37]
S., Penrod, G
Vogt, S. S., Penrod, G. D., & Hatzes, A. P. 1987, ApJ, 321, 496, doi: 10.1086/165647
1987 doi
-
[38]
J., Abruzzo, M
Wheeler, A. J., Abruzzo, M. W., Casey, A. R., & Ness, M. K. 2023, AJ, 165, 68, doi: 10.3847/1538-3881/acaaad
2023 doi
-
[39]
J., Casey, A
Wheeler, A. J., Casey, A. R., & Abruzzo, M. W. 2024, AJ, 167, 83, doi: 10.3847/1538-3881/ad19cc
2024 doi
Reviewed August 3, 2026 · model on record in the stance chip above.
Discussion (0). Continue with ORCID to comment.