REVIEW 4 major objections 8 minor 205 references
Low-mass galaxies at z≈6 follow a steeper mass–metallicity relation than local galaxies, and their UV nitrogen lines reveal globular-cluster-like enrichment.
Reviewed by Pith at T0; open to challenge. T0 means a machine referee read the full paper against a public rubric. the ladder, T0–T4 →
T0 review · deepseek-v4-flash
2026-08-01 23:05 UTC pith:WB5I3B46
load-bearing objection Strong new JWST data extend the z~6 MZR to 10^6.6 Msun and show a stacked UV–optical N/O offset, but the steep low-mass slope relies on a Te scale that neglects O+3 and on a calibration fitted to the same stacks. the 4 major comments →
Gas-Phase Metallicity and Nitrogen Abundances in Low-Mass Galaxies Down to M_starsimeq10^(5.7)\,M_odot at zsimeq4.5--10.1 from JWST Lensing Cluster Surveys
The pith
A machine-rendered reading of the paper's core claim, the machinery that carries it, and where it could break.
Core claim
The central discovery is that chemical enrichment in the lowest-mass high-redshift galaxies is both globally ordered and locally diverse. On the global scale, the gas-phase oxygen abundance falls steeply with stellar mass, with a fitted low-mass slope γ = 0.38 ± 0.06 that is steeper than the local relation; the relation reaches 12 + log(O/H) ≈ 7.2 at about 10^6.6 solar masses and matches a range of hydrodynamical simulations. On the local scale, the stacked spectrum at about 10^7.7 solar masses shows N/O from N IV] λλ1483,1486 that is about 1.4 dex higher than N/O from [N II] λ6583, with subsolar C/O and He II 4686/Hβ ≈ 0.03. The authors interpret this as a multi-zone interstellar medium in
What carries the argument
The central machinery is mass-binned stacking of roughly 100 medium-resolution spectra (and about 400 at low resolution), which brings faint diagnostic lines above detection threshold. Metallicities come from the direct method using the [O III] 4363 auroral line under a two-zone ionization model with a fixed relation between low- and high-ionization electron temperatures; the authors then calibrate the R3 ([O III] 5007/Hβ) and R2 ([O II] 3727/Hβ) strong-line ratios against these direct metallicities to extend measurements to galaxies without auroral detections. The mass–metallicity relation is fitted with a turnover function. Nitrogen is measured twice: from the high-ionization UV doublet N
Load-bearing premise
The entire metallicity scale rests on direct-method oxygen abundances that assume a two-zone ionization structure with a fixed electron-temperature relation (low-ionization temperature = 0.7 times high-ionization temperature plus 3,000 K) and neglect O+3; if this temperature or ionization prescription is biased, the calibrations, the mass–metallicity slope, and the N/O comparison all shift together.
What would settle it
Measure [O III] 88 µm together with [O III] 5007 in a magnified galaxy with stellar mass near 10^6.6 solar masses at z~6: the far-infrared line gives an independent electron temperature and oxygen abundance. A value of 12 + log(O/H) more than about 0.3 dex above 7.2 at that mass would flatten the low-mass slope. Alternatively, a single high-signal-to-noise spectrum with auroral-line temperatures from both [O III] 4363 and [O II] 7325 that disagrees with the assumed two-zone temperature relation would force recalibration.
If this is right
- If the steep slope holds, the smallest galaxies at z~6 lose or dilute most of their metals, so their interstellar oxygen abundances sit roughly ten times below local galaxies of the same mass.
- The new empirical strong-line calibrations can be applied to faint JWST samples without auroral lines, extending metallicity measurements to mass regimes that are otherwise inaccessible.
- The systematic disagreement between UV and optical nitrogen diagnostics in the same systems means abundance interpretations based on only one spectral window are incomplete; each window traces a different gas phase.
- Nitrogen overabundance seen in bright individual galaxies is also present in stacked low-mass populations, making it a common enrichment mode rather than a rare anomaly.
- The comparable nitrogen mass in stellar winds and in globular-cluster enriched populations points to a concrete channel by which early, compact star formation could seed the abundance patterns seen in ancient star clusters.
Where Pith is reading between the lines
- If the multi-zone reading is right, single-zone N/O values in the literature that rely on UV lines alone are likely biased high by bright, N-rich clumps; correcting for this could bring many high-redshift nitrogen emitters back onto the local N/O–O/H sequence.
- The same stacks could test the Wolf–Rayet hypothesis directly: medium-resolution spectroscopy of individual magnified clumps in z~6 lensed arcs should show whether N IV] and He II peak on globular-cluster-scale regions while [N II] traces the surrounding diffuse gas.
- A prediction of the enrichment-burst picture is that metallicity and N/O should vary stochastically with star-formation history; comparing these stacks with simulations that track 10-million-year bursts could discriminate prompt Wolf–Rayet enrichment from delayed AGB winds.
- The empirical calibration approach could be extended to C/O and Ne/O as functions of stellar mass, giving a two-element clock for the onset of enrichment in the lowest-mass galaxies.
Editorial analysis
A structured set of objections, weighed in public.
Referee Report
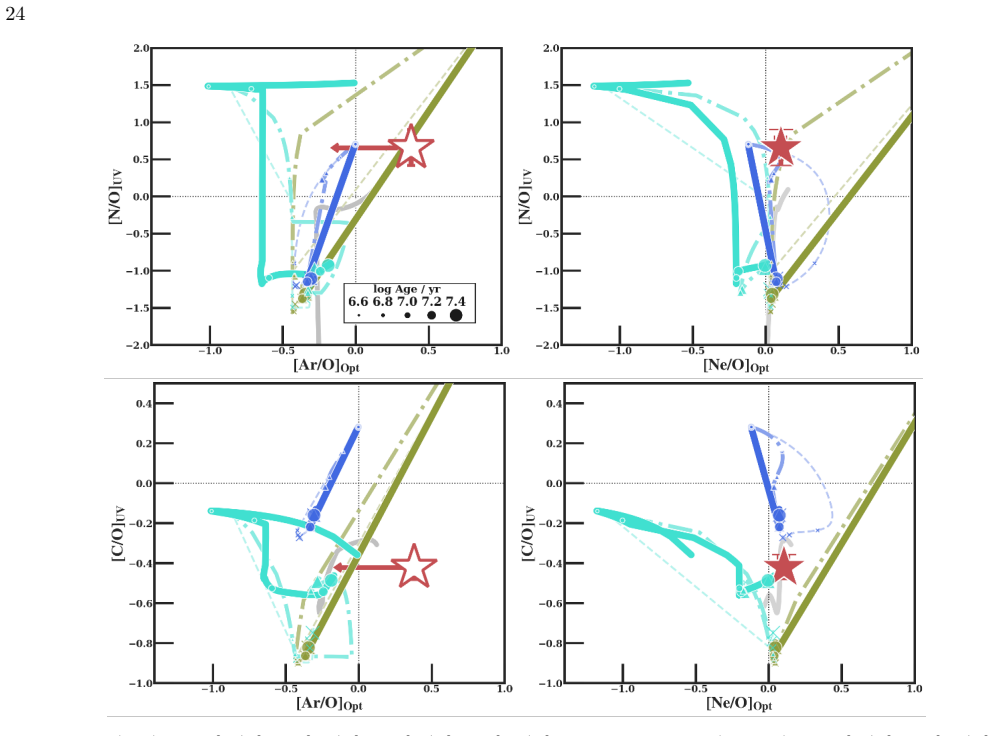
Summary. Umeda et al. analyze 405 JWST/NIRSpec spectra of gravitationally lensed star-forming galaxies at z=4.5–10.1 from the DREAMS, GLIMPSE-D, GLASS, ERO, SPURS, UNCOVER, and CANUCS programs, with 50% of the M_UV>−17.5 sources magnified by μ>3. They construct stellar-mass-binned stacks (GM1–GM4, GAll and prism-resolution analogs), detect [OIII]λ4363 down to a representative stellar mass of ~10^6.6 M⊙, and derive direct-method oxygen abundances using a two-zone Te scheme (Eqs. 3–4). They fit new empirical R3/R2 strong-line calibrations (§4.4.2) to the direct-method stack metallicities, individual auroral-line detections, and local analogs, then apply them to trace the z~6 MZR to M*≈10^6.6 M⊙, fitting a Zahid et al. (2014) form with low-mass slope γ=0.38±0.06 (Table 6), reported as slightly steeper than the local γ≈0.28. In the GAll stack (M*≈10^7.7), the Niv]-based [N/O] is 0.66±0.24, ~1.4 dex above the [Nii]-based value (−0.73±0.11); with subsolar C/O and HeII λ4686/Hβ≈0.03, this is interpreted as a multi-zone ISM containing a localized, N-rich, globular-cluster-like component, with an order-of-magnitude estimate suggesting that a WNE-like stellar population could supply the required nitrogen mass.
Significance. The compiled lensing sample and the stacking products are a valuable community resource: the MZR baseline is extended two decades below previous z~6 measurements, the [OIII]λ4363 detection at M*≈10^6.6 M⊙ is a technically demanding result, and the tabulated empirical (Table 6) and photoionization-model (Table 7) calibrations are directly usable. The UV–optical N/O comparison in an average low-mass galaxy, if secure, would strengthen the case that nitrogen enhancement is widespread at high redshift and connect early enrichment to globular-cluster abundance patterns. These strengths are real, but the headline claims are currently anchored on a partly circular calibration, an unquantified O+3 systematic on the Te scale, and ~3σ line detections. The good news is that each of these can be quantified or tested with the authors' own model grids and robustness fits; the manuscript does not currently do so.
major comments (4)
- [§4.4.2, §4.5, Eq. (7), Fig. 10] The new R3/R2 calibration is fitted using the direct-method metallicities of the same GM1–GM4 grating stacks (plus individual auroral-line detections and Andrews & Martini 2013 analogs) that are then used to construct the empirical MZR. The agreement between the direct and empirical methods shown in Fig. 10 is therefore partly by construction for the stacks, and the claim in §4.4.2 that this agreement 'demonstrates the internal consistency of the calibration' overstates the validation. The empirical MZR does not independently confirm the direct-method MZR; both trace the same Te-scale anchors. Please report the stack residuals in the calibration fit and perform a leave-one-stack-out cross-validation, so the reader can see how well the calibration predicts a stack excluded from the fit.
- [§4.4.1, Eq. (4), Table 4, §5.1] Eq. (4) sums only O+ and O+2, and the paper notes (end of §4.4.1) that neglecting O+3 'may introduce a systematic uncertainty for systems with hard ionizing spectra' — exactly the regime probed here: HeII λ4686/Hβ≈0.03 (Table 3) and O32≳15 in GM1, decreasing to ≈4 in GM4 (Table 4). If a non-negligible O+3 fraction is present in the low-mass stacks, the direct-method O/H values are underestimated; because O32 is strongly mass-dependent, the bias is mass-dependent and will tend to steepen the fitted low-mass slope γ=0.38±0.06. A +0.1–0.2 dex correction at the GM1–GM2 end would bring the slope to the local value within the quoted uncertainty; the current ~1.7σ difference from the local γ≈0.28 is not robust to this systematic. Please quantify O+3/O using the paper's own Cloudy model grids (Appendix A) at the observed O32, C43, and HeII strengths, and quote γ with and without the correction.
- [Table 2, Table 4, §4.5] The two lowest-mass anchors are fragile. (i) GM1's [OIII]λ4363/Hβ=0.12±0.04 is a ~3σ detection, at the adopted stack threshold; its direct-method oxygen abundance (12+log(O/H)=7.27^{+0.21}_{-0.14}) carries this statistical fragility into the MZR fit. (ii) GM1's [OII] is a 3σ upper limit (<0.21), so R2 is not measured, yet the quoted empirical metallicity uncertainty for GM1 (7.27±0.06) is smaller than the direct-method uncertainty and it is unclear how the upper limit enters the likelihood of Eq. (6). Because GM1 is the point that controls the difference between γ=0.38 and the local γ≈0.28, the paper should show the MZR refit with GM1 excluded and state explicitly how upper limits are propagated in Eq. (6).
- [§4.6.1, Table 3, Appendix A] The claimed 1.4-dex discrepancy between [N/O]UV=0.66±0.24 and [N/O]Opt=−0.73±0.11 rests on the Niv] λλ1483,1486 detection in GAll at S/N≈3 (flux 0.12±0.05; the stack detection criterion is S/N≥3), and on a photoionization-model ionization correction whose AGN variant shifts the Niv]/Oiii] calibration by ≈0.2 dex (Table 7). Please report the achieved S/N of Niv] explicitly, propagate the spread among the stellar, AGN, and WNE calibrations (Table 7) into [N/O]UV, and state how the significance of the 1.4-dex offset is affected once this model systematic is included. As written, the statistical and model uncertainty budget is not sufficient to establish the discrepancy quantitatively, even though the direction of the offset is consistent with literature results.
minor comments (8)
- [§4.2, Table 6] The fitted O32 relation is printed as logO32 = −0.243±0.004 + (2.89±0.27) log(M⋆/M⊙). As written this has the wrong sign/roles: it predicts O32 increasing steeply with stellar mass, contradicting the text ('higher ionization parameter at lower stellar mass') and Fig. 7; the intended relation is logO32 ≈ 2.89 − 0.24 log(M⋆/M⊙) (with the coefficients interchanged and b1 negative). Since this relation is used to infer R2 in Eq. (6), the printed formula must be corrected for reproducibility.
- [Table 4] The O32 column lists linear ratio values (e.g., 12.86^{+2.17}_{-1.47} for GM2 and the lower limit >15.01 for GM1) while §4.2 and Fig. 7 work in log space. Please state units in the column header and mark GM1's entry explicitly as a lower limit throughout (as done in Table 2 for [OII]).
- [§4.5, Table 6] The MZR is fit to four stack points with three effective free parameters (β fixed at 49). Report the covariance among Z0, logM0, and γ, and add the 0.07–0.08 dex RMS of the strong-line calibration (Table 6) and Te-scale systematics to the quoted γ uncertainty. The abstract's 'slightly steeper' is appropriately cautious, but Summary item 2 ('steep low-mass-end slope... sharp decrease') is stronger than justified by a ~1.7σ difference from the local γ≈0.28.
- [§2.5–§4.5] The sample spans z=4.5–10.1 and the MZR is labelled z~6. Please state the median redshift of each stack (GM1–GM4, GAll) to quantify the epoch over which each stack is averaged; a ~1-Gyr baseline could introduce redshift-evolution scatter into the stacked MZR.
- [Tables 2–3] Please report the achieved S/N for the marginal detections ([OIII]λ4363 in GM1, Niv] in GAll, [NII]λ6583 in GAll) in the tables, since the stacked criterion is S/N≥3 and several values sit at or near this boundary.
- [§2.1.1] The DREAMS data reduction is described as 'forthcoming (Nakajima et al., in preparation)'. For reproducibility, cite the public data products or the companion pipeline paper, and provide the same for the other survey reductions where available.
- [Throughout] Typographical issues: 'T able' (Table 1 caption); 'W AIC'/'∆W AIC' (§2.3); inconsistent 'Wolf-Rayet' vs 'Wolf–Rayet'; 'Hβflux' missing space (§3); corrupted symbol 'λW4686' in the abstract; 'D WN' in the Acknowledgments; 'MAG AUTO' should be MAG_AUTO; mass-loss units 'M⊙ yr−1' are missing after Ṁ in §5.3.
- [Introduction, References] The Introduction cites 'A. J. Cameron et al. 2023' for high-z nitrogen enhancement; the widely used reference for a nitrogen-enhanced galaxy at z~5–7 is Cameron et al. 2024 (Nature). Please verify the intended citation and that the reference list entries ('Cameron et al. 2023' and 'Cameron et al. 2026') correspond to the claimed results.
Circularity Check
The empirical-calibration MZR for the stacks re-states the same direct-method O/H values the calibration was fitted to; the steep low-mass slope is not an independent strong-line prediction, though the direct-method MZR gives some independent support.
specific steps
-
fitted input called prediction
[Section 4.4.2 (Strong-Line Calibrations), Section 4.5 (Mass–Metallicity Relation), Eq. (7), Table 6, Figs. 9–10]
"Instead of adopting a calibration from the literature, we derive empirical relations between the strong-line ratios and direct-method metallicity ... The fit uses our grating stacked spectra and individual measurements with auroral-line detections. ... Based on the newly derived calibration, we derive strong-line based empirically calibrated metallicities ... for individual galaxies and stacked spectra using the observed R3 and R2 values. ... We fit the MZR using the stacked spectra metallicity measurements based on the empirical calibration."
The R2/R3 calibration is fitted to direct-method 12+log(O/H) values of the same grating stacks (GM1–GM3) and individual galaxies with [OIII]4363 detections. Those same stacks are then assigned 12+log(O/H)_Emp by inverting that calibration, so their empirical metallicities coincide with the direct-method inputs to within the polynomial fit residuals (Fig. 10). Fitting the MZR (Eq. 7) to these empirical stack values therefore makes the resulting low-mass slope gamma=0.38+/-0.06 a smoothed re-statement of the direct Te-based O/H of the same bins, not an independent strong-line prediction. GM1 is additionally self-referential: [OII] is a non-detection, so R2 is imported from the O32–M* relation fitted on the same stacks, making the lowest-mass anchor twice dependent on its own direct-method va
full rationale
The identifiable circular step is confined to the empirical strong-line calibration pipeline. The paper explicitly fits the calibration to direct-method metallicities of the grating stacks and then uses the empirically calibrated metallicities of those same stacks to fit the MZR; for GM1–GM3 the empirical values are, by construction, close to the input direct-method values. Therefore the advertised 'empirical calibration' MZR for the stacks is not an independent confirmation of the direct-method result. The paper does, however, also present a direct-method MZR (Fig. 12) that is independent of the calibration itself, and the direct Te measurements are not derived from the strong-line calibration. So the steep low-mass slope is not wholly manufactured; it inherits whatever systematic biases are in the Te method (e.g., the assumed Te([OII])–Te([OIII]) relation and neglected O+3), which is a correctness/robustness concern rather than circularity per se. No load-bearing self-citation or uniqueness-imported-from-authors pattern was found; self-citations to Isobe, Nakajima, Ouchi, and other (partly overlapping) works are methodological and do not by themselves force the conclusions. Score 5 reflects one genuine partial circularity in the empirical-calibration MZR, with the central claim still retaining independent direct-method content.
Axiom & Free-Parameter Ledger
free parameters (4)
- MZR fit parameters (Z0, logM0, gamma, beta) =
Z0=8.06±0.09, log(M0/Msun)=8.85±0.31, gamma=0.38±0.06, beta=49
- Strong-line calibration coefficients (c0,c1,c2 for logR3 and logR2) =
logR3: 0.0680, 1.8282, -1.0690; logR2: -1.2276, 1.7359, -0.3747
- Stellar-mass–line-ratio relations (logO32, logC43) =
logO32 = -0.243 + 2.89 logM; logC43 = -0.60 + 4.33 logM
- WNE/GC mass-budget assumptions =
N_WN~1650, t_WNE=0.5 Myr, X_N=1.5e-3, f_enriched=0.7, [N/H]_enriched=-0.7, M_GC=2e5 Msun
axioms (8)
- domain assumption Te([OII]) = 0.7 Te([OIII]) + 3000 K
- domain assumption Two-zone ionization model neglecting O+3
- domain assumption Electron density adopted from Topping et al. (2025) redshift relation
- domain assumption BPASS v2.2.1 + Cloudy grids and Calzetti attenuation for SED fitting
- domain assumption Photoionization abundance calibrations assume plane-parallel, constant-density clouds with solar relative abundances
- domain assumption Lensing magnification models are correct
- ad hoc to paper WNE parameters (logT*=5.25, Mdot=1.2e-5 Msun/yr, M*=12 Msun)
- ad hoc to paper Globular-cluster enrichment parameters (f_enriched=0.7, [N/H]_enriched=-0.7, M_GC=2e5 Msun)
invented entities (1)
-
WNE-like stellar population component beyond BPASS
no independent evidence
read the original abstract
We analyze 405 deep JWST/NIRSpec spectra of star-forming galaxies at $z=4.5$--$10.1$ from DREAMS and other lensing-cluster surveys to study chemical enrichment in intrinsically faint, low-mass galaxies. The sample covers $M_{\rm UV}\simeq-12$ to $-22$ and reaches $M_\star\simeq10^{5.7}\,M_\odot$, with 50\% of the sources at $M_{\rm UV}>-17.5$ magnified by $\mu>3$. From individual spectra and mass-binned stacks, we derive the gas-phase metallicity together with nitrogen and carbon abundances using the rest-frame UV and optical lines. \Add{We derive new empirical strong-line metallicity calibrations using direct-method measurements from stellar-mass-binned stacks, reaching a representative stellar mass of $M_\star\simeq10^{6.6}\,M_\odot$. Applying these calibrations, we trace the $z\sim6$ mass--metallicity relation down to $M_\star\simeq10^{6.6}\,M_\odot$, where it reaches $12+\log({\rm O/H})\simeq7.2$, with a low-mass slope slightly steeper than the local relation and in broad agreement with hydrodynamical simulations.} In the $M_\star\simeq10^{7.7}\,M_\odot$ stack, N/O from N\,{\sc iv}]\,$\lambda\lambda\,1483,1486$ exceeds that from [N\,{\sc ii}]\,$\lambda6583$ by $\simeq1.4$ dex. The UV--optical difference could indicate a localized, highly ionized N-rich component whose high N/O and subsolar C/O resemble nitrogen-rich globular-cluster populations with $M_\star\lesssim10^6\,M_\odot$. \Add{The combination of these abundance patterns and a He\,{\sc ii}\,\W4686/H$\beta$ ratio of $\simeq0.03$, well above BPASS predictions, suggests that WR stars may contribute both prompt CNO-cycle enrichment and hard ionizing radiation, with the inferred WR population potentially supplying enough nitrogen to account for the excess on globular-cluster scales.
Figures




Reference graph
Works this paper leans on
-
[1]
The Astrophysical Journal Letters , author =
The. The Astrophysical Journal Letters , author =. 2022 , pages =. doi:10.3847/2041-8213/ac8a4e , abstract =
-
[2]
Tang, Mengtao and Stark, Daniel P. and Mason, Charlotte A. and Chen, Zuyi and Katz, Harley and Gronke, Max and Furtak, Lukas J. and Chang, Seok-Jun and Matthee, Jorryt and Whitler, Lily and Zitrin, Adi and Endsley, Ryan and Gelli, Viola and Roychowdhury, Tamojeet and Senchyna, Peter and Topping, Michael W. and Zhang, Meng , year =. doi:10.48550/ARXIV.2604...
-
[3]
The Astrophysical Journal , author =
The. The Astrophysical Journal , author =. 2026 , pages =. doi:10.3847/1538-4357/ae4edb , abstract =
-
[4]
The Astrophysical Journal , author =. 2023 , pages =. doi:10.3847/1538-4357/ad09be , abstract =
-
[5]
The Astrophysical Journal Supplement Series , author =. 2023 , pages =. doi:10.3847/1538-4365/acd556 , abstract =
-
[6]
Monthly Notices of the Royal Astronomical Society: Letters , author =. 2025 , pages =. doi:10.1093/mnrasl/slaf056 , abstract =
-
[7]
Monthly Notices of the Royal Astronomical Society , author =. 2026 , pages =. doi:10.1093/mnras/stag123 , abstract =
-
[8]
Watanabe, Kuria and Ouchi, Masami and Nakajima, Kimihiko and Tominaga, Nozomu and Harikane, Yuichi and Ishigaki, Miho N. and Isobe, Yuki and Nakane, Minami and Nishigaki, Moka and Nomoto, Ken'ichi and Ono, Yoshiaki and Onodera, Masato and Suzuki, Akihiro and Takahashi, Koh and Takeda, Yui and Yanagisawa, Hiroto , year =. Chemical. doi:10.48550/ARXIV.2603....
-
[9]
The Astrophysical Journal , author =. 2024 , pages =. doi:10.3847/1538-4357/ad13ff , abstract =
-
[10]
The Astrophysical Journal , author =
The. The Astrophysical Journal , author =. 2022 , pages =. doi:10.3847/1538-4357/ac8158 , abstract =
-
[11]
The Astrophysical Journal , author =
The. The Astrophysical Journal , author =. 2024 , pages =. doi:10.3847/1538-4357/ad66cf , abstract =
-
[12]
The Astrophysical Journal Letters , author =
A. The Astrophysical Journal Letters , author =. 2023 , pages =. doi:10.3847/2041-8213/acd1db , abstract =
-
[13]
and Chisholm, John and Atek, Hakim and Brammer, Gabriel and Berg, Danielle A
Fujimoto, Seiji and Asada, Yoshihisa and Naidu, Rohan P. and Chisholm, John and Atek, Hakim and Brammer, Gabriel and Berg, Danielle A. and Schaerer, Daniel and Kokorev, Vasily and Furtak, Lukas J. and Richard, Johan and Venditti, Alessandra and Bromm, Volker and Adamo, Angela and Claeyssens, Adelaide and Dessauges-Zavadsky, Miroslava and Fei, Qinyue and H...
-
[14]
Annual Review of Astronomy and Astrophysics , author =
The. Annual Review of Astronomy and Astrophysics , author =. 2009 , pages =. doi:10.1146/annurev.astro.46.060407.145222 , abstract =
arXiv 2009
-
[15]
Astronomy & Astrophysics , author =. 2020 , pages =. doi:10.1051/0004-6361/201833910 , abstract =
-
[16]
The Astrophysical Journal Supplement Series , author =
Stellar. The Astrophysical Journal Supplement Series , author =. 2021 , pages =. doi:10.3847/1538-4365/abef67 , abstract =
-
[17]
The Astrophysical Journal , author =
Secondary standard stars for absolute spectrophotometry , volume =. The Astrophysical Journal , author =. 1983 , pages =. doi:10.1086/160817 , language =
doi:10.1086/160817 1983
-
[18]
Publications of the Astronomical Society of the Pacific , author =
emcee :. Publications of the Astronomical Society of the Pacific , author =. 2013 , pages =. doi:10.1086/670067 , language =
doi:10.1086/670067 2013
-
[19]
The Astrophysical Journal Letters , author =
The. The Astrophysical Journal Letters , author =. 2024 , pages =. doi:10.3847/2041-8213/ad8dc9 , abstract =
-
[20]
and Atek, Hakim and Brammer, Gabriel and Furtak, Lukas J
Asada, Yoshihisa and Fujimoto, Seiji and Chisholm, John and Naidu, Rohan P. and Atek, Hakim and Brammer, Gabriel and Furtak, Lukas J. and Kokorev, Vasily and Pan, Richard and Basu, Arghyadeep and Bromm, Volker and Dessauges-Zavadsky, Miroslava and Hsiao, Tiger Yu-Yang and Jecmen, Michelle and Korber, Damien and Liu, Boyuan and McKinney, Jed and McQuinn, K...
-
[21]
doi:10.48550/ARXIV.2512.12983 , abstract =
Nishigaki, Moka and Nakajima, Kimihiko and Ouchi, Masami and Behroozi, Peter and Nakane, Minami and Takeda, Yui and Umeda, Hiroya and Yajima, Hidenobu and Yanagisawa, Hiroto , year =. doi:10.48550/ARXIV.2512.12983 , abstract =
-
[22]
Astronomy & Astrophysics , author =. 2024 , pages =. doi:10.1051/0004-6361/202346698 , abstract =
-
[23]
Dilution of chemical enrichment in galaxies 600. Nature Astronomy , author =. 2023 , pages =. doi:10.1038/s41550-023-02078-7 , language =
-
[24]
Monthly Notices of the Royal Astronomical Society , author =
Nitrogen enhancements 440. Monthly Notices of the Royal Astronomical Society , author =. 2023 , pages =. doi:10.1093/mnras/stad1579 , abstract =
-
[25]
Astronomy & Astrophysics , author =. 2023 , pages =. doi:10.1051/0004-6361/202346159 , abstract =
-
[26]
Astronomy & Astrophysics , author =
Nitrogen abundances in star-forming galaxies 2.2. Astronomy & Astrophysics , author =. 2026 , pages =. doi:10.1051/0004-6361/202556832 , abstract =
-
[27]
Astronomy & Astrophysics , author =
N-emitters as possible signposts of globular cluster formation , volume =. Astronomy & Astrophysics , author =. 2026 , pages =. doi:10.1051/0004-6361/202558654 , abstract =
-
[28]
The Astrophysical Journal , author =
The. The Astrophysical Journal , author =. 2019 , pages =. doi:10.3847/1538-4357/ab020a , abstract =
-
[29]
The Astrophysical Journal , author =
Characterizing. The Astrophysical Journal , author =. 2021 , pages =. doi:10.3847/1538-4357/ac141b , abstract =
-
[30]
doi:10.48550/ARXIV.2508.21708 , abstract =
Roberts-Borsani, Guido and Oesch, Pascal and Ellis, Richard and Weibel, Andrea and Giovinazzo, Emma and Bouwens, Rychard and Dayal, Pratika and Fontana, Adriano and Heintz, Kasper and Matthee, Jorryt and Meyer, Romain and Pentericci, Laura and Shapley, Alice and Tacchella, Sandro and Treu, Tommaso and Walter, Fabian and Atek, Hakim and Bose, Sownak and Ca...
-
[31]
The Astrophysical Journal , author =
Between the. The Astrophysical Journal , author =. 2024 , pages =. doi:10.3847/1538-4357/ad85d3 , abstract =
-
[32]
Morishita, Takahiro and Liu, Zhaoran and Stiavelli, Massimo and Treu, Tommaso and Bergamini, Pietro and Zhang, Yechi , year =. Pristine. doi:10.48550/ARXIV.2507.10521 , abstract =
-
[33]
Nakajima, Kimihiko and Ouchi, Masami and Harikane, Yuichi and Vanzella, Eros and Ono, Yoshiaki and Isobe, Yuki and Nishigaki, Moka and Tsujimoto, Takuji and Nakamura, Fumitaka and Xu, Yi and Umeda, Hiroya and Zhang, Yechi , year =. An. doi:10.48550/ARXIV.2506.11846 , abstract =
-
[34]
Astronomy & Astrophysics , author =
A pristine, star-forming complex at. Astronomy & Astrophysics , author =. 2026 , pages =. doi:10.1051/0004-6361/202557153 , abstract =
-
[35]
Cai, Sijia and Yu, Zijian , year =. Discovery of an. doi:10.48550/ARXIV.2601.17498 , abstract =
-
[36]
The Astrophysical Journal , author =
The. The Astrophysical Journal , author =. 2020 , pages =. doi:10.3847/1538-4357/abae65 , abstract =
-
[37]
Astronomy & Astrophysics , author =
The evolution of the. Astronomy & Astrophysics , author =. 2004 , pages =. doi:10.1051/0004-6361:20034188 , number =
-
[38]
The Astrophysical Journal , author =. 2014 , pages =. doi:10.1088/0004-637X/790/2/144 , number =
-
[39]
The Astrophysical Journal , author =
A. The Astrophysical Journal , author =. 2018 , pages =. doi:10.3847/1538-4357/aab7fa , abstract =
-
[40]
The Astrophysical Journal , author =. 2020 , pages =. doi:10.3847/1538-4357/ab7eab , abstract =
-
[41]
Astronomy & Astrophysics , author =
Abundances of. Astronomy & Astrophysics , author =. 2005 , pages =. doi:10.1051/0004-6361:20041892 , number =
-
[42]
Monthly Notices of the Royal Astronomical Society , author =
Gravitationally lensed galaxies at 2. Monthly Notices of the Royal Astronomical Society , author =. 2012 , pages =. doi:10.1111/j.1365-2966.2012.22007.x , language =
arXiv 2012
-
[43]
Monthly Notices of the Royal Astronomical Society , author =
Discovery of the most metal-poor damped. Monthly Notices of the Royal Astronomical Society , author =. 2017 , pages =. doi:10.1093/mnras/stx037 , language =
-
[44]
The Astrophysical Journal , author =. 2010 , pages =. doi:10.1088/0004-637X/719/2/1168 , number =
-
[45]
Monthly Notices of the Royal Astronomical Society , author =
A reappraisal of the chemical composition of the. Monthly Notices of the Royal Astronomical Society , author =. 2004 , pages =. doi:10.1111/j.1365-2966.2004.08313.x , language =
arXiv 2004
-
[46]
The Astrophysical Journal , author =. 2009 , pages =. doi:10.1088/0004-637X/700/1/654 , number =
-
[47]
Monthly Notices of the Royal Astronomical Society , author =
Carbon and oxygen abundances from recombination lines in low-metallicity star-forming galaxies. Monthly Notices of the Royal Astronomical Society , author =. 2014 , pages =. doi:10.1093/mnras/stu1177 , language =
-
[48]
Astronomy & Astrophysics , author =
The. Astronomy & Astrophysics , author =. 2009 , pages =. doi:10.1051/0004-6361/200810095 , number =
-
[49]
The Astrophysical Journal Supplement Series , author =
Chemical. The Astrophysical Journal Supplement Series , author =. 2004 , pages =. doi:10.1086/421909 , language =
-
[50]
Monthly Notices of the Royal Astronomical Society , author =
Deep echelle spectrophotometry of. Monthly Notices of the Royal Astronomical Society , author =. 2005 , pages =. doi:10.1111/j.1365-2966.2005.09302.x , language =
arXiv 2005
-
[51]
Gustafsson, B. and Karlsson, T. and Olsson, E. and Edvardsson, B. and Ryde, N. , year =. The origin of carbon, investigated by spectral analysis of solar-type stars in the. doi:10.48550/ARXIV.ASTRO-PH/9811303 , abstract =
-
[52]
and Fudamoto, Yoshinobu and Bunker, Andrew J
Hsiao, Tiger Yu-Yang and Sun, Fengwu and Lin, Xiaojing and Coe, Dan and Egami, Eiichi and Eisenstein, Daniel J. and Fudamoto, Yoshinobu and Bunker, Andrew J. and Fan, Xiaohui and Harikane, Yuichi and Helton, Jakob M. and Kakiichi, Koki and Liu, Yichen and Liu, Weizhe and Maiolino, Roberto and Ouchi, Masami and Tee, Wei Leong and Wang, Feige and Wu, Yunjin...
-
[53]
The Astrophysical Journal , author =
The. The Astrophysical Journal , author =. 2025 , pages =. doi:10.3847/1538-4357/adf63e , abstract =
-
[54]
Monthly Notices of the Royal Astronomical Society , author =
Scrutiny of a very young, metal-poor star-forming. Monthly Notices of the Royal Astronomical Society , author =. 2022 , pages =. doi:10.1093/mnras/stac3198 , abstract =
-
[55]
Astronomy & Astrophysics , author =
The chemical composition of metal-poor emission-line galaxies in the. Astronomy & Astrophysics , author =. 2006 , pages =. doi:10.1051/0004-6361:20053763 , number =
-
[56]
Monthly Notices of the Royal Astronomical Society , author =
Testing metallicity indicators at z ∼ 1.4 with the gravitationally lensed galaxy. Monthly Notices of the Royal Astronomical Society , author =. 2014 , pages =. doi:10.1093/mnras/stu287 , language =
-
[57]
The Astrophysical Journal , author =. 2023 , pages =. doi:10.3847/1538-4357/acdbc6 , abstract =
-
[58]
Astronomy & Astrophysics , author =. 2024 , pages =. doi:10.1051/0004-6361/202348636 , abstract =
-
[59]
The Astrophysical Journal , author =. 2024 , pages =. doi:10.3847/1538-4357/ad5f88 , abstract =
-
[60]
Astronomy & Astrophysics , author =. 2025 , pages =. doi:10.1051/0004-6361/202451410 , abstract =
-
[61]
Astronomy & Astrophysics , author =
Extreme. Astronomy & Astrophysics , author =. 2024 , pages =. doi:10.1051/0004-6361/202347411 , abstract =
-
[62]
The Astrophysical Journal Letters , author =
A. The Astrophysical Journal Letters , author =. 2022 , pages =. doi:10.3847/2041-8213/ac9ab2 , abstract =
-
[63]
Monthly Notices of the Royal Astronomical Society , author =
Metal-poor star formation at. Monthly Notices of the Royal Astronomical Society , author =. 2024 , pages =. doi:10.1093/mnras/stae682 , abstract =
-
[64]
Astronomy & Astrophysics , author =
Discovery of a new. Astronomy & Astrophysics , author =. 2024 , pages =. doi:10.1051/0004-6361/202450721 , abstract =
-
[65]
The Astrophysical Journal Letters , author =. 2023 , pages =. doi:10.3847/2041-8213/acc94b , abstract =
-
[66]
The Astrophysical Journal , author =. 2024 , pages =. doi:10.3847/1538-4357/ad6562 , abstract =
-
[67]
A magnified compact galaxy at redshift 9.51 with strong nebular emission lines , volume =. Science , author =. 2023 , pages =. doi:10.1126/science.adf5307 , abstract =
-
[68]
The Astrophysical Journal , author =
The. The Astrophysical Journal , author =. 2007 , pages =. doi:10.1086/510112 , language =
doi:10.1086/510112 2007
-
[69]
Monthly Notices of the Royal Astronomical Society , author =. 2020 , pages =. doi:10.1093/mnras/staa751 , abstract =
-
[70]
Monthly Notices of the Royal Astronomical Society , author =
The. Monthly Notices of the Royal Astronomical Society , author =. 2021 , pages =. doi:10.1093/mnras/stab1304 , abstract =
-
[71]
Astronomy & Astrophysics , author =
Carbon and oxygen abundances in stellar populations , volume =. Astronomy & Astrophysics , author =. 2014 , pages =. doi:10.1051/0004-6361/201424184 , urldate =
-
[72]
The Astrophysical Journal , author =
Chemical. The Astrophysical Journal , author =. 2005 , pages =. doi:10.1086/444557 , language =
doi:10.1086/444557 2005
-
[73]
The Astrophysical Journal , author =
Evidence of. The Astrophysical Journal , author =. 2023 , pages =. doi:10.3847/1538-4357/acc39f , abstract =
-
[74]
Monthly Notices of the Royal Astronomical Society , author =
Ultraviolet spectra of extreme nearby star-forming regions – approaching a local reference sample for. Monthly Notices of the Royal Astronomical Society , author =. 2017 , pages =. doi:10.1093/mnras/stx2059 , language =
-
[75]
Astronomy & Astrophysics , author =
Evidence of. Astronomy & Astrophysics , author =. 2024 , pages =. doi:10.1051/0004-6361/202349062 , abstract =
-
[76]
Monthly Notices of the Royal Astronomical Society , author =
Ultraviolet emission lines in young low-mass galaxies at z ≃ 2: physical properties and implications for studies at z. Monthly Notices of the Royal Astronomical Society , author =. 2014 , pages =. doi:10.1093/mnras/stu1618 , language =
-
[77]
Monthly Notices of the Royal Astronomical Society , author =
Carbon and oxygen abundance gradients in. Monthly Notices of the Royal Astronomical Society , author =. 2016 , pages =. doi:10.1093/mnras/stw397 , language =
-
[78]
Monthly Notices of the Royal Astronomical Society , author =
Carbon and oxygen in. Monthly Notices of the Royal Astronomical Society , author =. 2017 , pages =. doi:10.1093/mnras/stx328 , language =
-
[79]
Monthly Notices of the Royal Astronomical Society , author =
Heavy elements in. Monthly Notices of the Royal Astronomical Society , author =. 2003 , pages =. doi:10.1046/j.1365-8711.2003.06081.x , language =
arXiv 2003
-
[80]
Monthly Notices of the Royal Astronomical Society , author =
bond:. Monthly Notices of the Royal Astronomical Society , author =. 2016 , pages =. doi:10.1093/mnras/stw971 , language =
discussion (0)
Sign in with ORCID, Apple, or X to comment. Anyone can read and Pith papers without signing in.