REVIEW 3 major objections 5 minor 1 cited by
(Re)solving the Complex Multiscale Morphology and V-shaped Spectral Energy Distribution of a Newly Discovered Strongly Lensed Little Red Dot in A383
T0 review · 3 major / 5 minor · reviewed 2026-08-03 · deepseek-v4-flash
Pith's one-line read A strongly lensed 'little red dot' at redshift 6 resolves into two distinct components whose combined light produces the V-shaped SED.
desk verdict First spatial decomposition of an LRD's V-shape into two distinct sources, with a robust spatial offset but an overstated 'unambiguous' and some missing ALMA context. read the letter →
The pith
A machine-rendered reading of the paper's core claim, the machinery that carries it, and where it could break.
The reading
What carries the argument
The load-bearing mechanism is strong gravitational lensing by the cluster, which stretches and magnifies the source so that an otherwise point-like LRD becomes separable into components. The analytic workhorse is a three-component Sersic surface-brightness decomposition (red dot, blue dot, and a bridging component), followed by forced photometry that fixes the shapes and fits only the brightness of each component in every filter; this yields spatially resolved SEDs. The V-shape itself—the 'double break' at the Lyman and Balmer limits seen in f_lambda—is the identity being explained: the paper shows it equals the sum of a flat blue continuum and a steep red continuum that overtakes the blue a
What would settle it
Spatially resolved spectroscopy that maps the emission lines and continuum of the red and blue components would settle it: if the 'red' SED traces the same gas or stellar population as the bridge, or if the blue and red components share identical redshifts, line widths, and velocity centroids, the two-source interpretation would collapse. Conversely, a clean kinematic offset or differing line ratios between the dots would confirm it. A simpler check: if an ALMA detection of dust continuum from the red component matches a star-forming interpretation, the non-stellar alternative weakens.
Extended reading notes
Core claim
On the paper's own terms, the central discovery is that the V-shaped SED of this LRD is not an intrinsic feature of a single component but arises from the combined light of two physically distinct sources. Using three-component surface-brightness models and forced photometry, the authors decompose the system into a blue component with a flat rest-frame UV continuum, consistent with a young stellar population of about 3×10^8 solar masses and low dust, and a red component with a steep red SED, consistent either with an evolved, massive (about 6×10^10 solar masses), heavily dust-attenuated stellar population or with a reddened AGN. After correcting for lensing, both components are tiny—roughly
Load-bearing premise
The paper's conclusion depends on the three-component decomposition cleanly separating the red dot and the bridge; if flux assigned to the red component actually belongs to the bridge (or vice versa), the claim that the V-shape arises from two physically distinct components loses its support.
Editorial extensions
If this is right
- If this system is representative, the V-shaped SEDs of LRDs do not require a single exotic source; they can be produced by the superposition of a young unobscured star-forming component and a red compact component.
- Unlensed LRDs with the same colors likely hide the same dual structure: the two components would blend into a point-like source at JWST resolution.
- Emission-line diagnostics measured from integrated spectra may be mixtures of lines from the blue, red, and bridge components, so attributing all lines to one region can mislead.
- The red component's extreme compactness and steep SED, combined with a lack of ALMA dust continuum, leave a non-stellar origin (e.g., dense gas or an accreting black hole) viable alongside the stellar interpretation.
- High-resolution spectroscopy that can resolve the ~300 pc separation would directly test whether the red component hosts an accreting black hole or an evolved stellar population.
Reading between the lines
- If the two-component interpretation generalizes, many LRDs may be early-stage merging or dual systems—a star-forming clump and a compact red source on sub-kiloparsec scales—rather than single objects; this would revise mass and density estimates for the population.
- The near-coincidence that the red component begins to dominate exactly at the Balmer break, if real across LRDs, suggests the break wavelength is set by dust or age rather than by a universal AGN feature; this could be tested by comparing the break position across a sample.
- A testable extension: high-signal spectroscopy of unlensed LRDs should reveal two kinematic components (offset velocities or composite line profiles) if the same dual structure is common.
- The paper's model systematic—the red/bridge degeneracy—implies that the true sizes and fluxes of the red component are uncertain beyond the quoted random errors; future higher-resolution imaging or IFU data could calibrate this.
Editorial analysis
A structured set of objections, weighed in public.
Referee Report
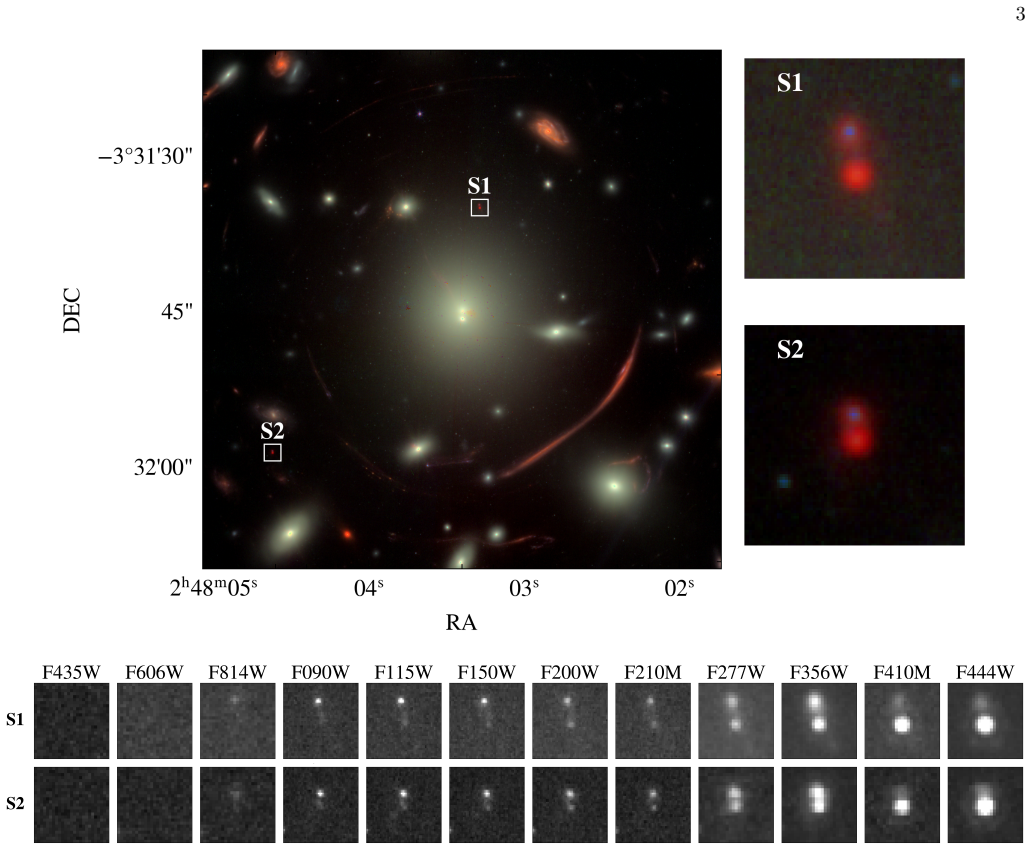
Summary. This paper presents JWST/NIRCam observations of a z=6.027 Little Red Dot (LRD) that is doubly imaged by the galaxy cluster Abell 383, with magnifications μ≈11 (S1) and μ≈7 (S2). It is the second strongly lensed LRD known and the brightest by nearly two magnitudes. The high magnification and stretching resolve the source into components that are invisible in unlensed observations: a compact red dot, a spatially offset blue dot, and a fainter 'bridge' plus extended line emission. Multi-band GALFIT decomposition (with injection-recovery uncertainties), forced photometry, and EAZY stellar-population fits give the blue component a flat rest-UV SED (young stellar population, M* ≈ 3×10^8 M☉) and the red component a steeply rising SED that is interpreted as an old, heavily dust-attenuated stellar population (M* ≈ 6×10^10 M☉) or a reddened AGN. The paper's central claim is that the iconic V-shaped LRD SED is not intrinsic to a single source but arises from the superposition of these two physically distinct components separated by ~300 pc in the source plane, with implications for the interpretation of the entire LRD population.
Significance. If the decomposition holds, this is a landmark observation. It is the first system in which the blue and red parts of an LRD SED are spatially separated, providing a direct test of AGN versus stellar interpretations of the LRD population. The paper has real methodological strengths: the lensing consistency checks are convincing (the S1/S2 flux ratio tracks the predicted magnification ratio, and the demagnified SEDs of the two images overlap); the blue component is stable across two- and three-component fits, so its SED is robust; the PSF-only fits demonstrate that the red component is genuinely resolved in F277W/F356W; and the paper is transparent about the red/bridge degeneracy in Appendix A. These strengths make the core morphological result credible. The weakness is that the paper's headline interpretive claim is worded more strongly than the supporting SED decomposition allows, and the abstract asserts an ALMA constraint that does not appear in the body.
major comments (3)
- [Section 4 (concluding paragraph); Tables 2–3; Appendix A] The claim that the V-shaped SED 'unambiguously' arises from two physically distinct sources is not supported by the preceding analysis. The red component's short-wavelength SED is the weak link: the red/bridge partition shifts the red F090W flux by 1.6 mag between the two-component fit (Table 3: 27.0) and the three-component fit (Table 2: 28.6±0.6), exceeding the quoted 1σ uncertainty. §3.2 concedes that the two- vs three-component systematic 'may exceed the quoted errors,' and the forced photometry fixes shapes to F200W, where the red component is faintest relative to the blue (1.2 mag vs ~2.3 mag at F090W). The same paragraph states the SEDs are 'indicative rather than definitive,' in tension with 'unambiguous.' Please either soften the claim or add a robustness test (e.g., recompute the V-shape decomposition under the two-component partition, where the red short-wavelength SED is flat
- [Abstract vs. body] The abstract asserts that the stellar interpretation of the red component 'is challenged by Atacama Large Millimeter/submillimeter Array dust continuum upper limits, suggesting a nonstellar origin such as dense gas configurations.' No ALMA observations, upper limits, or analysis appear anywhere in the body, whose own abstract instead concludes that the red SED 'can be interpreted as either an evolved stellar population with high stellar mass or a reddened AGN.' If ALMA data were obtained, they must be presented (bands, beam, rms, inferred limits, and the SED modeling used to derive the constraint); otherwise the abstract claims a constraint that the paper neither shows nor references. An unsupported constraint in the abstract is a substantive inconsistency that must be resolved before publication.
- [Section 5.3] The intrinsic red–blue separation derived from S1 (~0.10'', ~600 pc) is a factor of two larger than the S2-based value (~0.05'', ~300 pc) that the paper adopts, on the grounds that S1 lies near the critical curve where the radial magnification is unreliable. This rejection is plausible, but the factor-of-two discrepancy is an unquantified systematic on a number that is central to the abstract ('separated by only ~300 pc') and the Discussion. Please supply a quantitative error budget for μ_θ at the S1 position (e.g., the spread across the Lenstool/GLEE realizations), or otherwise demonstrate that the S2 measurement is robust, and report the separation with an uncertainty that encompasses the model spread.
minor comments (5)
- [Section 6, footnote 5] The inserted condolence footnote about A. Dekel is out of place in the main text of a scientific article; if the sentiment is intended, it belongs in the Acknowledgments. As written it is an unusual editorial insertion.
- [Section 2.2] 'Perfect agreement' between the observed S1/S2 flux ratios and the predicted magnification ratio overstates the flatness: the observed ratios run from 1.27 (F090W) to 1.61 (F444W) against μ1/μ2 ≈ 1.48. They are consistent within the quoted lens-model uncertainties, but the mild wavelength trend (chromaticity, or ICL contamination in S1) deserves a comment rather than 'perfect agreement.'
- [Section 3.2; Tables 2–3] The text says GALFIT fits are performed 'across all available bands,' but Tables 2 and 3 present only NIRCam filters. Clarify whether the HST/ACS and WFC3 bands entered the structural decomposition and the component SEDs of §4, and how the substantially larger HST PSFs were handled.
- [Section 3.4 vs. Section 4] Section 3.4 reports that the summed three-component flux is up to ~25% below the aperture flux in the rest-UV. The component SEDs in Figure 5 should be explicitly labeled as excluding this diffuse light, and the text should state whether the V-shape decomposition changes if the diffuse component (whose SED is unmeasured) is included.
- [Table 2 (bridge rows)] The bridge magnitude in F200W (28.1±0.4) and F210M (28.4±0.5) is measured with r_e pinned near the 0.5-pixel lower limit; state the detection significance of the bridge in these bands, since the bridge SED drives the red/bridge partition that the central claim depends on.
Circularity Check
No significant circularity: the V-shape decomposition is driven by spatially resolved imaging, not by the conclusion.
full rationale
The central claim—that the V-shaped SED arises from the superposition of spatially distinct blue and red components—is not circular. The components are identified morphologically in the NIRCam images and modeled with GALFIT, with the component SEDs then measured by forced photometry in each band. The conclusion follows from measured fluxes rather than from an assumed SED shape or from the template fits. The lens model is adopted from external CLASH models and Richard et al. (2011), and the magnification-ratio consistency check is an external test, not a fitted input. The red/bridge degeneracy documented in Appendix A and Section 4 ('indicative rather than definitive') is a model-systematic/robustness limitation, not a circular reduction: the two- and three-component fits are independent ways to decompose the same image, and the blue component is shown to be robust to that choice. The only overlapping-author citation (Baggen et al. 2024 scaling arguments in Section 6) is an interpretive projection for velocity dispersions and is not load-bearing for the V-shape claim. No equation in the paper is equivalent to its input by construction, and no fitted parameter is renamed as a prediction.
Assumptions & free parameters
free parameters (3)
- Sersic index n (fixed) =
1.5
- Blue component stellar parameters (EAZY fit) =
M*≈3e8 Msun, A_V≈0.07, SFR≈1 Msun/yr
- Red component stellar parameters (EAZY fit) =
M*≈6e10 Msun, A_V≈2.6, SFR≈10 Msun/yr
assumptions (5)
- domain assumption The CLASH Lenstool/GLEE lens models for A383, computed at z=2.55, remain valid for the source at z=6.027 after scaling kappa, gamma, and deflections by beta=1.04 (Eq. 1).
- domain assumption The three-component GALFIT model (red, blue, bridge; Sersic n=1.5 fixed) captures the true surface brightness distribution well enough that forced photometry yields true component SEDs.
- domain assumption FSPS template set 'tweak fsps QSF 12 v3' with purely stellar emission represents the blue and red component SEDs; no AGN component is included.
- domain assumption The Planck18 flat Lambda-CDM cosmology is adopted.
- domain assumption Flux excesses in F356W and F444W are dominated by strong emission lines (H-beta+[OIII] and H-alpha) at z=6.027.
Cite this review
Pith. "Pith review of (Re)solving the Complex Multiscale Morphology and V-shaped Spectral Energy Distribution of a Newly Discovered Strongly Lensed Little Red Dot in A383." pith.science (2026). https://pith.science/paper/YMM5NZZG
@misc{pith2026251203239,
  author       = {Pith},
  title        = {Pith review of: (Re)solving the Complex Multiscale Morphology and V-shaped Spectral Energy Distribution of a Newly Discovered Strongly Lensed Little Red Dot in A383},
  year         = {2026},
  howpublished = {\url{https://pith.science/paper/YMM5NZZG}},
  note         = {Machine review of arXiv:2512.03239}
}
abstract
We present a luminous "little red dot" (LRD) at $z$ = 6.027, doubly imaged by the galaxy cluster A383 and observed with the James Webb Space Telescope (JWST) NIRCam. Owing to its large magnifications, $\mu$ $\sim$ 11 for image A383-LRD1A and $\mu$ $\sim$ 7 for A383-LRD1B, the system is exceptionally bright and highly stretched, providing a rare, spatially resolved view of an LRD. The images reveal a complex morphology with a compact red dot, a spatially offset blue dot, and faint emission bridging and surrounding the two. After correcting for lensing, the blue and red dots have rest-frame UV and optical sizes of $\sim 60$ pc and $\lesssim 150$ pc, respectively, while extended emission traced most clearly in F356W ([O III]+H$\beta$) reaches scales of order $\sim 1$ kpc. Spatially resolved spectral energy distribution (SED) analysis reveals that the characteristic V-shaped SED arises from the superposition of a flat UV continuum from the blue dot, consistent with a young stellar population, and a steep red SED from the red dot, which, based on Hubble Space Telescope+JWST photometry alone, admits a straightforward stellar interpretation as a massive, heavily dust-attenuated component. However, this interpretation is challenged by Atacama Large Millimeter/submillimeter Array dust continuum upper limits, suggesting a nonstellar origin such as dense gas configurations. Separated by only $\sim$ 300 pc in the source plane, these components would blend into a single compact source in unlensed observations with the canonical LRD colors. This system therefore provides a rare opportunity to resolve the internal structure of an LRD and to begin unraveling the physical nature of this population.
Figures


Figures from the paper (5 more)


Forward citations
Cited by 1 Pith paper
-
ATLAS. II. Extremely High Incidence of Balmer Line Absorption with Predominant Blueshifts in LRDs: Statistical Insights through Comparison with Type 1 AGNs
Balmer-line absorption occurs in ~35% (14/40) of JWST little-red-dot AGNs, roughly 850x the rate in SDSS type-1 AGNs, with mostly slow blueshifted absorber velocities.
Reference graph
Works this paper leans on
-
[1]
Akins, H. B., Casey, C. M., Allen, N., et al. 2023, ApJ, 956, 61, doi: 10.3847/1538-4357/acef21
-
[2]
Akins, H. B., Casey, C. M., Lambrides, E., et al. 2024, arXiv e-prints, arXiv:2406.10341, doi: 10.48550/arXiv.2406.10341
-
[3]
Akins, H. B., Casey, C. M., Berg, D. A., et al. 2025, ApJL, 980, L29, doi: 10.3847/2041-8213/adab76
-
[4]
Ananna, T. T., Bogd´ an,´A., Kov´ acs, O. E., Natarajan, P., & Hickox, R. C. 2024, ApJL, 969, L18, doi: 10.3847/2041-8213/ad5669 Astropy Collaboration, Price-Whelan, A. M., Lim, P. L., et al. 2022, ApJ, 935, 167, doi: 10.3847/1538-4357/ac7c74
-
[5]
Baggen, J. F. W., van Dokkum, P., Labb´ e, I., et al. 2023, ApJL, 955, L12, doi: 10.3847/2041-8213/acf5ef
-
[6]
Baggen, J. F. W., van Dokkum, P., Brammer, G., et al. 2024, ApJL, 977, L13, doi: 10.3847/2041-8213/ad90b8
-
[7]
Barro, G., P´ erez-Gonz´ alez, P. G., Kocevski, D. D., et al. 2024, ApJ, 963, 128, doi: 10.3847/1538-4357/ad167e
-
[8]
Begelman, M. C., & Dexter, J. 2025, arXiv e-prints, arXiv:2507.09085, doi: 10.48550/arXiv.2507.09085
Show all 59 references
-
[9]
C., Volonteri, M., & Rees, M
Begelman, M. C., Volonteri, M., & Rees, M. J. 2006, MNRAS, 370, 289, doi: 10.1111/j.1365-2966.2006.10467.x
2006
-
[10]
2025, astropy/photutils: 2.2.0, 2.2.0 Zenodo, doi: 10.5281/zenodo.14889440
Bradley, L., Sip˝ ocz, B., Robitaille, T., et al. 2025, astropy/photutils: 2.2.0, 2.2.0 Zenodo, doi: 10.5281/zenodo.14889440
2025 doi
-
[11]
2022, grizli, 1.5.0 Zenodo, doi: 10.5281/zenodo.6672538
Brammer, G., Strait, V., Matharu, J., & Momcheva, I. 2022, grizli, 1.5.0 Zenodo, doi: 10.5281/zenodo.6672538
2022 doi
-
[12]
B., van Dokkum, P
Brammer, G. B., van Dokkum, P. G., & Coppi, P. 2008, ApJ, 686, 1503, doi: 10.1086/591786
2008 doi
-
[13]
J., Stone, Z., Shen, Y., & Jiang, Y.-F
Burke, C. J., Stone, Z., Shen, Y., & Jiang, Y.-F. 2025, arXiv e-prints, arXiv:2511.16082, doi: 10.48550/arXiv.2511.16082
2025 doi
-
[14]
J., Adams, N., et al
Carranza-Escudero, M., Conselice, C. J., Adams, N., et al. 2025, ApJL, 989, L50, doi: 10.3847/2041-8213/adf73d
2025 doi
-
[15]
C., Li, R., & Inayoshi, K
Chen, C.-H., Ho, L. C., Li, R., & Inayoshi, K. 2025, ApJL, 989, L12, doi: 10.3847/2041-8213/adee0a
2025 doi
-
[16]
2023, MNRAS, 520, 2180, doi: 10.1093/mnras/stac3791 de Graaff, A., Rix, H.-W., Naidu, R
Claeyssens, A., Adamo, A., Richard, J., et al. 2023, MNRAS, 520, 2180, doi: 10.1093/mnras/stac3791 de Graaff, A., Rix, H.-W., Naidu, R. P., et al. 2025, arXiv e-prints, arXiv:2503.16600, doi: 10.48550/arXiv.2503.16600
-
[17]
2023, MNRAS, 523, 3201, doi: 10.1093/mnras/stad1557
Li, Z. 2023, MNRAS, 523, 3201, doi: 10.1093/mnras/stad1557
2023 doi
-
[18]
2025, arXiv e-prints, arXiv:2511.07578, doi: 10.48550/arXiv.2511.07578 D’Eugenio, F., Nelson, E., Ji, X., et al
Dekel, A., Dutta Chowdhury, D., Lapiner, S., et al. 2025, arXiv e-prints, arXiv:2511.07578, doi: 10.48550/arXiv.2511.07578 D’Eugenio, F., Nelson, E., Ji, X., et al. 2025a, arXiv e-prints, arXiv:2510.00101, doi: 10.48550/arXiv.2510.00101 D’Eugenio, F., Maiolino, R., Perna, M., ...
2025 doi
-
[19]
2018, ApJS, 239, 35, doi: 10.3847/1538-4365/aaee8c
Diemer, B. 2018, ApJS, 239, 35, doi: 10.3847/1538-4365/aaee8c
2018 doi
-
[20]
J., Zitrin, A., Plat, A., et al
Furtak, L. J., Zitrin, A., Plat, A., et al. 2023, ApJ, 952, 142, doi: 10.3847/1538-4357/acdc9d
2023 doi
-
[21]
J., Labb´ e, I., Zitrin, A., et al
Furtak, L. J., Labb´ e, I., Zitrin, A., et al. 2024, Nature, 628, 57, doi: 10.1038/s41586-024-07184-8
2024 doi
-
[22]
J., Duncan, K
Gloudemans, A. J., Duncan, K. J., Eilers, A.-C., et al. 2025, ApJ, 986, 130, doi: 10.3847/1538-4357/adddb9
2025 doi
-
[23]
E., Labbe, I., Goulding, A
Greene, J. E., Labbe, I., Goulding, A. D., et al. 2024, ApJ, 964, 39, doi: 10.3847/1538-4357/ad1e5f
2024 doi
-
[24]
2023, ApJ, 959, 39, doi: 10.3847/1538-4357/ad029e
Harikane, Y., Zhang, Y., Nakajima, K., et al. 2023, ApJ, 959, 39, doi: 10.3847/1538-4357/ad029e
2023 doi
-
[25]
Hunter, J. D. 2007, Computing in Science and Engineering, 9, 90, doi: 10.1109/MCSE.2007.55
2007 doi
-
[26]
E., de Graaff, A., Miller, T
Hviding, R. E., de Graaff, A., Miller, T. B., et al. 2025, arXiv e-prints, arXiv:2506.05459, doi: 10.48550/arXiv.2506.05459
2025 doi
-
[27]
2025, ApJL, 980, L27, doi: 10.3847/2041-8213/adaebd
Inayoshi, K., & Maiolino, R. 2025, ApJL, 980, L27, doi: 10.3847/2041-8213/adaebd
2025 doi
-
[28]
2025, MNRAS, doi: 10.1093/mnras/staf1867
Ji, X., Maiolino, R., ¨Ubler, H., et al. 2025, MNRAS, doi: 10.1093/mnras/staf1867
2025 doi
-
[29]
2007, New Journal of Physics, 9, 447, doi: 10.1088/1367-2630/9/12/447 Juodˇ zbalis, I., Maiolino, R., Baker, W
Jullo, E., Kneib, J.-P., Limousin, M., et al. 2007, New Journal of Physics, 9, 447, doi: 10.1088/1367-2630/9/12/447 Juodˇ zbalis, I., Maiolino, R., Baker, W. M., et al. 2024, arXiv e-prints, arXiv:2403.03872, doi: 10.48550/arXiv.2403.03872 Juodˇ zbalis, I., Marconcini, C., D’E...
-
[30]
2024, A&A, 691, A52, doi: 10.1051/0004-6361/202348857
Killi, M., Watson, D., Brammer, G., et al. 2024, A&A, 691, A52, doi: 10.1051/0004-6361/202348857
2024 doi
-
[31]
D., Onoue, M., Inayoshi, K., et al
Kocevski, D. D., Onoue, M., Inayoshi, K., et al. 2023, ApJL, 954, L4, doi: 10.3847/2041-8213/ace5a0
2023 doi
- [32]
-
[33]
2024, ApJ, 975, 178, doi: 10.3847/1538-4357/ad7d03 Labb´ e, I., van Dokkum, P., Nelson, E., et al
Kokorev, V., Chisholm, J., Endsley, R., et al. 2024, ApJ, 975, 178, doi: 10.3847/1538-4357/ad7d03 Labb´ e, I., van Dokkum, P., Nelson, E., et al. 2023, Nature, 616, 266, doi: 10.1038/s41586-023-05786-2 16
2024 doi
- [34]
-
[35]
Leung, G. C. K., Finkelstein, S. L., P´ erez-Gonz´ alez, P. G., et al. 2025, ApJ, 992, 26, doi: 10.3847/1538-4357/adfcce
2025 doi
-
[36]
2024, A&A, 691, A145, doi: 10.1051/0004-6361/202347640
Maiolino, R., Scholtz, J., Curtis-Lake, E., et al. 2024, A&A, 691, A145, doi: 10.1051/0004-6361/202347640
2024 doi
-
[37]
P., Brammer, G., et al
Matthee, J., Naidu, R. P., Brammer, G., et al. 2024, ApJ, 963, 129, doi: 10.3847/1538-4357/ad2345
2024 doi
- [38]
-
[39]
2025, arXiv e-prints, arXiv:2509.02664, doi: 10.48550/arXiv.2509.02664
Pacucci, F., Hernquist, L., & Fujii, M. 2025, arXiv e-prints, arXiv:2509.02664, doi: 10.48550/arXiv.2509.02664
2025 doi
-
[40]
Y., Ho, L
Peng, C. Y., Ho, L. C., Impey, C. D., & Rix, H.-W. 2002, AJ, 124, 266, doi: 10.1086/340952
2002 doi
-
[41]
Y., Ho, L
Peng, C. Y., Ho, L. C., Impey, C. D., & Rix, H.-W. 2010, AJ, 139, 2097, doi: 10.1088/0004-6256/139/6/2097 P´ erez-Gonz´ alez, P. G., Barro, G., Rieke, G. H., et al. 2024, ApJ, 968, 4, doi: 10.3847/1538-4357/ad38bb Planck Collaboration VI. 2020, A&A, 641, A6, doi: 10.1051/0004-...
2010 doi
-
[42]
2012, ApJS, 199, 25, doi: 10.1088/0067-0049/199/2/25
Postman, M., Coe, D., Ben ´ ıtez, N., et al. 2012, ApJS, 199, 25, doi: 10.1088/0067-0049/199/2/25
2012 doi
-
[43]
2011, MNRAS, 414, L31, doi: 10.1111/j.1745-3933.2011.01050.x
Richard, J., Kneib, J.-P., Ebeling, H., et al. 2011, MNRAS, 414, L31, doi: 10.1111/j.1745-3933.2011.01050.x
2011
-
[44]
H., et al
Rinaldi, P., Bonaventura, N., Rieke, G. H., et al. 2024, arXiv e-prints, arXiv:2411.14383, doi: 10.48550/arXiv.2411.14383
2024 doi
-
[45]
J., Treu, T., Ellis, R
Sand, D. J., Treu, T., Ellis, R. S., & Smith, G. P. 2005, ApJ, 627, 32, doi: 10.1086/430298
2005 doi
-
[46]
J., Treu, T., Ellis, R
Sand, D. J., Treu, T., Ellis, R. S., Smith, G. P., & Kneib, J.-P. 2008, ApJ, 674, 711, doi: 10.1086/524652
2008 doi
-
[47]
D., Farag, E., Bellinger, E
Santarelli, A. D., Farag, E., Bellinger, E. P., et al. 2025, arXiv e-prints, arXiv:2510.17952, doi: 10.48550/arXiv.2510.17952
2025 doi
-
[48]
Sersic, J. L. 1968, Atlas de Galaxias Australes
1968
- [49]
-
[50]
J., Greene, J
Setton, D. J., Greene, J. E., Spilker, J. S., et al. 2025, ApJL, 991, L10, doi: 10.3847/2041-8213/ade78b
2025 doi
-
[51]
P., Richard, J., Charlot, S., et al
Stark, D. P., Richard, J., Charlot, S., et al. 2015, MNRAS, 450, 1846, doi: 10.1093/mnras/stv688
2015 doi
-
[52]
H., & Halkola, A
Suyu, S. H., & Halkola, A. 2010, A&A, 524, A94, doi: 10.1051/0004-6361/201015481 van der Walt, S., Colbert, S. C., & Varoquaux, G. 2011, Computing in Science and Engineering, 13, 22, doi: 10.1109/MCSE.2011.37
2010 doi
-
[53]
2023, ApJ, 945, 53, doi: 10.3847/1538-4357/acb59a
Vanzella, E., Claeyssens, A., Welch, B., et al. 2023, ApJ, 945, 53, doi: 10.3847/1538-4357/acb59a
2023 doi
-
[54]
E., et al
Virtanen, P., Gommers, R., Oliphant, T. E., et al. 2020, Nature Methods, 17, 261, doi: 10.1038/s41592-019-0686-2
2020 doi
-
[55]
2024, ApJL, 969, L13, doi: 10.3847/2041-8213/ad55f7
Wang, B., Leja, J., de Graaff, A., et al. 2024, ApJL, 969, L13, doi: 10.3847/2041-8213/ad55f7
2024 doi
- [56]
-
[57]
R., Cutler, S
Weaver, J. R., Cutler, S. E., Pan, R., et al. 2024, ApJS, 270, 7, doi: 10.3847/1538-4365/ad07e0
2024 doi
-
[58]
C., Alberts, S., Ji, Z., et al
Williams, C. C., Alberts, S., Ji, Z., et al. 2024, ApJ, 968, 34, doi: 10.3847/1538-4357/ad3f17
2024 doi
-
[59]
2015, ApJ, 801, 44, doi: 10.1088/0004-637X/801/1/44
Zitrin, A., Fabris, A., Merten, J., et al. 2015, ApJ, 801, 44, doi: 10.1088/0004-637X/801/1/44
2015 doi
Reviewed August 3, 2026 · model on record in the stance chip above.
Discussion (0). Sign in to comment.