REVIEW 3 major objections 6 minor 41 references
F-SE-LSTM: A Time Series Anomaly Detection Method with Frequency Domain Information
T0 review · 3 major / 6 minor · reviewed 2026-08-11 · deepseek-v4-flash
Pith's one-line read Time-series anomalies too subtle for the time domain become separable when the series is recast as a frequency matrix; F-SE-LSTM uses that representation and reports consistent F1 gains over five deep baselines on Yahoo and NAB data.
desk verdict A coherent frequency-matrix architecture with a leaky evaluation: the central outperformance claim is unsupported. read the letter →
The pith
A machine-rendered reading of the paper's core claim, the machinery that carries it, and where it could break.
The reading
What carries the argument
The central object is the frequency matrix $\mathbf{S}_f \in \mathbb{R}^{H \times (F+1)}$: sliding the sample window once to get $H=N-T+1$ overlapping rows of length $T$, then applying the fast Fourier transform row-wise and keeping the magnitude spectrum $y(n)=|X(n)|$ for $n=0,\ldots,\lfloor T/2\rfloor$. Because the spectrum of a real sequence is conjugate-symmetric, only $\lfloor T/2\rfloor+1$ frequency bins carry information, so the matrix keeps compact frequency content while preserving which period each frequency profile came from. The model then delegates two complementary tasks to this matrix: SENet, a channel-attention network, squeezes each channel to a scalar and excites important frequency-channel combinations, extracting dependencies among frequencies inside the same period; LSTM processes the $H$ period rows as a sequence of hidden states, extracting dependencies among frequencies across periods; and a DNN reduces the LSTM output to a binary anomaly decision.
What would settle it
Train F-SE-LSTM and its strongest baseline on samples taken only from the first portion of each sequence and test on samples from the remaining, non-overlapping portion, or hold out a set of complete time series. If the F1 advantage of the frequency matrix largely disappears under this temporally separated split, the claimed outperformance is an artifact of overlapping train and test windows; if the advantage persists, the representation itself is doing the work.
Extended reading notes
Core claim
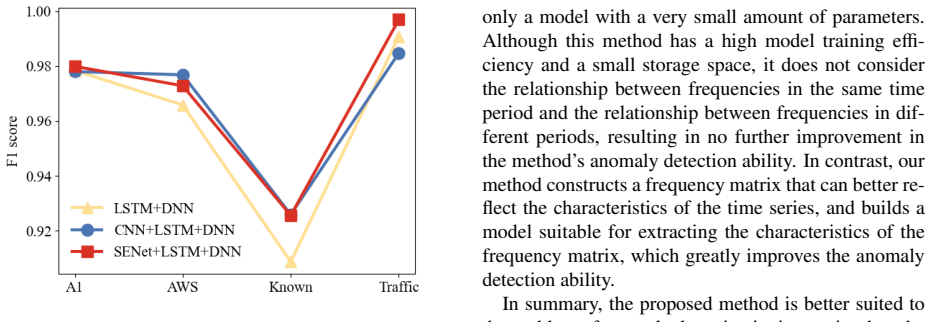
The paper's central claim is that a frequency matrix built from two overlapping sliding windows is a better input representation for time-series anomaly detection than raw time-domain vectors, isolated frequency vectors, or time-domain matrices, and that the combination of SENet and LSTM is the right way to consume it. A length-60 sample is first cut into 31 overlapping length-30 subsequences; each subsequence is transformed by FFT into 16 amplitude bins ($F=\lfloor 30/2\rfloor=15$, plus the zero-frequency bin), producing a $31\times 16$ frequency matrix $\mathbf{S}_f$. SENet applies channel attention to emphasize useful frequency-channel combinations inside each period, LSTM reads the period rows as 31 time steps to model between-period frequency dependencies, and a DNN with dropout outputs the binary anomaly verdict. In the authors' experiments, F-SE-LSTM reaches F1 scores of 0.9799, 0.9728, 0.9256, and 0.9969 on the A1, AWS, Known, and Traffic datasets, an average F1 of 0.9688 against a best baseline average of 0.9566, and it does so with 35,654 parameters and a 379-second training time.
Load-bearing premise
The paper's load-bearing premise, stated in its data-preprocessing step, is that randomly partitioning the overlapping sliding-window samples into 60/20/20 train/validation/test sets yields independent evaluation data.
Editorial extensions
If this is right
- If the reported results hold, the frequency matrix encoding alone explains a large part of the gain: in the paper's tables, frequency-domain features beat time-domain features for kNN, logistic regression, SVM, decision trees, and random forests on all four datasets.
- SENet plus LSTM is presented as a more stable architecture than CNN plus LSTM for this input, because it reaches the highest F1 on all four datasets whereas the CNN variant drops below LSTM-only on two of them.
- The low parameter count of 35,654 and the 379-second training time mean the method is light enough to retrain frequently in network and IoT monitoring settings.
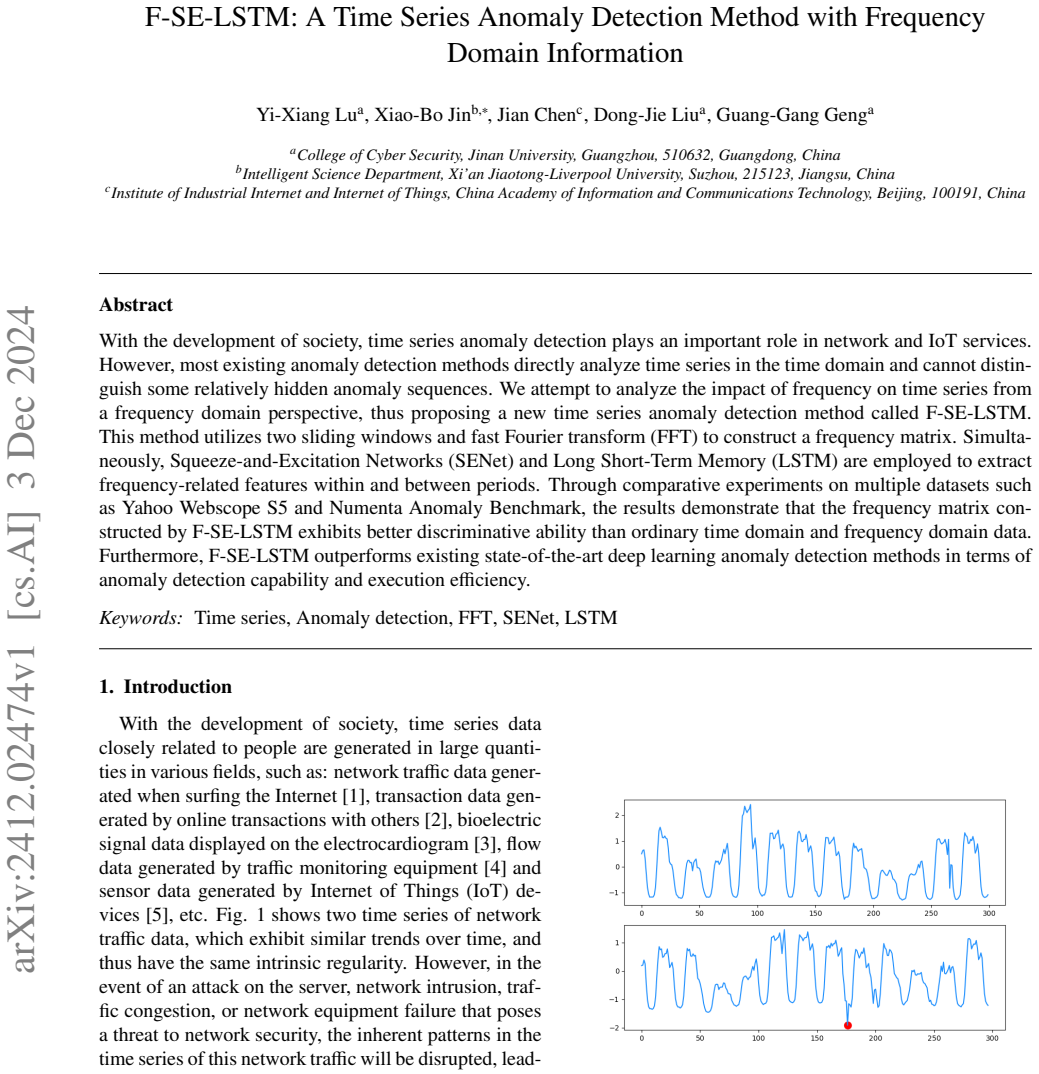
- The method's motivating scenario becomes operational: anomalies that look like normal traffic in the time domain but differ at particular frequencies should be detectable, which is the case the paper demonstrates on the four benchmark datasets.
Reading between the lines
- A testable extension of the paper's comparison would evaluate on temporally separated test windows or held-out complete series; the random split of overlapping windows is the one part of the protocol that a skeptical reader would want to see changed before trusting the margin.
- The two-window FFT encoding is a general input recipe: any sequence model that can ingest a matrix, including attention-based models, could be swapped in for SENet and LSTM, and the encoding's value can be tested independently of the classifier.
- The same encoding should transfer to multivariate time series by stacking per-channel frequency matrices, or to unsupervised reconstruction-based detection by training an autoencoder on the frequency matrix; neither case is explored in the paper.
- The choice $T=30$ is a tunable balance between frequency resolution and the number of periods, so on longer series with stronger periodicity the optimum could shift; that is a directly testable hyperparameter question.
Signed reviews
Editorial analysis
A structured set of objections, weighed in public.
Referee Report
Summary. The paper proposes F-SE-LSTM, a supervised time-series anomaly-detection method that converts raw series into sliding-window samples of length 60 and then into a frequency matrix using a second sliding window of length T followed by FFT. SENet and LSTM are used to extract frequency-related features within and between time periods, and a DNN outputs binary anomaly labels. Experiments on Yahoo Webscope A1 and Numenta Anomaly Benchmark (AWS, Known, Traffic) report higher F1, recall, precision, and accuracy than C-LSTM, C-LSTM-AE, CNN-1D, TCN, and FFT-1D-CNN, together with competitive training time and parameter count. The central claim is that the frequency-matrix representation plus the SENet-LSTM architecture outperforms existing deep learning anomaly-detection methods.
Significance. The architecture is internally coherent, the parameter tables are detailed, and the code is made available, which are concrete strengths. The frequency-matrix construction is a plausible design idea, and the small parameter count (35,654) is attractive if the empirical claims hold. However, the empirical evaluation has a load-bearing flaw: overlapping sliding-window samples are randomly split into train/validation/test sets, so training and test windows share almost all raw observations and labels. The reported F1 scores therefore do not measure out-of-sample detection capability, and the headline outperformance claim is not supported by the evidence as presented. Because the contribution is empirical rather than derivational, the validity of the evaluation is decisive; the paper does not provide a valid test of its main claim.
major comments (3)
- [Section 4.2 and Eq. (1)] The evaluation is not out-of-sample. In Eq. (1), M=L-N+1 and N=60, so consecutive rows of D overlap in 59 raw observations and every raw observation appears in up to 60 samples. Section 4.2 then states that random stratified sampling divides the dataset into 60/20/20 training/validation/test sets. Consequently, each test window has many training windows that differ by one or a few time steps and carry the same 'contains an outlier' label, so the classifier can memorize near-duplicate windows instead of detecting anomalies. The reported F1 values in Tables 6, 7, and 8 (e.g., 0.9799 on A1 and 0.9969 on Traffic) are therefore inflated, and the central claim that F-SE-LSTM outperforms state-of-the-art methods is not established. The same leaky split applies to the baselines, so the relative ordering in the tables is not by itself evidence against this problem.
- [Section 4.4.3 and Table 5] The sliding-window size T appears to be selected on the test set, which is a second form of evaluation leakage. The section compares T=10,20,30,40,50 and concludes that T=30 is best because it yields the highest F1 scores in Table 5. The paper never states that Table 5 is computed on a validation set; given that the F1 results reported around it are test-set results, the choice of T is fitted to the test data. If T was actually chosen on validation, the text must say so explicitly; otherwise the final model's test numbers incorporate test-set information beyond the epoch-selection procedure described in Section 4.4.
- [Section 4.4.5 and Table 7] The reported improvements over the strongest baselines are very small in several cases (e.g., F-SE-LSTM 0.9799 versus CNN-1D 0.9765 on A1), yet all results come from a single run with random state fixed to 1 and no confidence intervals or significance tests are reported. The small margins, combined with the leakage in Major Comment 1, do not support the claim of consistent outperformance of the state of the art.
minor comments (6)
- [Section 4.4.1] The text refers to 'logical regression' where 'logistic regression' is meant.
- [Table 1] The layer name 'A vgPood2d' is a typo for 'AvgPool2d', and the row 'Hadamard product the outputs of 1 and 2' is not a complete sentence.
- [Section 3.1 and Eq. (5)] The symbol T is used both for the sliding-window size in the frequency matrix and for the DFT length in Eq. (5), which is confusing; consider using separate symbols.
- [Figures 5, 6, and 7] The figures use curves and bars without numeric axis labels or value markers, so the reader cannot verify the claimed differences from the figures alone.
- [Conclusion] The sentence 'Comparative results with other methods that the frequency matrix constructed by our method exhibits superior discriminative ability' is grammatically incomplete and should be rewritten.
- [Throughout] There are numerous typographical errors such as 'di fferent', 'tra ffic', and 'e fficiency'; the manuscript should be proofread.
Circularity Check
The central empirical claim rests on a leaky train/test split and test-set-selected T; the reported F1 reduces to memorization and fit, though the architecture itself is not definitionally circular.
-
fitted input called prediction
[Sec. 3.1 Eq. (1) and Sec. 4.2]
"where M = L−N+1, and each sequence represents each sample. Each sample in the dataset that contains an outlier is considered an abnormal sample... Random stratified sampling is used to divide the dataset into training set, validation set and test set according to the ratio of 6 : 2 : 2"
With N=60 and M=L−N+1, consecutive samples overlap in 59 of 60 raw points, so every test window has near-duplicate windows in the training split. Since the label is defined as 'sample contains an outlier,' the test label is almost determined by the labels of overlapping training windows; the model can memorize these duplicates instead of detecting anomalies. The reported F1 on the test set is therefore not an out-of-sample prediction; it is a memorization score forced by the construction of the split.
-
fitted input called prediction
[Sec. 4.4.3 and Sec. 3.3]
"we set T to 10, 20, 30, 40, and 50 respectively, and conducted comparative experiments on DNN, CNN and LSTM. The experimental results are shown in the Table 5. When T is 30, the total number of the highest F1 scores is far more than the total number of other values of T... For the construction of the frequency matrix, we set the size of the sliding window T to 30"
The empirical F1 values in Table 5 are the same evaluation used for the final comparison (Tables 6–8), and no validation-based selection of T is reported. Choosing T by the test-set F1 and then reporting that same test-set F1 as the method's final performance means the headline 'prediction' is a fitted quantity, not an independent out-of-sample result.
full rationale
The derivation chain from FFT to frequency matrix to SENet/LSTM is self-contained and not definitionally circular: Eq. (7) constructs the frequency matrix from the input series, and Eqs. (8)–(15) define the feature extractors without presupposing the anomaly labels. There is no load-bearing self-citation, no imported uniqueness theorem, and no renaming of a known result. However, the paper's central empirical claim—that F-SE-LSTM outperforms state-of-the-art methods in anomaly detection capability—is supported by F1 scores obtained under a leaky random split of overlapping sliding-window samples and by a sliding-window size T chosen using the same test-set F1 values. In that sense, the reported 'predictions' reduce, by construction, to memorized training windows and to a fitted hyperparameter. This is partial circularity of the evidence rather than equation-level circularity, so the score is 6 rather than higher.
Assumptions & free parameters
free parameters (2)
- T =
30
- N =
60
assumptions (4)
- standard math Fourier series and DFT properties, including Dirichlet conditions and amplitude symmetry, hold for the sampled windows.
- domain assumption The amplitude spectrum with phase discarded is sufficient to distinguish anomalies.
- domain assumption A sample is abnormal if and only if it contains at least one anomalous point.
- domain assumption Randomly splitting overlapping sliding-window samples into train/validation/test preserves independence.
Cite this review
Pith. "Pith review of F-SE-LSTM: A Time Series Anomaly Detection Method with Frequency Domain Information." pith.science (2026). https://pith.science/paper/YQYVBSGM
@misc{pith2026241202474,
  author       = {Pith},
  title        = {Pith review of: F-SE-LSTM: A Time Series Anomaly Detection Method with Frequency Domain Information},
  year         = {2026},
  howpublished = {\url{https://pith.science/paper/YQYVBSGM}},
  note         = {Machine review of arXiv:2412.02474}
}
read the original abstract
With the development of society, time series anomaly detection plays an important role in network and IoT services. However, most existing anomaly detection methods directly analyze time series in the time domain and cannot distinguish some relatively hidden anomaly sequences. We attempt to analyze the impact of frequency on time series from a frequency domain perspective, thus proposing a new time series anomaly detection method called F-SE-LSTM. This method utilizes two sliding windows and fast Fourier transform (FFT) to construct a frequency matrix. Simultaneously, Squeeze-and-Excitation Networks (SENet) and Long Short-Term Memory (LSTM) are employed to extract frequency-related features within and between periods. Through comparative experiments on multiple datasets such as Yahoo Webscope S5 and Numenta Anomaly Benchmark, the results demonstrate that the frequency matrix constructed by F-SE-LSTM exhibits better discriminative ability than ordinary time domain and frequency domain data. Furthermore, F-SE-LSTM outperforms existing state-of-the-art deep learning anomaly detection methods in terms of anomaly detection capability and execution efficiency.
Figures


Figures from the paper (4 more)



Reference graph
Works this paper leans on
- [1]
-
[2]
L. Seyedhossein, M. R. Hashemi, Mining information from credit card time series for timelier fraud detection, in: 2010 5th International Symposium on Telecommunications, IEEE, 2010, pp. 619–624
work page 2010
-
[3]
H. Sivaraks, C. A. Ratanamahatana, Robust and accurate anomaly detection in ecg artifacts using time series motif dis- covery, Computational and mathematical methods in medicine 2015 (2015)
work page 2015
- [4]
-
[5]
A. A. Cook, G. Mısırlı, Z. Fan, Anomaly detection for iot time- series data: A survey, IEEE Internet of Things Journal 7 (7) (2019) 6481–6494
work page 2019
-
[6]
A. J. Fox, Outliers in time series, Journal of the Royal Statistical Society: Series B (Methodological) 34 (3) (1972) 350–363
work page 1972
-
[7]
S. Kay, Robust detection by autoregressive spectrum analysis, IEEE Transactions on Acoustics, Speech, and Signal Processing 30 (2) (1982) 256–269
work page 1982
- [8]
Show all 41 references
-
[9]
M. Akay, W. Welkowitz, J. Semmlow, J. Kostis, Application of the arma method to acoustic detection of coronary artery dis- ease, Medical and Biological Engineering and Computing 29 (4) (1991) 365–372
1991
-
[10]
B. K. Nelson, Time series analysis using autoregressive inte- grated moving average (arima) models, Academic emergency medicine 5 (7) (1998) 739–744
1998
-
[11]
Rebbapragada, P
U. Rebbapragada, P. Protopapas, C. E. Brodley, C. Alcock, Finding anomalous periodic time series, Machine learning 74 (3) (2009) 281–313
2009
-
[12]
Oehmcke, O
S. Oehmcke, O. Zielinski, O. Kramer, Event detection in marine time series data, in: Joint German /Austrian Conference on Ar- tificial Intelligence (K¨unstliche Intelligenz), Springer, 2015, pp. 279–286
2015
-
[13]
Sch ¨olkopf, R
B. Sch ¨olkopf, R. C. Williamson, A. Smola, J. Shawe-Taylor, J. Platt, Support vector method for novelty detection, Advances in neural information processing systems 12 (1999)
1999
-
[14]
Munir, S
M. Munir, S. A. Siddiqui, A. Dengel, S. Ahmed, Deepant: A deep learning approach for unsupervised anomaly detection in time series, Ieee Access 7 (2018) 1991–2005
2018
-
[15]
Y . Su, Y . Zhao, C. Niu, R. Liu, W. Sun, D. Pei, Robust anomaly detection for multivariate time series through stochastic recur- rent neural network, in: Proceedings of the 25th ACM SIGKDD international conference on knowledge discovery & data min- ing, 2019, pp. 2828–2837
2019
-
[16]
Rahimi, A
M. Rahimi, A. Alghassi, M. Ahsan, J. Haider, Deep learning model for industrial leakage detection using acoustic emission signal, in: Informatics, V ol. 7, MDPI, 2020, p. 49
2020
-
[17]
M. H. Soleimani-Babakamali, R. Soleimani-Babakamali, R. Sarlo, M. F. Farghally, I. Lourentzou, On the e ffectiveness of dimensionality reduction for unsupervised structural health monitoring anomaly detection, Mechanical Systems and Signal Processing 187 (2023) 109910
2023
-
[18]
W. T. Cochran, J. W. Cooley, D. L. Favin, H. D. Helms, R. A. Kaenel, W. W. Lang, G. C. Maling, D. E. Nelson, C. M. Rader, P. D. Welch, What is the fast fourier transform?, Proceedings of the IEEE 55 (10) (1967) 1664–1674
1967
-
[19]
J. Hu, L. Shen, G. Sun, Squeeze-and-excitation networks, in: Proceedings of the IEEE conference on computer vision and pat- tern recognition, 2018, pp. 7132–7141
2018
-
[20]
Hochreiter, J
S. Hochreiter, J. Schmidhuber, Long short-term memory, Neural computation 9 (8) (1997) 1735–1780
1997
-
[21]
S. D. D. Anton, S. Sinha, H. D. Schotten, Anomaly-based intru- sion detection in industrial data with svm and random forests, in: 2019 International conference on software, telecommunications and computer networks (SoftCOM), IEEE, 2019, pp. 1–6
2019
-
[22]
Y . Zhou, H. Ren, Z. Li, N. Wu, A. M. Al-Ahmari, Anomaly detection via a combination model in time series data, Applied Intelligence 51 (7) (2021) 4874–4887
2021
-
[23]
Y . He, D. Pi, Anomaly detection algorithm for helicopter rotor based on stft and svdd, in: International Conference on Cloud Computing and Security, Springer, 2016, pp. 383–393
2016
-
[24]
Hwang, M.-C
R.-H. Hwang, M.-C. Peng, C.-W. Huang, P.-C. Lin, V .-L. Nguyen, An unsupervised deep learning model for early net- work traffic anomaly detection, IEEE Access 8 (2020) 30387– 30399
2020
-
[25]
T. Wen, R. Keyes, Time series anomaly detection using con- volutional neural networks and transfer learning, arXiv preprint arXiv:1905.13628 (2019)
2019 arXiv
-
[26]
Ullah, Q
I. Ullah, Q. H. Mahmoud, Design and development of a deep learning-based model for anomaly detection in iot networks, IEEE Access 9 (2021) 103906–103926
2021
-
[27]
Neupane, I
S. Neupane, I. A. Fernandez, W. Patterson, S. Mittal, S. Rahimi, A temporal anomaly detection system for vehicles utilizing functional working groups and sensor channels, arXiv preprint arXiv:2209.06828 (2022)
2022 arXiv
-
[28]
E. C. Djamal, W. I. Furi, F. Nugraha, Detection of eeg signal post-stroke using fft and convolutional neural network, in: 2019 6th International Conference on Electrical Engineering, Com- puter Science and Informatics (EECSI), IEEE, 2019, pp. 18–23
2019
-
[29]
Zhang, Q
R. Zhang, Q. Zou, Time series prediction and anomaly detection of light curve using lstm neural network, in: Journal of Physics: Conference Series, V ol. 1061, IOP Publishing, 2018, p. 012012
2018
-
[30]
Malhotra, L
P. Malhotra, L. Vig, G. Shro ff, P. Agarwal, et al., Long short term memory networks for anomaly detection in time series, in: Proceedings, V ol. 89, 2015, pp. 89–94
2015
-
[31]
Malhotra, A
P. Malhotra, A. Ramakrishnan, G. Anand, L. Vig, P. Agar- wal, G. Shro ff, Lstm-based encoder-decoder for multi-sensor anomaly detection, arXiv preprint arXiv:1607.00148 (2016)
2016 arXiv
-
[32]
Y . Wang, X. Du, Z. Lu, Q. Duan, J. Wu, Improved lstm-based time-series anomaly detection in rail transit operation environ- ments, IEEE Transactions on Industrial Informatics 18 (12) (2022) 9027–9036
2022
-
[33]
T. Kieu, B. Yang, C. Guo, C. S. Jensen, Outlier detection for time series with recurrent autoencoder ensembles., in: IJCAI, 2019, pp. 2725–2732
2019
-
[34]
Cheng, Q
M. Cheng, Q. Xu, L. Jianming, W. Liu, Q. Li, J. Wang, Ms- lstm: A multi-scale lstm model for bgp anomaly detection, in: 2016 IEEE 24th International Conference on Network Protocols (ICNP), IEEE, 2016, pp. 1–6
2016
-
[35]
H. Park, E. Kwon, S. Byon, W.-J. Shin, E.-S. Jung, Y .-T. Lee, Punch analysis with fft and lstm of accelerometer and gyro- scope data, in: 2020 International Conference on Information and Communication Technology Convergence (ICTC), IEEE, 2020, pp. 1353–1355
2020
-
[36]
Kim, S.-B
T.-Y . Kim, S.-B. Cho, Web tra ffic anomaly detection using c- lstm neural networks, Expert Systems with Applications 106 (2018) 66–76
2018
-
[37]
C. Zhou, C. Sun, Z. Liu, F. Lau, A c-lstm neural network for text classification, arXiv preprint arXiv:1511.08630 (2015). 13
2015 arXiv
-
[38]
C. Yin, S. Zhang, J. Wang, N. N. Xiong, Anomaly detection based on convolutional recurrent autoencoder for iot time series, IEEE Transactions on Systems, Man, and Cybernetics: Systems 52 (1) (2020) 112–122
2020
-
[39]
Zaremba, I
W. Zaremba, I. Sutskever, O. Vinyals, Recurrent neural network regularization, arXiv preprint arXiv:1409.2329 (2014)
2014 arXiv
-
[40]
Laptev, S
N. Laptev, S. Amizadeh, A labeled anomaly detection dataset s5 yahoo research, v1,https://webscope.sandbox.yahoo. com/catalog.php?datatype=s&did=70 (2015)
2015
-
[41]
Numenta, Nab: Numenta anomaly benchmark, https:// github.com/numenta/NAB (2015). 14
2015
Reviewed August 11, 2026 · model on record in the stance chip above.
Discussion (0). Continue with ORCID to comment.