Portfolio Optimization for Commodity ETFs under Heavy-Tailed Returns
Pith reviewed 2026-06-26 02:05 UTC · model grok-4.3
The pith
Minimum-risk and CVaR optimization of commodity ETF portfolios delivers more stable performance than tangent portfolios under heavy-tailed returns.
A machine-rendered reading of the paper's core claim, the machinery that carries it, and where it could break.
Core claim
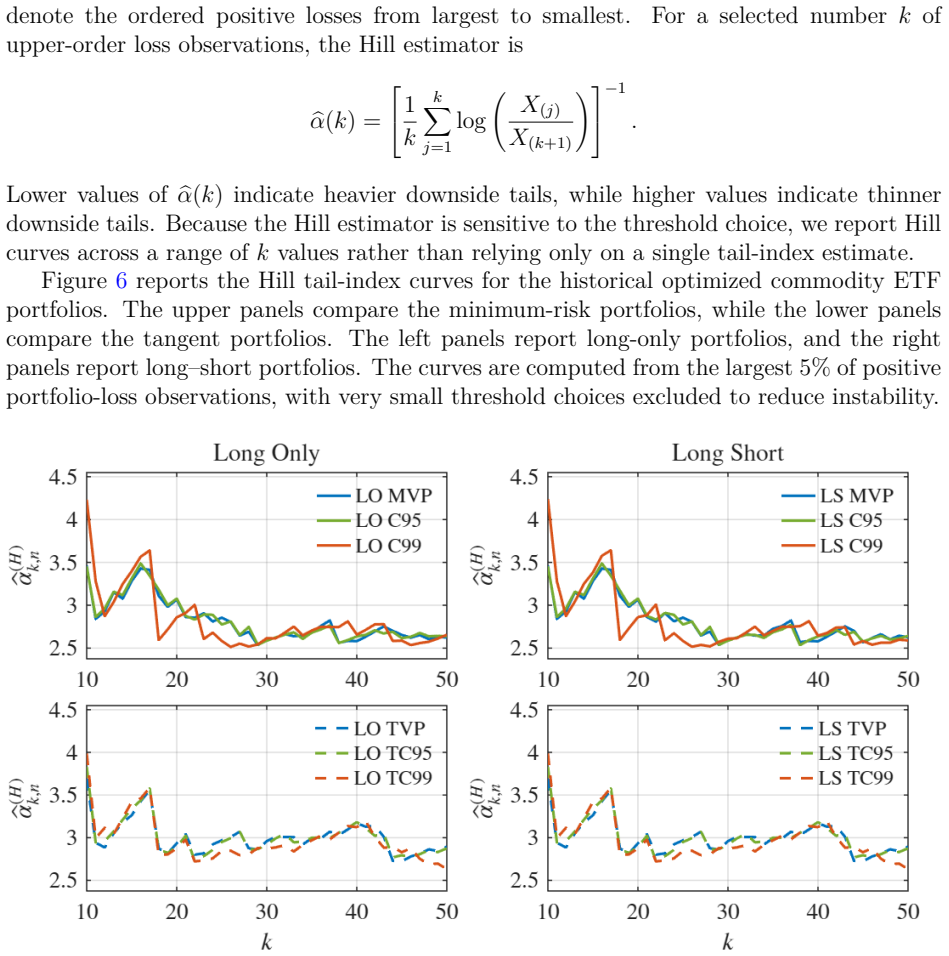
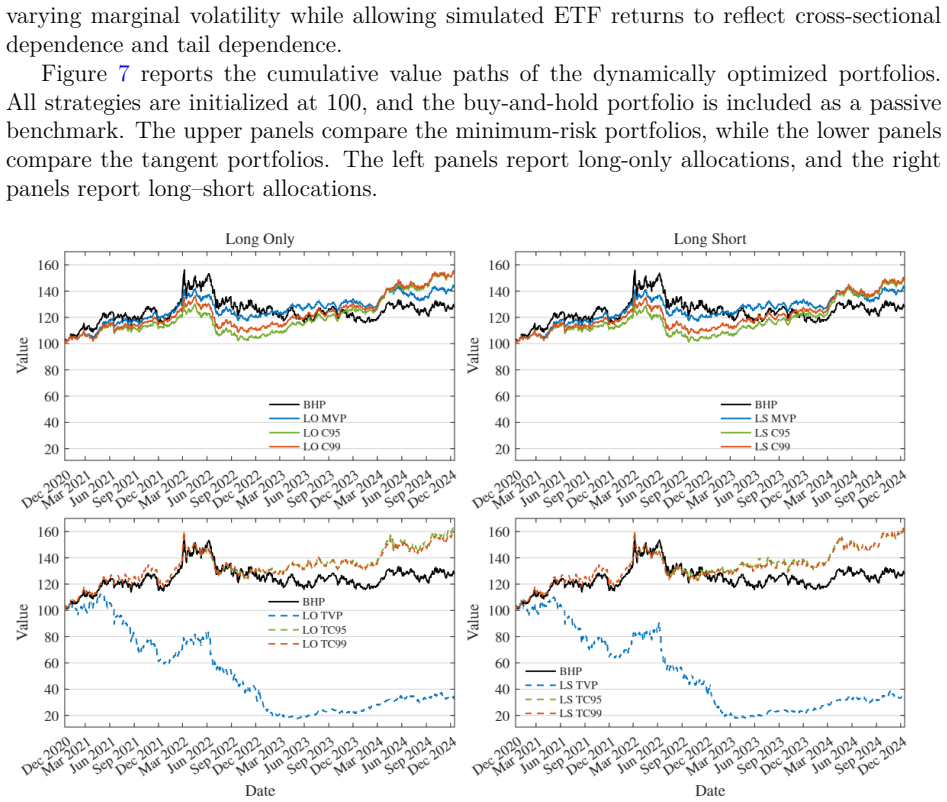
Historical optimization indicated that minimum-risk and CVaR-based portfolios provided more stable cumulative performance than tangent portfolios and generally improved Sharpe, Calmar, and STARR0.95 ratios. Dynamic extension based on ARMA-GARCH marginal models, Student-t copula dependence, and one-step-ahead predictive scenarios improved performance mainly when combined with minimum-risk or CVaR-based objectives. Extreme-value diagnostics showed that optimized portfolios remained exposed to heavy downside tails, so improved risk-adjusted performance did not eliminate extreme-loss risk.
What carries the argument
Rolling-window mean-variance and conditional value-at-risk (CVaR) optimization, extended dynamically with ARMA-GARCH models and Student-t copula for scenario generation.
If this is right
- Commodity ETF allocation benefits most from conservative and downside-risk-aware optimization.
- Dynamic optimization improves performance mainly when paired with minimum-risk or CVaR objectives.
- Low-turnover dynamic CVaR portfolios remain more resilient to transaction costs.
- Optimized portfolios continue to require explicit tail-risk diagnostics despite better risk-adjusted metrics.
- Sector heterogeneity means energy and broad index funds exhibit the highest volatility and tail exposure.
Where Pith is reading between the lines
- The results suggest mean-variance tangent portfolios are especially unreliable when expected returns are hard to estimate amid heavy tails.
- The same CVaR advantage might appear in equity or currency portfolios with comparable return distributions.
- Adding regime detection to the ARMA-GARCH-copula step could reduce sensitivity to the 2018-2024 sample period.
- Portfolio construction could incorporate explicit tail-hedging instruments to address the remaining extreme-loss exposure.
Load-bearing premise
The chosen rolling-window length, ARMA-GARCH specifications, and Student-t copula adequately represent the joint heavy-tailed dynamics of the 30 ETFs over the 2018-2024 sample without substantial overfitting or regime shifts.
What would settle it
Out-of-sample testing after 2024 where minimum-risk and CVaR portfolios fail to show improved stability or ratios compared to tangent portfolios during a new market stress period.
Figures


read the original abstract
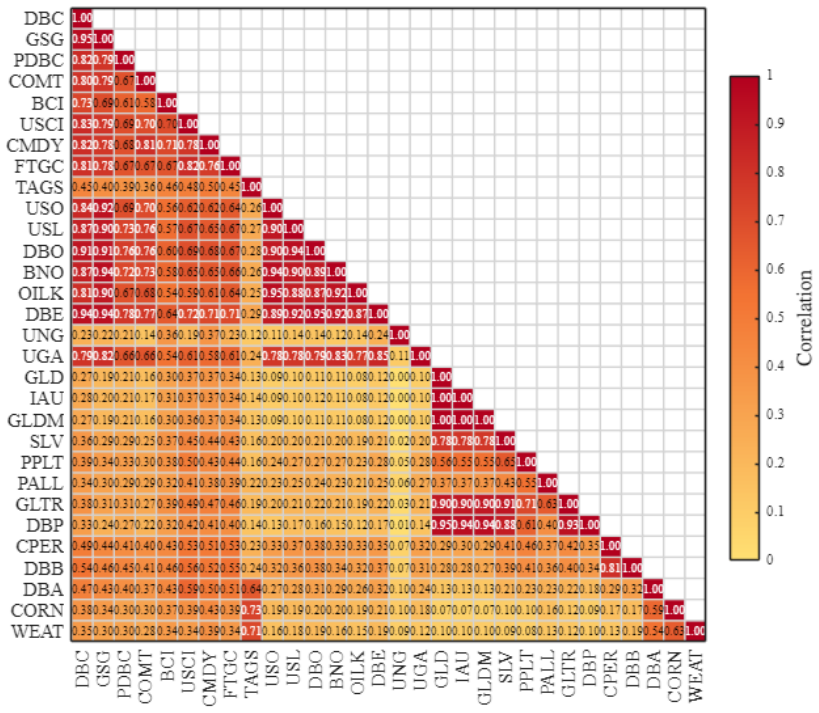
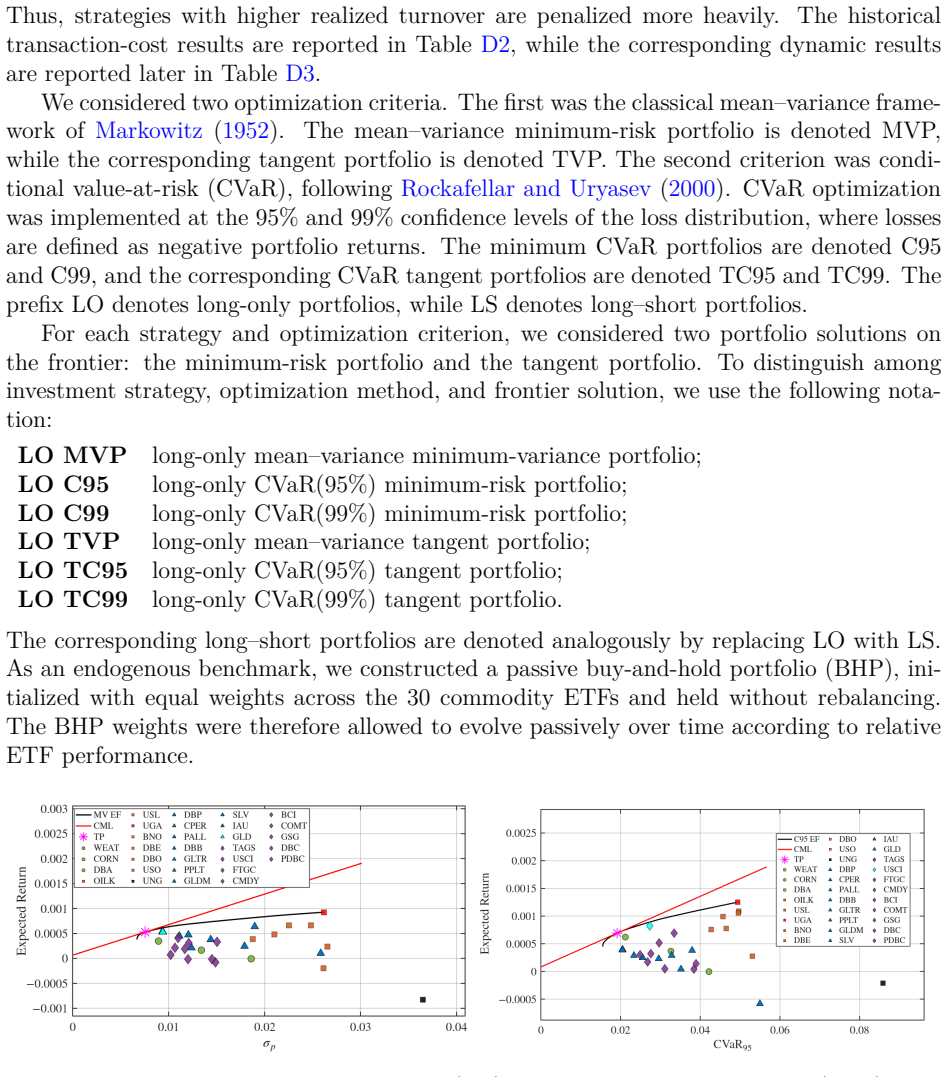
This paper examines portfolio optimization for commodity exchange-traded funds (ETFs) under heavy-tailed return behavior. Using daily Bloomberg data for 30 U.S.-listed commodity ETFs from 12 December 2018 to 16 December 2024, we study funds spanning agriculture, energy, metals, and broad commodity index exposure. We compare a passive buy-and-hold portfolio with rolling-window optimized portfolios formed under mean--variance and conditional value-at-risk (CVaR) criteria, considering both long-only and restricted long--short strategies. The results showed substantial heterogeneity across commodity sectors, with energy and broad commodity index funds displaying pronounced volatility, skewness, and excess kurtosis. Historical optimization indicated that minimum-risk and CVaR-based portfolios provided more stable cumulative performance than tangent portfolios and generally improved Sharpe, Calmar, and STARR$_{0.95}$ ratios. Extreme-value diagnostics showed that optimized portfolios remained exposed to heavy downside tails, so improved risk-adjusted performance did not eliminate extreme-loss risk. A dynamic extension based on ARMA--GARCH marginal models, Student--$t$ copula dependence, and one-step-ahead predictive scenarios improved performance mainly when combined with minimum-risk or CVaR-based objectives. Dynamic mean--variance tangent portfolios performed less reliably, reflecting sensitivity to expected-return estimation error. Transaction-cost robustness checks further showed that the practical value of dynamic optimization depended on turnover control, with low-turnover dynamic CVaR tangent portfolios remaining more resilient to implementation costs. Overall, the analysis showed that commodity ETF allocation benefited most from conservative and downside-risk-aware optimization, while optimized portfolios continued to require explicit tail-risk and implementation diagnostics.
Editorial analysis
A structured set of objections, weighed in public.
Referee Report
Summary. The manuscript examines portfolio optimization for 30 commodity ETFs (agriculture, energy, metals, broad indices) over 12 Dec 2018–16 Dec 2024 under heavy-tailed returns. It compares a passive buy-and-hold benchmark against rolling-window mean-variance (tangent and minimum-risk) and CVaR portfolios in both long-only and restricted long-short settings, then extends the analysis to dynamic one-step-ahead optimization via ARMA-GARCH marginals and Student-t copula scenarios. The central claims are that minimum-risk and CVaR portfolios deliver more stable cumulative returns and higher Sharpe, Calmar, and STARR_{0.95} ratios than tangent portfolios; dynamic optimization improves results primarily for conservative objectives; all optimized portfolios retain heavy downside-tail exposure; and low-turnover dynamic CVaR strategies remain resilient to transaction costs.
Significance. If the performance ranking and robustness findings hold under proper validation, the work supplies concrete, sector-heterogeneous evidence that downside-risk-aware criteria outperform mean-variance tangent optimization for commodity ETFs, while underscoring the need for explicit tail and turnover diagnostics. The combination of historical rolling optimization, copula-based scenario generation, and transaction-cost checks addresses a practically relevant gap in non-Gaussian portfolio management.
major comments (3)
- [Results (historical optimization)] Results section (historical optimization): reported improvements in Sharpe, Calmar, and STARR_{0.95} ratios for minimum-risk and CVaR portfolios versus tangent portfolios are presented without standard errors, bootstrap confidence intervals, or formal statistical tests of ratio differences; this absence prevents assessment of whether the observed gaps exceed sampling variability.
- [Dynamic optimization] Dynamic optimization section: the claim that ARMA-GARCH + Student-t copula scenarios improve performance mainly for minimum-risk/CVaR objectives rests on a single fixed specification; no cross-validation, alternative marginals/copulas, or sub-period tests are reported despite the 2018-2024 sample containing documented regime shifts (COVID, 2022 energy shock), so the ranking may be sensitive to the chosen rolling-window length and model form.
- [Methodology and evaluation] Methodology and evaluation: all performance metrics are generated from rolling windows within the single 2018-2024 sample; the absence of a true hold-out period or walk-forward validation outside the estimation window weakens the stability and predictive claims for the CVaR-based strategies.
minor comments (2)
- [Methods] The precise definition and estimation procedure for STARR_{0.95} should be stated explicitly in the methods section rather than referenced only in the abstract.
- [Figures and tables] Figure captions and table notes should indicate whether the reported ratios are in-sample or use one-step-ahead forecasts, and whether turnover is constrained in the dynamic cases.
Simulated Author's Rebuttal
We thank the referee for the constructive comments, which highlight important aspects of statistical rigor, robustness to model specification, and validation procedures. We address each point below and commit to revisions that strengthen the manuscript without altering its core empirical findings.
read point-by-point responses
-
Referee: [Results (historical optimization)] Results section (historical optimization): reported improvements in Sharpe, Calmar, and STARR_{0.95} ratios for minimum-risk and CVaR portfolios versus tangent portfolios are presented without standard errors, bootstrap confidence intervals, or formal statistical tests of ratio differences; this absence prevents assessment of whether the observed gaps exceed sampling variability.
Authors: We agree that formal statistical assessment of the ratio differences is needed to evaluate whether improvements exceed sampling variability. In the revised manuscript we will add block-bootstrap confidence intervals (accounting for serial dependence in returns) for all Sharpe, Calmar, and STARR_{0.95} ratios together with pairwise tests of ratio equality following Ledoit-Wolf and related methods. These additions will be reported in the results tables and discussed in the text. revision: yes
-
Referee: [Dynamic optimization] Dynamic optimization section: the claim that ARMA-GARCH + Student-t copula scenarios improve performance mainly for minimum-risk/CVaR objectives rests on a single fixed specification; no cross-validation, alternative marginals/copulas, or sub-period tests are reported despite the 2018-2024 sample containing documented regime shifts (COVID, 2022 energy shock), so the ranking may be sensitive to the chosen rolling-window length and model form.
Authors: The Student-t copula with ARMA-GARCH marginals was chosen for its documented ability to capture the heavy tails and tail dependence typical of commodity returns. We acknowledge that a single specification leaves open questions of sensitivity. In revision we will add (i) results under a Gaussian copula alternative and (ii) sub-period performance tables that split the sample around the 2020 COVID and 2022 energy-shock regimes. These checks will be presented alongside the baseline results to document the stability of the reported ranking. revision: partial
-
Referee: [Methodology and evaluation] Methodology and evaluation: all performance metrics are generated from rolling windows within the single 2018-2024 sample; the absence of a true hold-out period or walk-forward validation outside the estimation window weakens the stability and predictive claims for the CVaR-based strategies.
Authors: The rolling-window implementation is already a walk-forward out-of-sample procedure: each portfolio is formed using only data up to time t and evaluated on the subsequent period, with no look-ahead bias. This is the standard approach in the dynamic portfolio literature. Nevertheless, to address the concern directly we will add a stricter split-sample exercise that reserves the final 12-18 months as a true hold-out period for the dynamic strategies and report the corresponding performance metrics. revision: partial
Circularity Check
No circularity detected; performance comparisons are independent evaluations of distinct objectives
full rationale
The paper applies mean-variance and CVaR optimization criteria to the same historical ETF returns, then computes Sharpe/Calmar/STARR ratios on the resulting portfolio returns. This is standard backtesting of alternative objective functions and does not match any enumerated circularity pattern: no self-definitional reduction, no fitted parameter renamed as prediction, no load-bearing self-citation chain, and no ansatz or uniqueness imported from prior author work. The ARMA-GARCH + Student-t copula dynamic extension generates scenarios from fitted marginals and dependence structure but evaluates the same distinct objectives on those scenarios without the central ranking reducing to its inputs by construction. The reader's noted overlap of data for optimization and evaluation is acknowledged but does not constitute circularity under the strict rules requiring explicit quoteable reduction.
Axiom & Free-Parameter Ledger
free parameters (3)
- CVaR confidence level
- Rolling-window length
- GARCH and copula parameters
axioms (2)
- domain assumption Returns follow the specified ARMA-GARCH marginals and Student-t copula out of sample
- domain assumption Transaction costs can be approximated by a linear function of turnover
Reference graph
Works this paper leans on
-
[1]
The American Economic Review , year =
Working, Holbrook , title =. The American Economic Review , year =
-
[2]
and French, Kenneth R
Fama, Eugene F. and French, Kenneth R. , title =. The Journal of Business , year =
-
[3]
, title =
Bodie, Zvi and Rosansky, Victor I. , title =. Financial Analysts Journal , year =
-
[4]
The Journal of Finance , year =
Markowitz, Harry , title =. The Journal of Finance , year =
-
[5]
, title =
Sharpe, William F. , title =. The Journal of Business , year =
-
[6]
Geert , title =
Gorton, Gary and Rouwenhorst, K. Geert , title =. Financial Analysts Journal , year =
-
[7]
and Harvey, Campbell R
Erb, Claude B. and Harvey, Campbell R. , title =. Financial Analysts Journal , year =
-
[8]
The Review of Financial Studies , year =
Bessembinder, Hendrik , title =. The Review of Financial Studies , year =
-
[9]
Financial Analysts Journal , year =
Tang, Ke and Xiong, Wei , title =. Financial Analysts Journal , year =
-
[10]
Annual Review of Financial Economics , year =
Cheng, Ing-Haw and Xiong, Wei , title =. Annual Review of Financial Economics , year =
-
[11]
, title =
Singleton, Kenneth J. , title =. Management Science , year =
-
[12]
The Journal of Finance , year =
Basak, Suleyman and Pavlova, Anna , title =. The Journal of Finance , year =
-
[13]
Tactical Allocation in Commodity Futures Markets: Combining Momentum and Term Structure Signals , journal =
Fuertes, Ana-Maria and Miffre, Jo. Tactical Allocation in Commodity Futures Markets: Combining Momentum and Term Structure Signals , journal =. 2010 , volume =
2010
-
[14]
Quantitative Finance , year =
Cont, Rama , title =. Quantitative Finance , year =
-
[15]
Mathematical Finance , year =
Artzner, Philippe and Delbaen, Freddy and Eber, Jean-Marc and Heath, David , title =. Mathematical Finance , year =
-
[16]
Tyrrell and Uryasev, Stanislav , title =
Rockafellar, R. Tyrrell and Uryasev, Stanislav , title =. Journal of Risk , year =
-
[17]
Modelling Extremal Events for Insurance and Finance , publisher =
Embrechts, Paul and Kl. Modelling Extremal Events for Insurance and Finance , publisher =. 1997 , doi =
1997
-
[18]
Journal of Banking & Finance , year =
Daskalaki, Charoula and Skiadopoulos, George , title =. Journal of Banking & Finance , year =
-
[19]
Speculators, Commodities and Cross-Market Linkages , journal =
B. Speculators, Commodities and Cross-Market Linkages , journal =. 2014 , volume =
2014
-
[20]
Publications de l'Institut de Statistique de l'Universit
Sklar, Abe , title =. Publications de l'Institut de Statistique de l'Universit. 1959 , volume =
1959
-
[21]
Joe, Harry , title =
-
[22]
and Frey, R
McNeil, Alexander J. and Frey, R. Quantitative Risk Management: Concepts, Techniques and Tools , publisher =. 2015 , edition =
2015
-
[23]
, title =
Engle, Robert F. , title =. Econometrica , year =
-
[24]
Journal of Econometrics , year =
Bollerslev, Tim , title =. Journal of Econometrics , year =
-
[25]
, title =
Demarta, Stefano and McNeil, Alexander J. , title =. International Statistical Review , year =
-
[26]
Journal of Business & Economic Statistics , year =
Engle, Robert , title =. Journal of Business & Economic Statistics , year =
-
[27]
, title =
Michaud, Richard O. , title =. Financial Analysts Journal , year =
-
[28]
The Review of Financial Studies , year =
DeMiguel, Victor and Garlappi, Lorenzo and Uppal, Raman , title =. The Review of Financial Studies , year =
-
[29]
, title =
Tsay, Ruey S. , title =. 2005 , edition =
2005
-
[30]
and Fabozzi, Frank J
Jaffri, Ali and Shirvani, Abootaleb and Jha, Ayush and Rachev, Svetlozar T. and Fabozzi, Frank J. , title =. Journal of Risk and Financial Management , year =
-
[31]
Brent and Rachev, Svetlozar T
Lindquist, W. Brent and Rachev, Svetlozar T. and Hu, Yuan and Shirvani, Abootaleb , title =. 2022 , doi =
2022
-
[32]
, title =
Hill, Bruce M. , title =. The Annals of Statistics , year =
-
[33]
, title =
Sharpe, William F. , title =. The Journal of Portfolio Management , year =
-
[34]
, title =
Young, Terry W. , title =. Futures , year =
-
[35]
Journal of Investment Strategies , year =
Cheridito, Patrick and Kromer, Eduard , title =. Journal of Investment Strategies , year =
-
[36]
and Ortobelli, Sergio and Stoyanov, Stoyan and Fabozzi, Frank J
Rachev, Svetlozar T. and Ortobelli, Sergio and Stoyanov, Stoyan and Fabozzi, Frank J. and Biglova, Almira , title =. International Journal of Theoretical and Applied Finance , year =
-
[37]
Keynes, John Maynard , title =
-
[38]
The Review of Economic Studies , volume =
Kaldor, Nicholas , title =. The Review of Economic Studies , volume =. 1939 , doi =
1939
-
[39]
, title =
Brennan, Michael J. , title =. The American Economic Review , volume =
-
[40]
, title =
Telser, Lester G. , title =. Journal of Political Economy , volume =. 1958 , doi =
1958
-
[41]
, title =
Greer, Robert J. , title =. The Journal of Alternative Investments , volume =. 2000 , doi =
2000
-
[42]
Journal of International Financial Markets, Institutions and Money , volume =
Silvennoinen, Annastiina and Thorp, Susan , title =. Journal of International Financial Markets, Institutions and Money , volume =. 2013 , doi =
2013
-
[43]
and Ziemba, William T
Chopra, Vijay K. and Ziemba, William T. , title =. The Journal of Portfolio Management , volume =. 1993 , doi =
1993
-
[44]
The Journal of Finance , volume =
Jagannathan, Ravi and Ma, Tongshu , title =. The Journal of Finance , volume =. 2003 , doi =
2003
-
[45]
The Journal of Portfolio Management , volume =
Ledoit, Olivier and Wolf, Michael , title =. The Journal of Portfolio Management , volume =. 2004 , doi =
2004
-
[46]
and Frey, R
McNeil, Alexander J. and Frey, R. Estimation of Tail-Related Risk Measures for Heteroscedastic Financial Time Series: An Extreme Value Approach , journal =. 2000 , doi =
2000
-
[47]
Magill, Michael J. P. and Constantinides, George M. , title =. Journal of Economic Theory , year =
-
[48]
, title =
Constantinides, George M. , title =. Journal of Political Economy , year =
discussion (0)
Sign in with ORCID, Apple, or X to comment. Anyone can read and Pith papers without signing in.