REVIEW 4 major objections 7 minor 1 cited by
Dwarf Galaxies with Radio-excess AGNs in the VLA Sky Survey
T0 review · 4 major / 7 minor · reviewed 2026-08-12 · deepseek-v4-flash
Pith's one-line read Ten nearby dwarf galaxies host radio-excess AGNs picked out by a 2-sigma infrared-radio cutoff, and most are physically associated with their hosts.
desk verdict A careful, useful VLASS-based dwarf-galaxy AGN catalog whose main weakness is an unquantified transfer of the IR-radio cutoff to W4-faint, possibly extended dwarfs. read the letter →
The pith
A machine-rendered reading of the paper's core claim, the machinery that carries it, and where it could break.
The reading
What carries the argument
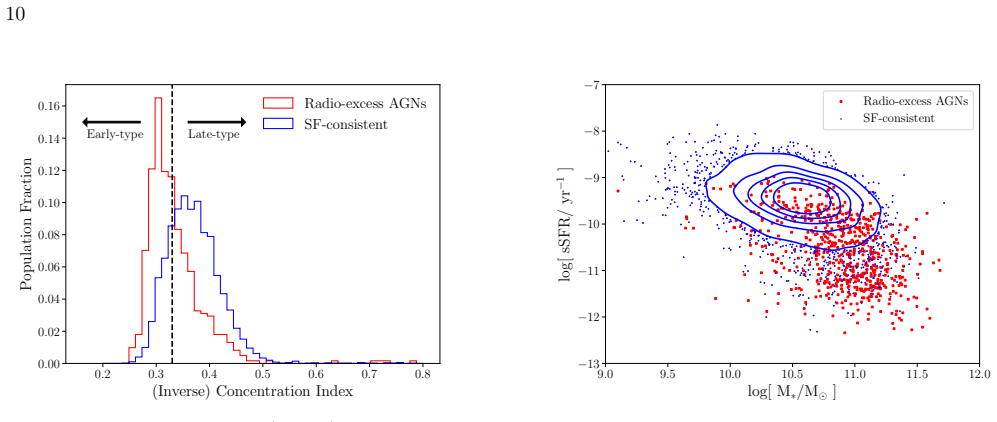
The load-bearing object is the infrared-radio correlation parameter $q$, defined by $q = \log(L_{\rm IR}/(3.75\times 10^{12}\,L_{1.4\,{\rm GHz}}))$, which captures the tight relation between radio and far-infrared emission in star-forming galaxies. The authors measure $q$ for a sample of about 7,000 galaxies drawn from the NASA-Sloan Atlas with VLASS 3 GHz detections, WISE W4 detections with $S/N \ge 5$, and point-like WISE profiles, excluding mid-IR-selected AGNs. The distribution peaks at $q_{\rm peak}=2.62$ with scatter $\sigma = 0.34$, giving the $2\sigma$ threshold $q<1.94$. This threshold is what separates star-formation-powered radio emission from radio-excess AGNs; applying it to dwarf galaxies, with a 2.5 arcsecond matching radius and visual and spectroscopic interloper removal, produces the ten candidates. The Chomiuk and Wilcots relation is used to rule out individual or collective supernova remnants as the radio source.
What would settle it
Measure the full $q$ distribution for a volume-limited sample of dwarf galaxies with no AGN signatures, using deep radio and infrared data; if more than about two percent of such dwarfs have $q<1.94$, the ten radio-excess AGN candidates could be ordinary low-$q$ star-forming galaxies rather than accreting black holes.
Extended reading notes
Core claim
The central claim is that ten dwarf galaxies, each with stellar mass below about three billion solar masses and redshift at most 0.15, contain radio sources whose 3 GHz luminosity is too high relative to their total infrared luminosity to be explained by star formation. The excess is measured by $q = \log(L_{\rm IR}/(3.75\times 10^{12}\,L_{1.4\,{\rm GHz}}))$; sources with $q < 1.94$, two standard deviations below the peak of the calibration distribution, are classified as radio-excess AGNs. Statistical matching arguments predict fewer than one background interloper among the ten, and optical emission-line diagnostics place some of the hosts in AGN or composite regions, supporting physical association. The paper therefore presents these ten as strong intermediate-mass black hole candidates, five newly recognized as AGNs, and separately reports eight variable radio sources in dwarf galaxies found by comparing VLASS epochs to FIRST.
Load-bearing premise
The ten candidates are selected with a $q<1.94$ cutoff calibrated on higher-mass galaxies with strong WISE detections, while several dwarf hosts have only upper limits on their infrared luminosity, so the selection assumes dwarf star-forming galaxies scatter around the infrared-radio relation no more than the calibration sample does.
Editorial extensions
If this is right
- The ten dwarf galaxies become high-priority targets for X-ray, very long baseline interferometry, and optical follow-up; confirming any of them would add intermediate-mass black hole candidates near $10^5$-$10^6\,M_\odot$.
- Five of the ten are identified as AGNs for the first time, showing that radio-excess selection catches dwarf AGNs that optical emission-line and mid-infrared color diagnostics miss.
- The published catalogs of radio-excess AGNs and star-forming galaxies give the community a directly usable sample for measuring how the AGN fraction changes with galaxy mass and redshift.
- Eight variable radio sources in dwarf galaxies, seen by comparing VLASS epochs with FIRST, imply that radio variability is common among these candidates and needs multi-band follow-up to distinguish AGN variability from transients such as tidal disruption events or radio-loud supernovae.
Reading between the lines
- If the same $q<1.94$ threshold is applied to dwarfs with weak WISE detections, its validity rests on the infrared-radio scatter in dwarf galaxies being no larger than in the calibration sample; measuring the actual dwarf $q$ distribution would test whether any of the ten are ordinary low-$q$ star-forming outliers rather than AGNs.
- Beyond the paper, the same selection on the completed three-epoch VLASS could multiply the dwarf AGN sample; the catalogs published here provide the selection function needed to estimate intermediate-mass black hole occupation fractions, which would bear directly on black hole seeding models.
- The variable sources could also be followed up as tidal disruption event candidates, since the small black holes in dwarfs have strong tidal fields and the paper's luminosity arguments already exclude ordinary supernova remnants.
Editorial analysis
A structured set of objections, weighed in public.
Referee Report
Summary. The paper searches for radio-excess AGN candidates in dwarf galaxies by defining an infrared-radio correlation (IRRC) parameter q from VLASS 3 GHz and WISE W4 22 micron measurements. A Gaussian fit to the q distribution of ~6,800 galaxies in the NASA-Sloan Atlas with good W4 detections gives q_peak = 2.62, sigma = 0.34, and a 2-sigma cutoff q < 1.94. This cutoff is applied to 63,656 NSA dwarfs (M* <= 3e9 Msun, z <= 0.15) cross-matched to VLASS, yielding 123 radio matches, then 50 bona fide dwarfs after visual and spectroscopic interloper removal (HII regions, quasars, an unreliable NSA mass, PTF11qcj, and the background quasar J1136+1252). Ten objects with q < 1.94 are presented as the final radio-excess AGN sample, with five claimed as newly identified AGNs in dwarfs and eight variable radio sources relative to FIRST or VLASS epoch 1. The authors provide public catalogs of radio-excess AGNs and SF-consistent galaxies, and they argue on statistical grounds and via emission-line diagnostics that most of the ten sources are physically associated with their dwarf hosts.
Significance. If the ten candidates are genuine dwarf-galaxy AGNs, the paper provides a valuable, homogeneous VLASS-based sample of IMBH candidates, including several objects not previously recognized as AGNs and eight variables that merit follow-up. The publicly released catalogs (radio-excess AGNs and SF-consistent galaxies) are a useful community resource, and the careful interloper removal and quantitative checks against SNR luminosity relations are strengths. The novelty is incremental relative to Reines et al. (2020) and other radio searches, but the extension to the larger NSA volume with VLASS yields new candidates and demonstrates a reproducible selection recipe. The central risk is the transfer of the q < 1.94 threshold from a W4-bright, point-like calibration sample to W4-faint, potentially extended dwarfs, which is the main correctness concern for the headline claim; the paper itself acknowledges this uncertainty only qualitatively.
major comments (4)
- [Section 3.1 and Section 5.1] The q < 1.94 cutoff is calibrated on galaxies with W4 S/N >= 5 and on point-like WISE sources (the 219 extended sources with w4chi2 > 3 are removed), but it is then applied to dwarf galaxies without either a W4 S/N cut or an extended-source correction. Seven of the ten candidates have upper-limit L_TIR (Table 1), so their q values are formally upper limits; if W4 profile-fit fluxes are underestimated for resolved dwarf hosts, the true q may exceed 1.94 and the radio-excess classification could fail. The authors discuss this selection-function issue qualitatively (including the Delvecchio et al. 2021 result that <q> rises at low stellar mass and their own statement that the dwarf cutoff is likely higher), but they do not quantify the dwarf q distribution, the expected false-positive rate from star-forming dwarfs, or the size of the W4 extended-source bias. Since the five newly identified dwarf-AGN claims rest entirely on this transfer, a quantitative treatment (or a conservative re-analysis with forced aperture photometry or W4 upper limits treated as full limits) is needed.
- [Section 5.3 and Table 1] The claim that candidate IDs 6 and 7 are 'extended' (Psi_maj of 3.2 and 2.6 arcsec, respectively) is presented as possible jet evidence, but extended structure is also a natural consequence of the star-forming disk emission that the q criterion is meant to exclude. Given that most of the ten sources have upper-limit L_TIR and hence uncertain q, the two extended sources are the least secure AGN identifications; a VLASS quick-look image cutout with a resolved SF disk or a stacking test would clarify whether the extended radio emission is compact-core plus jets or distributed disk emission.
- [Section 5.2] The background contamination estimate of 4.4 +/- 2 coincidental matches is derived from the full 123 dwarf-VLASS matches and then quoted as implying 'less than 1' background source among the 10 final candidates. Because the final sample is filtered by q < 1.94 and by WISE associations, the background fraction among q-selected objects is not necessarily the same as the geometric expectation for all 123 matches; a background AGN that is radio loud and infrared faint will preferentially pass the q cut. The statistical argument would be more convincing if it were recomputed for the q < 1.94 subpopulation or with a Monte Carlo that includes realistic radio flux distributions of background AGNs.
- [Section 5.6] The comparison to Reines et al. (2020) correctly explains why only 2 of the 13 Reines et al. objects survive into the new sample, but the discussion treats the five VLASS non-detections of FIRST sources above 4 mJy as 'likely variable sources' without ruling out catalog-level issues such as VLASS quality flags, sidelobe confusion, or source blending at 2.5 arcsec resolution. A simple check of the VLASS quick-look images at the Reines et al. positions would strengthen the variability claim; as written, the variability interpretation is plausible but not fully demonstrated.
minor comments (7)
- [Abstract and Section 1] The phrase 'radio-excess AGNs' is used interchangeably for candidates and confirmed AGNs; the abstract should state explicitly that the ten are candidates requiring follow-up.
- [Section 2.1] The processing description says the CIRADA quality flag removes sources with peak brightness less than 5 times the local RMS, but the paper does not state how the integrated flux (S_3GHz) in Table 1 is measured (CIRADA catalog values vs. new aperture photometry); a sentence on the provenance of the tabulated flux densities would remove ambiguity.
- [Section 3.3, Equation 2] The spectral-index conversion is applied to sources without FIRST detections assuming alpha = -0.7, but the text does not report the uncertainty introduced by this assumption into q; a brief error-propagation statement would help the reader gauge the 2-sigma threshold's robustness.
- [Table 1] The units of L_TIR are listed as W, while L_3GHz and L_1.4GHz are in W Hz^-1; this is correct but should be stated in the table note for clarity.
- [Section 5.1] The sentence 'we find considerable uncertainty in the average value of q for galaxies with masses M* <= 10^9.5 Msun' is understated; the small-number caveat applies to the entire dwarf mass regime and should appear earlier in the selection discussion.
- [Figure 19] Several objects (IDs 3, 7, 9) have W3 upper limits and are plotted as triangles; the caption should note which points are upper limits in each band so the reader does not infer constraining WISE colors for those objects.
- [Section 5.7] The variable-source count of 8 is assembled from heterogeneous criteria (objects detected in VLASS but not FIRST, objects detected in FIRST but not VLASS, and one object missing only VLASS epoch 1); a table or list of the 8 objects with their detection history (FIRST, VLASS e1, VLASS e2) would make the claim more verifiable.
Circularity Check
No significant circularity: the q < 1.94 cutoff is calibrated on an independent full-mass NSA-VLASS-WISE sample and then applied to dwarf galaxies; the 10 candidates are outputs, not inputs.
full rationale
The derivation chain is not circular. The radio-excess threshold q < 1.94 is obtained in Section 3.3 from a Gaussian fit to the q distribution of ~6,772 galaxies with W4 S/N >= 5 and point-like WISE profiles, after removing mid-IR AGNs. This calibration sample spans the full stellar-mass range and is not constructed from the dwarf sample; the dwarf sample (Section 5.1) is used only as the target to which the externally calibrated threshold is applied. Interloper removal is based on visual inspection, SDSS/NED spectra, and published identifications (e.g., PTF11qcj, the background quasar in J1136+1252), not on re-fitting q. The background contamination estimate in Section 5.2 is recomputed from the observed offset distribution, and the statement that <~1 of 10 sources may be background is an output of that calculation. Self-citations to Reines et al. (2020) provide comparison catalogs and methodological precedent, but the classification of the 10 dwarfs does not reduce to those citations; where prior work is used for individual sources (IDs 1, 3, 4, 5, 8), it is corroborated by independent VLASS, X-ray, WISE, or BPT data. The main caveats are selection-function related rather than circular: applying the point-source-calibrated, W4-bright cutoff to W4-faint, possibly extended dwarfs may bias q, and the SNR/SFR consistency check in Section 5.1 uses SFRs derived from the same W4-based L_TIR that enters q, so it is not a fully independent test. These affect robustness of the AGN interpretation but do not constitute a derivation that reduces to its own inputs. Overall, the ten dwarf radio-excess AGN candidates are the output of an external benchmark, not a quantity fed back into the derivation.
Assumptions & free parameters
free parameters (3)
- qpeak =
2.62
- sigma_q =
0.34
- alpha =
-0.7
assumptions (4)
- domain assumption The q distribution for star-forming galaxies in the calibration sample is approximately Gaussian, so a 2 sigma cutoff cleanly separates SF from radio-excess AGNs.
- domain assumption After removing mid-IR AGNs, the IR emission of the remaining calibration galaxies is dominated by star formation.
- domain assumption The trend that average q increases with decreasing stellar mass holds down to dwarf galaxy masses, making the higher-mass q cutoff conservative when applied to dwarfs.
- domain assumption The Chomiuk and Wilcots (2009) relations between SFR and the luminosity of the brightest SNR, and the SNR luminosity function, apply to the dwarf galaxies in this sample.
Cite this review
Pith. "Pith review of Dwarf Galaxies with Radio-excess AGNs in the VLA Sky Survey." pith.science (2026). https://pith.science/paper/ZPUHZNQS
@misc{pith2026241114535,
  author       = {Pith},
  title        = {Pith review of: Dwarf Galaxies with Radio-excess AGNs in the VLA Sky Survey},
  year         = {2026},
  howpublished = {\url{https://pith.science/paper/ZPUHZNQS}},
  note         = {Machine review of arXiv:2411.14535}
}
abstract
We present a systematic search for radio active galactic nuclei (AGNs) in dwarf galaxies using recent observations taken by the Very Large Array Sky Survey (VLASS). To select these objects, we first establish a criterion to identify radio-excess AGNs using the infrared-radio correlation (IRRC) parameter, $q$, that describes the tight relation between radio and IR emission in star forming (SF) galaxies. We find a $2\sigma$ threshold of $q < 1.94$ to select radio-excess AGNs, which is derived from a sample of $\sim 7,000$ galaxies across the full mass range in the NASA-Sloan Atlas (NSA) that have radio and IR detections from VLASS and the Wide-Field Infrared Survey Explorer, respectively. We create catalogs of radio-excess AGNs and SF galaxies and make these available to the community. Applying our criterion to dwarf galaxies with stellar masses $M_\star \lesssim 3 \times 10^9 M_\odot$ and redshifts $z \le 0.15$, and carefully removing interlopers, we find 10 radio-excess AGNs with radio-optical positional offsets between $\sim$ 0 and 2.3 arcseconds (0 - 2.7 kpc). Based on statistical arguments and emission line diagnostics, we expect the majority of these radio-excess AGNs to be associated with the dwarf host galaxies rather than background AGNs. Five of the objects have evidence for hosting AGNs at other wavelengths, and 5 objects are identified as AGNs in dwarf galaxies for the first time. We also identify 8 variable radio sources in dwarf galaxies by comparing the VLASS epoch 1 and epoch 2 observations to FIRST detections presented in arXiv:1909.04670.
Figures


Figures from the paper (13 more)




Forward citations
Cited by 1 Pith paper
-
Candidate intermediate-mass black hole discovered in an extremely young low-metallicity cluster in the tadpole galaxy KUG 1138+327
A 10^40 erg/s X-ray source in KUG 1138+327 is best explained as an accreting intermediate-mass black hole, with a 200 pc radio jet-like counterpart.
Reference graph
Works this paper leans on
-
[2]
D., van Velzen, S., Horesh, A., & Zauderer, B
Alexander, K. D., van Velzen, S., Horesh, A., & Zauderer, B. A. 2020, SSRv, 216, 81, doi: 10.1007/s11214-020-00702-w
-
[3]
Baldassare, V. F., Reines, A. E., Gallo, E., et al. 2016, ApJ, 829, 57, doi: 10.3847/0004-637X/829/1/57
-
[4]
Bannister, K. W., Murphy, T., Gaensler, B. M., Hunstead, R. W., & Chatterjee, S. 2011, MNRAS, 412, 634, doi: 10.1111/j.1365-2966.2010.17938.x
arXiv 2011
-
[5]
Bell, E. F. 2003, ApJ, 586, 794, doi: 10.1086/367829
doi:10.1086/367829 2003
-
[6]
Bell, M. E., Huynh, M. T., Hancock, P., et al. 2015, MNRAS, 450, 4221, doi: 10.1093/mnras/stv882
-
[7]
Bentz, M. C., & Manne-Nicholas, E. 2018, ApJ, 864, 146, doi: 10.3847/1538-4357/aad808
-
[8]
Berger, E., Kulkarni, S. R., Frail, D. A., & Soderberg, A. M. 2003, ApJ, 599, 408, doi: 10.1086/379214
doi:10.1086/379214 2003
-
[9]
Best, P. N., Kauffmann, G., Heckman, T. M., et al. 2005a, MNRAS, 362, 25, doi: 10.1111/j.1365-2966.2005.09192.x
arXiv 2005
Show all 111 references
-
[10]
E., Croft, S., Hovatta, T., et al
Bignall, H. E., Croft, S., Hovatta, T., et al. 2015, in Advancing Astrophysics with the Square Kilometre Array (AASKA14), 58, doi: 10.22323/1.215.0058
2015 doi
-
[11]
R., Eisenstein, D., Hogg, D
Blanton, M. R., Eisenstein, D., Hogg, D. W., Schlegel, D. J., & Brinkmann, J. 2005, ApJ, 629, 143, doi: 10.1086/422897
2005 doi
- [12]
-
[13]
2013, MNRAS, 436, 3759, doi: 10.1093/mnras/stt1879
Bonzini, M., Padovani, P., Mainieri, V., et al. 2013, MNRAS, 436, 3759, doi: 10.1093/mnras/stt1879
2013 doi
-
[14]
2003, MNRAS, 344, 1000, doi: 10.1046/j.1365-8711.2003.06897.x
Bruzual, G., & Charlot, S. 2003, MNRAS, 344, 1000, doi: 10.1046/j.1365-8711.2003.06897.x
2003
-
[15]
2022, A&A, 660, A93, doi: 10.1051/0004-6361/202142911 25
Capetti, A., Brienza, M., Balmaverde, B., et al. 2022, A&A, 660, A93, doi: 10.1051/0004-6361/202142911 25
2022 doi
-
[16]
1986, A&A, 155, 297
Caplan, J., & Deharveng, L. 1986, A&A, 155, 297
1986
-
[17]
L., Ivison, R
Carilli, C. L., Ivison, R. J., & Frail, D. A. 2003, ApJ, 590, 192, doi: 10.1086/375005
2003 doi
-
[18]
Chandra, P., & Frail, D. A. 2012, ApJ, 746, 156, doi: 10.1088/0004-637X/746/2/156
2012 doi
-
[19]
Chomiuk, L., & Wilcots, E. M. 2009, ApJ, 703, 370, doi: 10.1088/0004-637X/703/1/370
2009 doi
-
[20]
Condon, J. J. 1992, ARA&A, 30, 575, doi: 10.1146/annurev.aa.30.090192.003043
1992
-
[21]
J., Cotton, W
Condon, J. J., Cotton, W. D., & Broderick, J. J. 2002, AJ, 124, 675, doi: 10.1086/341650
2002 doi
-
[22]
J., Kellermann, K
Condon, J. J., Kellermann, K. I., Kimball, A. E., Ivezi´ c,ˇZ., & Perley, R. A. 2013, ApJ, 768, 37, doi: 10.1088/0004-637X/768/1/37
2013 doi
-
[23]
J., Cotton, W
Condon, J. J., Cotton, W. D., Fomalont, E. B., et al. 2012, ApJ, 758, 23, doi: 10.1088/0004-637X/758/1/23
2012 doi
-
[24]
O., Gal-Yam, A., et al
Corsi, A., Ofek, E. O., Gal-Yam, A., et al. 2014, ApJ, 782, 42, doi: 10.1088/0004-637X/782/1/42
2014 doi
-
[25]
R., et al
Corsi, A., Gal-Yam, A., Kulkarni, S. R., et al. 2016, ApJ, 830, 42, doi: 10.3847/0004-637X/830/1/42 de Jong, T., Klein, U., Wielebinski, R., & Wunderlich, E. 1985, A&A, 147, L6 Del Moro, A., Alexander, D. M., Mullaney, J. R., et al. 2013, A&A, 549, A59, doi: 10.1051/0004-6361/...
2016 doi
-
[26]
2017, A&A, 602, A4, doi: 10.1051/0004-6361/201629430
Delhaize, J., Smolˇ ci´ c, V., Delvecchio, I., et al. 2017, A&A, 602, A4, doi: 10.1051/0004-6361/201629430
2017 doi
-
[27]
T., et al
Delvecchio, I., Daddi, E., Sargent, M. T., et al. 2021, A&A, 647, A123, doi: 10.1051/0004-6361/202039647
2021 doi
-
[28]
2012, ApJ, 745, 172, doi: 10.1088/0004-637X/745/2/172
Dicken, D., Tadhunter, C., Axon, D., et al. 2012, ApJ, 745, 172, doi: 10.1088/0004-637X/745/2/172
2012 doi
-
[29]
C., Yuan, W., et al
Dong, X.-B., Ho, L. C., Yuan, W., et al. 2012, ApJ, 755, 167, doi: 10.1088/0004-637X/755/2/167
2012 doi
-
[30]
Williams, P. K. G. 2020, ApJ, 895, 98, doi: 10.3847/1538-4357/ab9015
2020 doi
-
[31]
Alexander, K. D. 2018, ApJ, 854, 86, doi: 10.3847/1538-4357/aaa8e0
2018 doi
-
[32]
D., & Ekers, J
Ekers, R. D., & Ekers, J. A. 1973, A&A, 24, 247
1973
-
[33]
L., & Riley, J
Fanaroff, B. L., & Riley, J. M. 1974, MNRAS, 167, 31P, doi: 10.1093/mnras/167.1.31P
1974 doi
-
[34]
2012, ApJ, 747, 70, doi: 10.1088/0004-637X/747/1/70
Nakar, E. 2012, ApJ, 747, 70, doi: 10.1088/0004-637X/747/1/70
2012 doi
-
[35]
B., Yun, M
Gim, H. B., Yun, M. S., Owen, F. N., et al. 2019, ApJ, 875, 80, doi: 10.3847/1538-4357/ab1011
2019 doi
-
[36]
A., Boyce, M
Gordon, Y. A., Boyce, M. M., O’Dea, C. P., et al. 2021, ApJS, 255, 30, doi: 10.3847/1538-4365/ac05c0
2021 doi
- [38]
- [39]
-
[40]
E., Strader, J., & Ho, L
Greene, J. E., Strader, J., & Ho, L. C. 2020, ARA&A, 58, 257, doi: 10.1146/annurev-astro-032620-021835
2020 doi
-
[41]
N., Reines, A
Hainline, K. N., Reines, A. E., Greene, J. E., & Stern, D. 2016, ApJ, 832, 119, doi: 10.3847/0004-637X/832/2/119
2016 doi
-
[42]
C., Johnson, B
Hao, C.-N., Kennicutt, R. C., Johnson, B. D., et al. 2011, ApJ, 741, 124, doi: 10.1088/0004-637X/741/2/124
2011 doi
-
[43]
Heeschen, D. S. 1970, AJ, 75, 523, doi: 10.1086/110987
1970 doi
-
[44]
T., & Rowan-Robinson, M
Helou, G., Soifer, B. T., & Rowan-Robinson, M. 1985, ApJL, 298, L7, doi: 10.1086/184556
1985 doi
-
[45]
Hills, J. G. 1975, Nature, 254, 295, doi: 10.1038/254295a0
1975 doi
-
[46]
Ho, L. C. 2008, ARA&A, 46, 475, doi: 10.1146/annurev.astro.45.051806.110546
2008 arXiv
-
[47]
H., Cohen, M., Masci, F., et al
Jarrett, T. H., Cohen, M., Masci, F., et al. 2011, ApJ, 735, 112, doi: 10.1088/0004-637X/735/2/112
2011 doi
-
[48]
H., Masci, F., Tsai, C
Jarrett, T. H., Masci, F., Tsai, C. W., et al. 2013, AJ, 145, 6, doi: 10.1088/0004-6256/145/1/6
2013 doi
-
[49]
Jenkins, C. R. 1982, MNRAS, 200, 705, doi: 10.1093/mnras/200.3.705
1982 doi
-
[50]
I., Sramek, R., Schmidt, M., Shaffer, D
Kellermann, K. I., Sramek, R., Schmidt, M., Shaffer, D. B., & Green, R. 1989, AJ, 98, 1195, doi: 10.1086/115207
1989 doi
-
[51]
J., Dopita, M
Kewley, L. J., Dopita, M. A., Sutherland, R. S., Heisler, C. A., & Trevena, J. 2001, ApJ, 556, 121, doi: 10.1086/321545
2001 doi
-
[53]
E., Kellermann, K
Kimball, A. E., Kellermann, K. I., Condon, J. J., Ivezi´ c,ˇZ., & Perley, R. A. 2011, ApJL, 739, L29, doi: 10.1088/2041-8205/739/1/L29
2011 doi
-
[54]
2021, ApJ, 911, 134, doi: 10.3847/1538-4357/abec40
Geha, M. 2021, ApJ, 911, 134, doi: 10.3847/1538-4357/abec40
2021 doi
-
[55]
2015, Journal of High Energy Astrophysics, 7, 148, doi: 10.1016/j.jheap.2015.04.006
Komossa, S. 2015, Journal of High Energy Astrophysics, 7, 148, doi: 10.1016/j.jheap.2015.04.006
2015 doi
-
[56]
Kormendy, J., & Ho, L. C. 2013, ARA&A, 51, 511, doi: 10.1146/annurev-astro-082708-101811
2013 doi
-
[58]
A., Chandler, C
Lacy, M., Baum, S. A., Chandler, C. J., et al. 2020, PASP, 132, 035001, doi: 10.1088/1538-3873/ab63eb
2020 doi
-
[59]
J., Reines, A
Latimer, L. J., Reines, A. E., Hainline, K. N., Greene, J. E., & Stern, D. 2021, ApJ, 914, 133, doi: 10.3847/1538-4357/abfe0c
2021 doi
-
[60]
J., Reines, A
Latimer, L. J., Reines, A. E., Plotkin, R. M., Russell, T. D., & Condon, J. J. 2019, ApJ, 884, 78, doi: 10.3847/1538-4357/ab3289 26
2019 doi
- [61]
-
[62]
D., et al
Leitherer, C., Schaerer, D., Goldader, J. D., et al. 1999, ApJS, 123, 3, doi: 10.1086/313233
1999 doi
-
[63]
Greene, J. E. 2015, ApJ, 805, 12, doi: 10.1088/0004-637X/805/1/12
2015 doi
-
[64]
2022, A&A Rv, 30, 6, doi: 10.1007/s00159-022-00142-1
Magliocchetti, M. 2022, A&A Rv, 30, 6, doi: 10.1007/s00159-022-00142-1
2022 doi
-
[65]
2016, MNRAS, 456, 431, doi: 10.1093/mnras/stv2645
Magliocchetti, M., Lutz, D., Santini, P., et al. 2016, MNRAS, 456, 431, doi: 10.1093/mnras/stv2645
2016 doi
-
[66]
J., et al
Mateos, S., Alonso-Herrero, A., Carrera, F. J., et al. 2012, MNRAS, 426, 3271, doi: 10.1111/j.1365-2966.2012.21843.x
2012
-
[67]
A., Morgan, W
Matthews, T. A., Morgan, W. W., & Schmidt, M. 1964, ApJ, 140, 35, doi: 10.1086/147890
1964 doi
-
[68]
Mauch, T., & Sadler, E. M. 2007, MNRAS, 375, 931, doi: 10.1111/j.1365-2966.2006.11353.x
2007
-
[69]
J., & Ma, C.-P
McConnell, N. J., & Ma, C.-P. 2013, ApJ, 764, 184, doi: 10.1088/0004-637X/764/2/184
2013 doi
-
[70]
2018, MNRAS, 478, 2576, doi: 10.1093/mnras/sty1163
Mezcua, M., Civano, F., Marchesi, S., et al. 2018, MNRAS, 478, 2576, doi: 10.1093/mnras/sty1163
2018 doi
-
[71]
2019, MNRAS, 488, 685, doi: 10.1093/mnras/stz1760
Mezcua, M., Suh, H., & Civano, F. 2019, MNRAS, 488, 685, doi: 10.1093/mnras/stz1760
2019 doi
-
[72]
A., & Mead, A
Miller, L., Peacock, J. A., & Mead, A. R. G. 1990, MNRAS, 244, 207
1990
-
[73]
Condon, J. J. 2021, ApJ, 910, 5, doi: 10.3847/1538-4357/abe120
2021 doi
-
[74]
P., Hallinan, G., Bourke, S., et al
Mooley, K. P., Hallinan, G., Bourke, S., et al. 2016, ApJ, 818, 105, doi: 10.3847/0004-637X/818/2/105
2016 doi
-
[75]
C., Shahinyan, K., Sugarman, H
Moran, E. C., Shahinyan, K., Sugarman, H. R., V´ elez, D. O., & Eracleous, M. 2014, AJ, 148, 136, doi: 10.1088/0004-6256/148/6/136
2014 doi
-
[76]
J., Condon, J
Murphy, E. J., Condon, J. J., Schinnerer, E., et al. 2011, ApJ, 737, 67, doi: 10.1088/0004-637X/737/2/67
2011 doi
-
[77]
A., Dunlop, J
Nolan, L. A., Dunlop, J. S., Kukula, M. J., et al. 2001, MNRAS, 323, 308, doi: 10.1046/j.1365-8711.2001.04174.x
2001
-
[78]
2017, A&A, 602, A5, doi: 10.1051/0004-6361/201629436
Novak, M., Smolˇ ci´ c, V., Delhaize, J., et al. 2017, A&A, 602, A5, doi: 10.1051/0004-6361/201629436
2017 doi
-
[79]
Z., Patil, P., et al
Nyland, K., Dong, D. Z., Patil, P., et al. 2020, ApJ, 905, 74, doi: 10.3847/1538-4357/abc341
2020 doi
-
[80]
Ofek, E. O. 2017, ApJ, 846, 44, doi: 10.3847/1538-4357/aa8310
2017 doi
-
[81]
T., Corsi, A., P´ erez-Torres, M., Varenius, E., & Van Eerten, H
Palliyaguru, N. T., Corsi, A., P´ erez-Torres, M., Varenius, E., & Van Eerten, H. 2021, ApJ, 910, 16, doi: 10.3847/1538-4357/abe1c9
2021 doi
-
[82]
T., Corsi, A., Frail, D
Palliyaguru, N. T., Corsi, A., Frail, D. A., et al. 2019, ApJ, 872, 201, doi: 10.3847/1538-4357/aaf64d
2019 doi
-
[83]
D., Laor, A., et al
Panessa, F., Baldi, R. D., Laor, A., et al. 2019, Nature Astronomy, 3, 387, doi: 10.1038/s41550-019-0765-4
2019 doi
-
[84]
P., & Keane, E
Pietka, M., Fender, R. P., & Keane, E. F. 2015, MNRAS, 446, 3687, doi: 10.1093/mnras/stu2335
2015 doi
-
[85]
M., & Reines, A
Plotkin, R. M., & Reines, A. E. 2018, in Astronomical Society of the Pacific Conference Series, Vol. 517, Science with a Next Generation Very Large Array, ed. E. Murphy, 719
2018
-
[86]
E., Hester, J
Reed, J. E., Hester, J. J., Fabian, A. C., & Winkler, P. F. 1995, ApJ, 440, 706, doi: 10.1086/175308
1995 doi
-
[87]
Reines, A. E. 2022, Nature Astronomy, 6, 26–34, doi: 10.1038/s41550-021-01556-0
2022 doi
-
[88]
E., & Comastri, A
Reines, A. E., & Comastri, A. 2016, PASA, 33, e054, doi: 10.1017/pasa.2016.46
2016 doi
-
[89]
E., Condon, J
Reines, A. E., Condon, J. J., Darling, J., & Greene, J. E. 2020, ApJ, 888, 36, doi: 10.3847/1538-4357/ab4999
2020 doi
-
[90]
E., Greene, J
Reines, A. E., Greene, J. E., & Geha, M. 2013, ApJ, 775, 116, doi: 10.1088/0004-637X/775/2/116
2013 doi
-
[91]
E., & Volonteri, M
Reines, A. E., & Volonteri, M. 2015, ApJ, 813, 82, doi: 10.1088/0004-637X/813/2/82
2015 doi
-
[92]
2018, MNRAS, 481, 3278, doi: 10.1093/mnras/sty2448
Ricarte, A., & Natarajan, P. 2018, MNRAS, 481, 3278, doi: 10.1093/mnras/sty2448
2018 doi
-
[93]
C., Naoz, S., Sari, R., & Linial, I
Rose, S. C., Naoz, S., Sari, R., & Linial, I. 2022, ApJL, 929, L22, doi: 10.3847/2041-8213/ac6426
2022 doi
-
[94]
N., Hardcastle, M
Sabater, J., Best, P. N., Hardcastle, M. J., et al. 2019, A&A, 622, A17, doi: 10.1051/0004-6361/201833883
2019 doi
-
[95]
E., & Molina, M
Salehirad, S., Reines, A. E., & Molina, M. 2022, ApJ, 937, 7, doi: 10.3847/1538-4357/ac8876
2022 doi
-
[96]
J., Johnson, M
Sargent, A. J., Johnson, M. C., Reines, A. E., et al. 2022, ApJ, 933, 160, doi: 10.3847/1538-4357/ac74be
2022 doi
-
[97]
P., & Secrest, N
Satyapal, S., Abel, N. P., & Secrest, N. J. 2018, ApJ, 858, 38, doi: 10.3847/1538-4357/aab7f8
2018 doi
-
[98]
Schutte, Z., & Reines, A. E. 2022, Nature, 601, 329, doi: 10.1038/s41586-021-04215-6
2022 doi
-
[99]
E., & Greene, J
Schutte, Z., Reines, A. E., & Greene, J. E. 2019, ApJ, 887, 245, doi: 10.3847/1538-4357/ab35dd
2019 doi
-
[100]
2001, AJ, 122, 1238, doi: 10.1086/322094
Shimasaku, K., Fukugita, M., Doi, M., et al. 2001, AJ, 122, 1238, doi: 10.1086/322094
2001 doi
-
[101]
2004, A&A, 421, 129, doi: 10.1051/0004-6361:20035908
Siebenmorgen, R., Freudling, W., Kr¨ ugel, E., & Haas, M. 2004, A&A, 421, 129, doi: 10.1051/0004-6361:20035908
2004 doi
-
[102]
L., Shields, G
Smith, K. L., Shields, G. A., Bonning, E. W., et al. 2010, ApJ, 716, 866, doi: 10.1088/0004-637X/716/1/866 Smolˇ ci´ c, V., Zamorani, G., Schinnerer, E., et al. 2009, ApJ, 696, 24, doi: 10.1088/0004-637X/696/1/24 Smolˇ ci´ c, V., Novak, M., Bondi, M., et al. 2017, A&A, 602, A1...
2010 doi
-
[103]
M., Nakar, E., Berger, E., & Kulkarni, S
Soderberg, A. M., Nakar, E., Berger, E., & Kulkarni, S. R. 2006, ApJ, 638, 930, doi: 10.1086/499121 27
2006 doi
-
[104]
G., Perley, R
Stern, D., Djorgovski, S. G., Perley, R. A., de Carvalho, R. R., & Wall, J. V. 2000, AJ, 119, 1526, doi: 10.1086/301316
2000 doi
-
[105]
J., Benford, D
Stern, D., Assef, R. J., Benford, D. J., et al. 2012, ApJ, 753, 30, doi: 10.1088/0004-637X/753/1/30
2012 doi
-
[106]
J., White, R
Thyagarajan, N., Helfand, D. J., White, R. L., & Becker, R. H. 2011, ApJ, 742, 49, doi: 10.1088/0004-637X/742/1/49
2011 doi
-
[107]
E., & Darling, J
Truebenbach, A. E., & Darling, J. 2017, MNRAS, 468, 196, doi: 10.1093/mnras/stx456
2017 doi
-
[108]
M., & Padovani, P
Urry, C. M., & Padovani, P. 1995, PASP, 107, 803, doi: 10.1086/133630 van Velzen, S., Bower, G. C., & Metzger, B. D. 2018, in Astronomical Society of the Pacific Conference Series, Vol. 517, Science with a Next Generation Very Large Array, ed. E. Murphy, 737, doi: 10.48550/arX...
-
[109]
2008, MNRAS, 383, 1079, doi: 10.1111/j.1365-2966.2007.12589.x
Volonteri, M., Lodato, G., & Natarajan, P. 2008, MNRAS, 383, 1079, doi: 10.1111/j.1365-2966.2007.12589.x
2008
-
[110]
2009, MNRAS, 400, 1911, doi: 10.1111/j.1365-2966.2009.15577.x
Volonteri, M., & Natarajan, P. 2009, MNRAS, 400, 1911, doi: 10.1111/j.1365-2966.2009.15577.x
2009
-
[111]
L., Becker, R
White, R. L., Becker, R. H., Helfand, D. J., & Gregg, M. D. 1997, ApJ, 475, 479, doi: 10.1086/303564
1997 doi
-
[112]
L., Eisenhardt, P
Wright, E. L., Eisenhardt, P. R. M., Mainzer, A. K., et al. 2010, AJ, 140, 1868, doi: 10.1088/0004-6256/140/6/1868 —. 2019, AllWISE Source Catalog, IPAC, doi: 10.26131/IRSA1
2010 doi
-
[113]
G., Adelman, J., Anderson, John E., J., et al
York, D. G., Adelman, J., Anderson, John E., J., et al. 2000, AJ, 120, 1579, doi: 10.1086/301513
2000 doi
-
[114]
S., Reddy, N
Yun, M. S., Reddy, N. A., & Condon, J. J. 2001, ApJ, 554, 803, doi: 10.1086/323145
2001 doi
-
[115]
L., Lampayan, K., Petric, A., et al
Zakamska, N. L., Lampayan, K., Petric, A., et al. 2016, MNRAS, 455, 4191, doi: 10.1093/mnras/stv2571
2016 doi
Reviewed August 12, 2026 · model on record in the stance chip above.
Discussion (0). Continue with ORCID to comment.