Recognition: no theorem link
The LOFAR sub-arcsecond view of the high-redshift radio relic in PSZ2G091.83+26.11
Pith reviewed 2026-05-15 19:03 UTC · model grok-4.3
The pith
Sub-arcsecond LOFAR imaging at 145 MHz shows a radio relic in a z=0.822 cluster connected by emission to a radio galaxy ahead of the shock, with downstream profiles matching a log-normal magnetic field.
A machine-rendered reading of the paper's core claim, the machinery that carries it, and where it could break.
Core claim
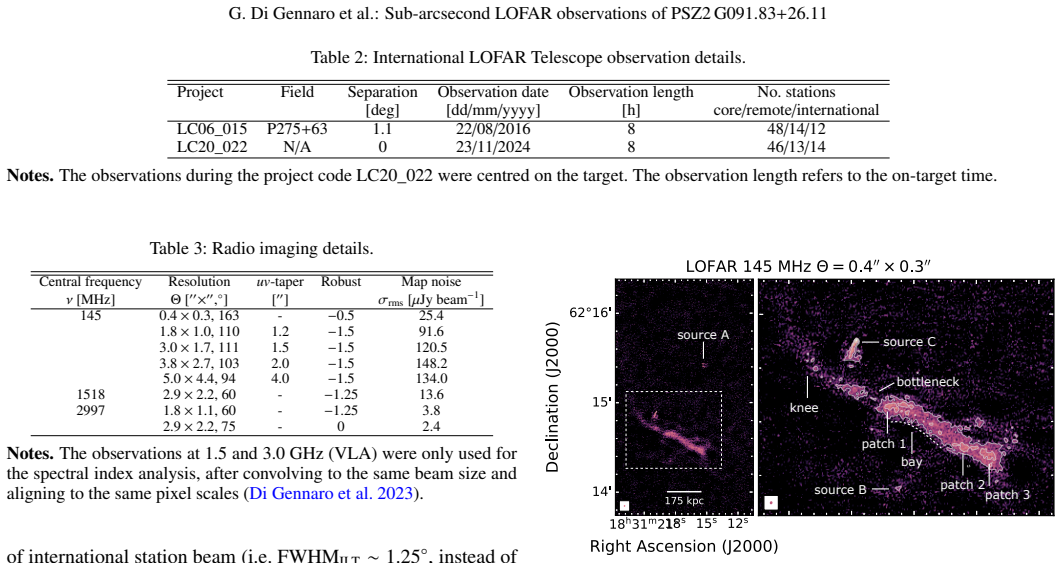
High-resolution 0.4 arcsecond and 1.9 arcsecond LOFAR images at 145 MHz combined with VLA data confirm the relic is genuine diffuse emission rather than a radio galaxy. Emission appears ahead of the shock and physically connects the relic to a radio galaxy. Spectral-index maps show a gradient toward the cluster center. The 1.9 arcsecond brightness profiles across the downstream region at 145 MHz and 3 GHz follow the shape expected for a log-normal magnetic-field distribution. The shock surface itself exhibits a sharp discontinuity coinciding with jumps in electron density, rotation measure, and fractional polarization.
What carries the argument
Sub-arcsecond LOFAR long-baseline imaging at 145 MHz, which isolates the shock acceleration site and downstream plasma from radio-galaxy contamination.
If this is right
- The log-normal magnetic field distribution accounts for the observed radio brightness decline away from the shock at both low and high frequencies.
- The physical link between relic and radio galaxy supplies a plausible source of seed electrons for diffusive shock acceleration.
- The sharp changes in polarization and rotation measure at the shock surface indicate rapid magnetic-field amplification or reorientation across the front.
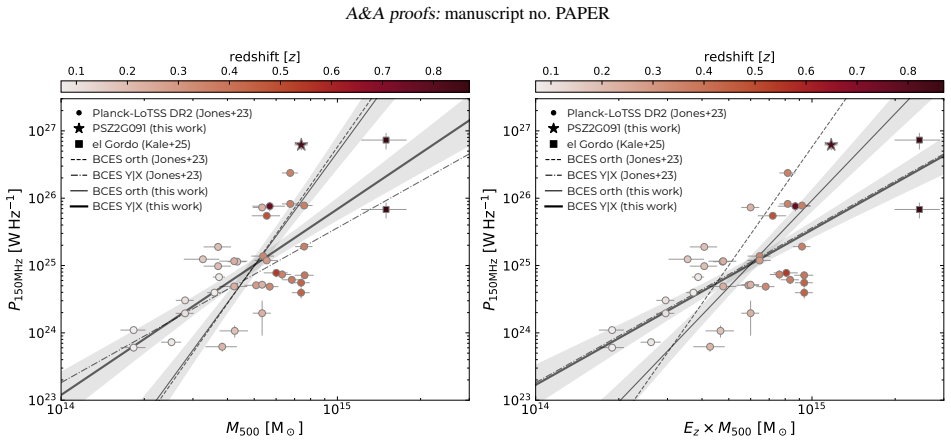
- Tentative redshift evolution in radio power versus cluster mass would require models of relic formation to include stronger inverse-Compton losses at early cosmic times.
Where Pith is reading between the lines
- If the radio-galaxy connection holds in other high-redshift relics, particle injection from active galaxies may be a common trigger for relic formation.
- Improved low-frequency resolution could allow direct comparison of shock Mach numbers derived from radio data with those from X-ray density jumps in distant clusters.
- The same LOFAR long-baseline technique could test whether log-normal magnetic fields are universal in relics or vary with cluster mass and redshift.
Load-bearing premise
The observed discontinuity, profiles, and connection are produced solely by the relic shock plus a log-normal magnetic field without major contamination from the linked radio galaxy or line-of-sight projection effects.
What would settle it
New observations at higher resolution or additional frequencies that show the ahead-of-shock emission is unrelated or that the downstream brightness profiles deviate strongly from log-normal would falsify the claimed magnetic-field distribution and shock interpretation.
Figures


read the original abstract
Enhanced inverse Compton (IC) losses at high redshift steepen diffuse radio spectra in galaxy clusters, making low-frequency (~100 MHz) observations favorable. However, low-frequency studies often lack the resolution needed to locate particle acceleration sites or separate diffuse emission from radio galaxies. In this paper, we unveil the properties of the radio relic in the distant cluster PSZ2G091.83+26.11 (z=0.822) by resolving the acceleration site and inspecting the downstream region. Using the European LOFAR (ILT) at 145 MHz, we study a radio relic at (sub-)arcsecond resolution for the first time below 1 GHz, complemented by arcsecond-resolution VLA data at higher frequencies. We confirm the diffuse emission is not a radio galaxy. A spectral index gradient toward the cluster center matches previous 5'' maps. High-resolution 0.4'' and 1.9'' images reveal emission ahead of the shock, connecting the relic to a radio galaxy. 1.9'' profiles across the downstream at 145 MHz and 3.0 GHz follow a log-normal magnetic field distribution. The 145 MHz shock surface shows a sharp discontinuity at the same location of a change in electron density, Rotation Measure, and fractional polarization, likely tied to magnetic field changes. Finally, we find hints of redshift evolution of the radio power versus cluster mass correlation. The impressive angular resolution achievable by the LOFAR long baselines is opening an unprecedented view of the low energetic plasma in galaxy clusters. This is extremely significant in the case of high-redshift clusters, where radio emission at low frequencies is less affected by energy losses but its detection is strongly limited by poor resolution.
Editorial analysis
A structured set of objections, weighed in public.
Referee Report
Summary. The manuscript presents the first sub-arcsecond LOFAR ILT observations at 145 MHz of the radio relic in the high-redshift cluster PSZ2G091.83+26.11 (z=0.822), combined with arcsecond VLA data at 3 GHz. It confirms the emission is diffuse rather than a radio galaxy, reports a spectral index gradient, identifies emission ahead of the shock connecting the relic to a radio galaxy, shows that 1.9'' downstream profiles at both frequencies are consistent with a log-normal magnetic field distribution, notes a sharp discontinuity at the shock surface aligned with changes in electron density, RM and polarization, and finds hints of redshift evolution in the radio power versus cluster mass correlation.
Significance. If the central interpretations hold, the work is significant for demonstrating LOFAR long-baseline capabilities in resolving low-frequency emission from high-z clusters, where IC losses make such observations favorable. It provides direct observational constraints on magnetic field distributions and shock properties in relics, strengthening models of merger-driven particle acceleration and non-thermal ICM components.
major comments (2)
- [Downstream profiles section] In the section presenting the 1.9'' downstream profiles at 145 MHz and 3.0 GHz, the log-normal magnetic field distribution fit assumes the intensity and spectral gradients arise solely from relic shock compression. The 0.4'' images reveal emission ahead of the shock that physically connects the relic to a radio galaxy. The manuscript does not specify the exact profile extraction apertures, any masking applied to the connected emission, or tests for projection effects, leaving the fit potentially vulnerable to systematic bias from non-relic contributions.
- [Shock discontinuity section] In the discussion of the 145 MHz shock surface discontinuity, the reported alignment with changes in electron density, RM, and fractional polarization is used to infer magnetic field changes. A quantitative assessment of the positional coincidence (including alignment uncertainties between datasets) and any alternative explanations would strengthen the claim that the discontinuity is tied exclusively to the relic shock.
minor comments (3)
- [Abstract] The abstract states 'hints of redshift evolution' without quantifying the statistical significance or specifying the comparison sample size; adding this detail would improve clarity.
- [Figures] Figure captions for the high-resolution images should explicitly label the location of the radio galaxy connection and the profile extraction regions to aid interpretation.
- [Methods] In the methods section, expand the description of LOFAR long-baseline calibration and imaging parameters to facilitate reproducibility of the sub-arcsecond results.
Simulated Author's Rebuttal
We thank the referee for the positive assessment and constructive comments, which will improve the clarity of the manuscript. We address each major comment below and will revise the paper accordingly.
read point-by-point responses
-
Referee: [Downstream profiles section] In the section presenting the 1.9'' downstream profiles at 145 MHz and 3.0 GHz, the log-normal magnetic field distribution fit assumes the intensity and spectral gradients arise solely from relic shock compression. The 0.4'' images reveal emission ahead of the shock that physically connects the relic to a radio galaxy. The manuscript does not specify the exact profile extraction apertures, any masking applied to the connected emission, or tests for projection effects, leaving the fit potentially vulnerable to systematic bias from non-relic contributions.
Authors: We agree that additional methodological details are needed. In the revised manuscript we will explicitly state the exact apertures used for the 1.9'' downstream profiles (centered on the relic emission and excluding the bridge region), describe the masking applied to remove the connecting emission to the radio galaxy, and include a short discussion of projection effects based on the observed geometry. These clarifications will demonstrate that the log-normal magnetic-field fit is robust against the localized non-relic contribution. revision: yes
-
Referee: [Shock discontinuity section] In the discussion of the 145 MHz shock surface discontinuity, the reported alignment with changes in electron density, RM, and fractional polarization is used to infer magnetic field changes. A quantitative assessment of the positional coincidence (including alignment uncertainties between datasets) and any alternative explanations would strengthen the claim that the discontinuity is tied exclusively to the relic shock.
Authors: We thank the referee for this suggestion. The revised version will include a quantitative assessment of the positional offsets between the 145 MHz discontinuity and the changes in electron density, RM, and polarization, together with the estimated alignment uncertainties derived from cross-registration of the LOFAR, VLA, and X-ray datasets. We will also briefly discuss alternative explanations (e.g., projection effects or unrelated foreground structures) and argue why the multi-wavelength spatial coincidence favors the interpretation tied to the relic shock and associated magnetic-field variations. revision: yes
Circularity Check
No significant circularity; purely observational measurements and profile comparisons
full rationale
The paper reports high-resolution imaging, spectral index gradients, downstream profiles, and a discontinuity at the shock surface from LOFAR 145 MHz and VLA 3 GHz data. The statement that profiles 'follow a log-normal magnetic field distribution' is a direct comparison of observed intensity profiles to an external model, not a derivation that reduces to the paper's own fitted inputs by construction. No equations, self-citations, or uniqueness theorems are invoked as load-bearing steps in the provided text. The analysis remains self-contained against external radio data and does not rename known results or smuggle ansatzes via citation.
Axiom & Free-Parameter Ledger
axioms (1)
- domain assumption Standard synchrotron emission and inverse Compton loss assumptions for radio relics
Forward citations
Cited by 1 Pith paper
-
Galaxy clusters in the LoTSS-DR3: Catalogues and detection pipeline for diffuse radio emission
A Radio U-Net pipeline produces pixel-level segmentation maps and probability scores for diffuse radio emission in 3822 galaxy clusters from LoTSS-DR3, yielding a high-confidence sample of 357 and confirming trends wi...
Reference graph
Works this paper leans on
-
[1]
Akritas, M. G. & Bershady, M. A. 1996, ApJ, 470, 706 Astropy Collaboration, Price-Whelan, A. M., Sip˝ocz, B. M., et al. 2018, AJ, 156, 123 Astropy Collaboration, Robitaille, T. P., Tollerud, E. J., et al. 2013, A&A, 558, A33
work page 1996
-
[2]
Balboni, M., Ettori, S., Gastaldello, F., et al. 2025, A&A, 695, A180
work page 2025
- [3]
-
[4]
Bonafede, A., Intema, H. T., Brüggen, M., et al. 2014, ApJ, 785, 1
work page 2014
- [5]
-
[6]
Botteon, A., Gastaldello, F., & Brunetti, G. 2018, MNRAS, 476, 5591
work page 2018
-
[7]
Botteon, A., Shimwell, T. W., Cassano, R., et al. 2022, A&A, 660, A78 Brüggen, M., Bykov, A., Ryu, D., & Röttgering, H. 2012, Space Sci. Rev., 166, 187
work page 2022
-
[8]
Brunetti, G. & Jones, T. W. 2014, International Journal of Modern Physics D, 23, 1430007
work page 2014
-
[9]
Carilli, C. L. & Taylor, G. B. 2002, ARA&A, 40, 319
work page 2002
-
[10]
Cassano, R., Botteon, A., Di Gennaro, G., et al. 2019, ApJ, 881, L18
work page 2019
- [11]
-
[12]
Cassano, R., Ettori, S., Brunetti, G., et al. 2013, ApJ, 777, 141
work page 2013
-
[13]
Cordun, C. M., Timmerman, R., Miley, G. K., et al. 2023, A&A, 676, A29
work page 2023
-
[14]
2023, arXiv e-prints, arXiv:2305.04564 de Gasperin, F., Dijkema, T
Cuciti, V ., Cassano, R., Sereno, M., et al. 2023, arXiv e-prints, arXiv:2305.04564 de Gasperin, F., Dijkema, T. J., Drabent, A., et al. 2019, A&A, 622, A5 de Gasperin, F., Edler, H. W., Williams, W. L., et al. 2023, A&A, 673, A165 de Gasperin, F., van Weeren, R. J., Brüggen, M., et al. 2014, MNRAS, 444, 3130 de Jong, J. M. G. H. J., van Weeren, R. J., Sw...
-
[15]
Govoni, F. & Feretti, L. 2004, International Journal of Modern Physics D, 13, 1549
work page 2004
-
[16]
Groeneveld, C., van Weeren, R. J., Miley, G. K., et al. 2022, A&A, 658, A9
work page 2022
- [17]
-
[18]
Harris, C. R., Millman, K. J., van der Walt, S. J., et al. 2020, Nature, 585, 357
work page 2020
-
[19]
HLavacek-Larrondo, J., Timmerman, R., Pfrommer, C., et al. 2025, ApJ, 987, L40
work page 2025
- [20]
-
[21]
Hoeft, M., Brüggen, M., Yepes, G., Gottlöber, S., & Schwope, A. 2008, MNRAS, 391, 1511
work page 2008
-
[22]
Hoeft, M., Rajpurohit, K., Wittor, D., di Gennaro, G., & Domínguez-Fernández, P. 2022, Galaxies, 10, 10
work page 2022
-
[23]
Hutschenreuter, S., Anderson, C. S., Betti, S., et al. 2022, A&A, 657, A43
work page 2022
-
[24]
T., Jagannathan, P., Mooley, K
Intema, H. T., Jagannathan, P., Mooley, K. P., & Frail, D. A. 2017, A&A, 598, A78
work page 2017
- [25]
-
[26]
Jones, A., de Gasperin, F., Cuciti, V ., et al. 2023, A&A, 680, A31
work page 2023
- [27]
-
[28]
2015, Journal of Korean Astronomical Society, 48, 9
Kang, H. 2015, Journal of Korean Astronomical Society, 48, 9
work page 2015
-
[29]
2017, in International Cosmic Ray Conference, V ol
Kang, H., Ryu, D., & Jones, T. 2017, in International Cosmic Ray Conference, V ol. 301, 35th International Cosmic Ray Conference (ICRC2017), 283
work page 2017
-
[30]
Kang, H., Ryu, D., & Jones, T. W. 2012, ApJ, 756, 97
work page 2012
-
[31]
Kardashev, N. S. 1962, Soviet Ast., 6, 317
work page 1962
- [32]
- [33]
- [34]
-
[35]
Markevitch, M., Govoni, F., Brunetti, G., & Jerius, D. 2005, ApJ, 627, 733
work page 2005
- [36]
- [37]
-
[38]
Morabito, L. K., Deller, A. T., Röttgering, H., et al. 2016, MNRAS, 461, 2676
work page 2016
-
[39]
K., Jackson, N., de Jong, J., et al
Morabito, L. K., Jackson, N., de Jong, J., et al. 2025, Ap&SS, 370, 19
work page 2025
-
[40]
E., Gelszinnis, J., Hoeft, M., & Yepes, G
Nuza, S. E., Gelszinnis, J., Hoeft, M., & Yepes, G. 2017, MNRAS, 470, 240
work page 2017
-
[41]
R., McKinley, B., Hurley-Walker, N., et al
Offringa, A. R., McKinley, B., Hurley-Walker, N., et al. 2014, MNRAS, 444, 606
work page 2014
-
[42]
Offringa, A. R. & Smirnov, O. 2017, MNRAS, 471, 301
work page 2017
-
[43]
Osinga, E., van Weeren, R. J., Boxelaar, J. M., et al. 2021, A&A, 648, A11
work page 2021
-
[44]
Pasini, T., Mahatma, V . H., Brienza, M., et al. 2025, A&A, 693, A94
work page 2025
-
[45]
Perley, R. A., Chandler, C. J., Butler, B. J., & Wrobel, J. M. 2011, ApJ, 739, L1 Planck Collaboration, Ade, P. A. R., Aghanim, N., et al. 2016, A&A, 594, A27
work page 2011
-
[46]
Raja, R., Rahaman, M., Datta, A., & Smirnov, O. M. 2024, ApJ, 975, 125
work page 2024
- [47]
- [48]
-
[49]
Robitaille, T. & Bressert, E. 2012, APLpy: Astronomical Plotting Library in
work page 2012
-
[50]
Shimwell, T. W., Hardcastle, M. J., Tasse, C., et al. 2022, A&A, 659, A1
work page 2022
-
[51]
Shimwell, T. W., Röttgering, H. J. A., Best, P. N., et al. 2017, A&A, 598, A104
work page 2017
-
[52]
Shimwell, T. W., Tasse, C., Hardcastle, M. J., et al. 2019, A&A, 622, A1
work page 2019
-
[53]
Smirnov, O. M. & Tasse, C. 2015, MNRAS, 449, 2668
work page 2015
-
[54]
Sokoloff, D. D., Bykov, A. A., Shukurov, A., et al. 1998, MNRAS, 299, 189
work page 1998
- [55]
-
[56]
Sweijen, F., Morabito, L. K., Harwood, J., et al. 2022, A&A, 658, A3
work page 2022
- [57]
- [58]
- [59]
-
[60]
Timmerman, R., van Weeren, R. J., Botteon, A., et al. 2024, A&A, 687, A31
work page 2024
-
[61]
Timmerman, R., van Weeren, R. J., Callingham, J. R., et al. 2022, A&A, 658, A5 van Haarlem, M. P., Wise, M. W., Gunst, A. W., et al. 2013, A&A, 556, A2 van Weeren, R. J., Andrade-Santos, F., Dawson, W. A., et al. 2017, Nature As- tronomy, 1, 0005 van Weeren, R. J., Brunetti, G., Brüggen, M., et al. 2016, ApJ, 818, 204 van Weeren, R. J., de Gasperin, F., A...
work page 2022
- [62]
-
[63]
Williams, W. L., van Weeren, R. J., Röttgering, H. J. A., et al. 2016, MNRAS, 460, 2385
work page 2016
-
[64]
Wittor, D., Hoeft, M., Vazza, F., Brüggen, M., & Domínguez-Fernández, P. 2019, MNRAS, 490, 3987
work page 2019
-
[65]
2010, in ISKAF2010 Science Meeting, ed
Wucknitz, O. 2010, in ISKAF2010 Science Meeting, ed. J. van Leeuwen, 58 Article number, page 10 G. Di Gennaro et al.: Sub-arcsecond LOFAR observations of PSZ2 G091.83+26.11 Appendix A: All frequency images In this section, we show the additional frequency images of PSZ2G091. 18h31m30s24s 18s 12s 06s 62°16' 15' 14' Right Ascension (J2000) Declination (J200...
work page 2010
discussion (0)
Sign in with ORCID, Apple, or X to comment. Anyone can read and Pith papers without signing in.