REVIEW 3 major objections 3 minor 2 cited by
Stellar mass and morphology segregation in pairs and multiplets in the cosmic web
T0 review · 3 major / 3 minor · reviewed 2026-05-09 · grok-4.3
Pith's one-line read Large-scale cosmic web position shapes galaxy stellar masses and morphologies beyond the effects of local companions.
desk verdict The paper adds some useful numbers on lower stellar masses and later morphologies in voids versus denser regions, holding for both singlets and multiplets, but the claim that local environment is insufficient rests on LSS classifications that may not cleanly separate scales. read the letter →
The pith
A machine-rendered reading of the paper's core claim, the machinery that carries it, and where it could break.
The reading
What carries the argument
Dual classification of galaxies into large-scale structure categories (voids, clusters, NCNV) and local environment categories (singlets, multiplets, pairs) to separate and compare their effects on stellar mass and morphology distributions.
What would settle it
A measurement showing identical stellar mass distributions for isolated galaxies across voids and denser regions when using a refined three-dimensional density field that removes line-of-sight projections.
Extended reading notes
Core claim
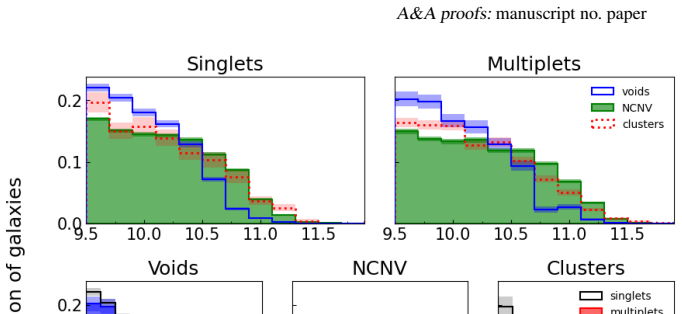
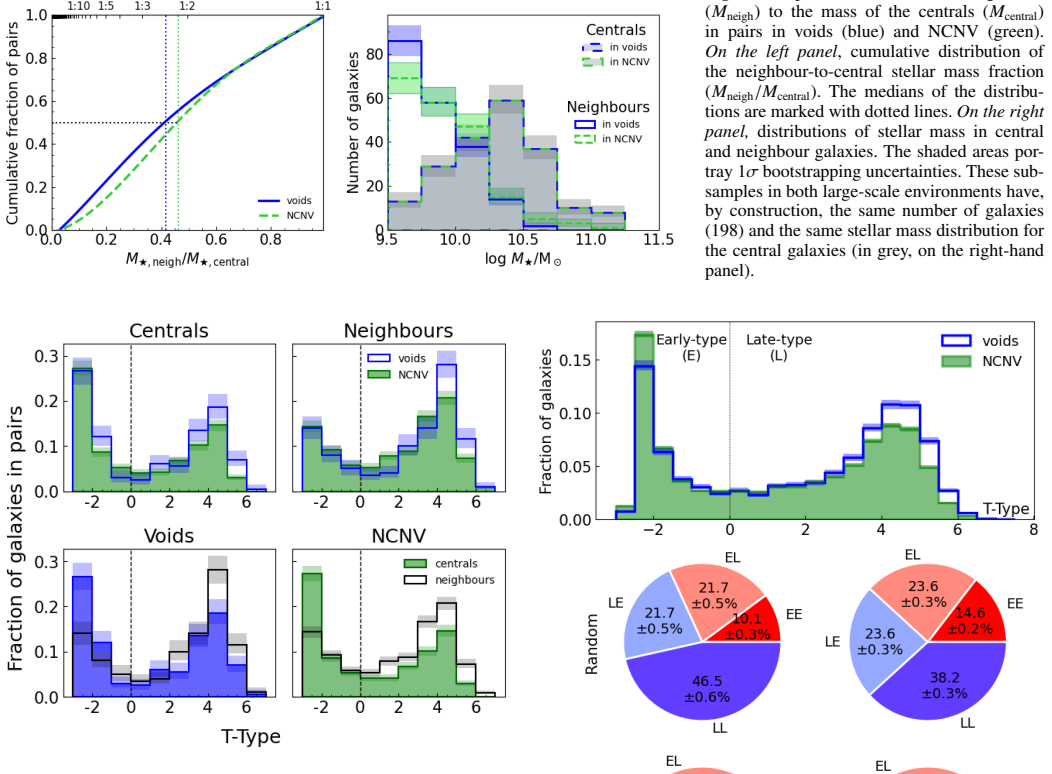
Galaxies are less massive in voids than in clusters or NCNV regions irrespective of local environment, with satellites in voids less massive relative to centrals than in NCNV pairs. The proportion of early-type galaxies increases with large-scale structure density, and this holds even for singlets. Late-type multiplets in voids and NCNV tend to be later spirals than singlets, while centrals in pairs are more early-type than satellites. The sample shows slightly higher early-type and multiplet fractions than prior work. These distributions support a scenario in which galaxy assembly depends critically on host halos whose properties relate to large-scale environment.
Load-bearing premise
That the assignment of galaxies to voids, clusters, and NCNV based on large-scale structure faithfully traces true environmental densities without major projection effects or selection biases in the chosen redshift slice.
Editorial extensions
If this is right
- Galaxy assembly processes must be linked to host halo properties that vary systematically with large-scale environment.
- Lower-mass galaxies preferentially occupy voids because their halos assembled in underdense regions.
- Multiplets share a common evolutionary origin tied to the halo properties set by their large-scale surroundings.
- Morphology segregation operates at both local and global scales, with early-types favored in denser cosmic web components.
Reading between the lines
- Galaxy evolution models could be tested by checking whether halo mass functions at fixed local density differ between voids and filaments.
- Surveys with improved redshift precision could reduce projection uncertainties and either reinforce or weaken the reported trends.
- The multi-scale environmental dependence may extend to other observables such as star-formation rates or gas content.
Editorial analysis
A structured set of objections, weighed in public.
Referee Report
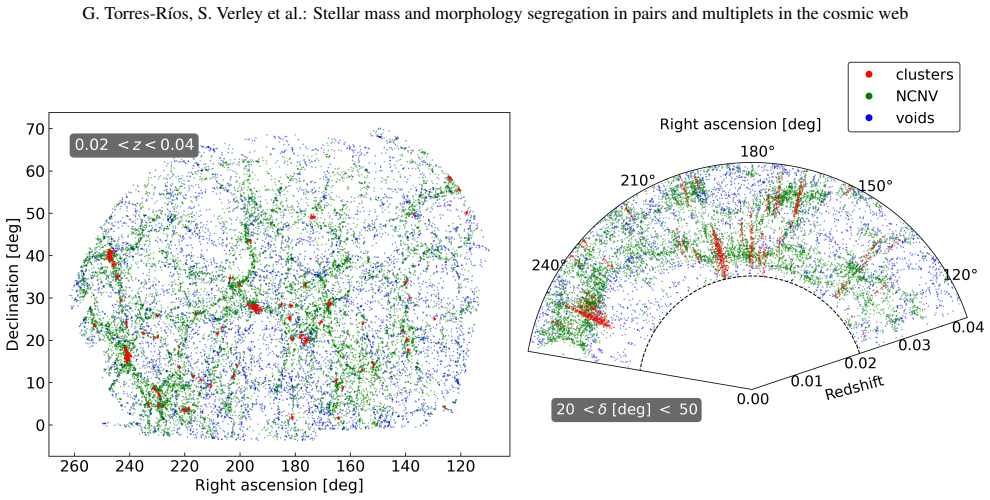
Summary. The paper analyzes 25,309 galaxies at 0.02 < z ≤ 0.04 with log M*/M⊙ ≥ 9.5, classifying them by large-scale structure (voids, clusters, NCNV) and local environment (singlets vs. multiplets, including pairs). It reports stellar mass and morphology distributions, finding lower masses in voids independent of local companions, higher early-type fractions in denser LSS even for singlets, and morphology differences in multiplets. The central claim is that local environment alone is insufficient to explain the distributions; galaxy assembly depends on host halos whose properties correlate with large-scale environment.
Significance. If the LSS classifications are robust, the work supplies quantitative empirical distributions from a sizable sample that separate local and global environmental effects, adding concrete support for assembly bias or halo-LSS connections in galaxy evolution models. The focus on pairs and the ~22% companion fraction in voids are useful additions to the local-Universe environmental literature.
major comments (3)
- [§2 (LSS classification)] §2 (or equivalent data/methods section on LSS classification): The void/cluster/NCNV assignment method is described only at a high level; no quantitative tests (e.g., mock catalogs, variation of density thresholds, or redshift-slice stability checks) are presented to demonstrate that the labels remain distinct from local companion status after accounting for redshift-space distortions and projection effects in the narrow 0.02 < z ≤ 0.04 volume. This directly affects the load-bearing claim that trends persist “regardless of local environment.”
- [Results (stellar mass distributions)] Results on stellar-mass distributions (including the satellite-central comparison in voids vs. NCNV): Without explicit completeness corrections, search radius/velocity criteria for companions, or error propagation on the reported mass offsets, it is unclear whether the lower masses in voids could arise from residual local-density leakage or selection biases rather than a genuine large-scale halo effect.
- [Discussion/Conclusion] Discussion/conclusion: The inference that “the properties of these halos are related to their large-scale environment” is interpretive; the manuscript provides no direct halo-mass proxies, simulation comparisons, or falsifiable predictions, so the support for the assembly scenario rests entirely on the observed mass and morphology trends whose robustness is questioned above.
minor comments (3)
- [Abstract and §2] The abstract states the sample was “curated to avoid morphology incompleteness” but provides no quantitative details on the cuts; the main text should specify the exact criteria and any resulting bias on early-type fractions.
- [Figures and tables] Figure captions and tables should report bin-by-bin sample sizes and the precise definition of “early-type” vs. “late-type” (e.g., concentration index threshold or visual classification scheme).
- [Abstract] The acronym NCNV is used without an explicit first-use expansion in the abstract; a parenthetical definition would improve readability.
Simulated Author's Rebuttal
We thank the referee for the constructive and detailed report. We address each major comment point by point below, indicating where revisions will be made to improve clarity and robustness.
read point-by-point responses
-
Referee: §2 (LSS classification): The void/cluster/NCNV assignment method is described only at a high level; no quantitative tests (e.g., mock catalogs, variation of density thresholds, or redshift-slice stability checks) are presented to demonstrate that the labels remain distinct from local companion status after accounting for redshift-space distortions and projection effects in the narrow 0.02 < z ≤ 0.04 volume. This directly affects the load-bearing claim that trends persist “regardless of local environment.”
Authors: We agree that additional quantitative validation would strengthen the LSS classification section. Our classification follows established density-field methods applied to the narrow redshift slice, with voids and clusters defined via standard under/over-density thresholds and NCNV as the intermediate regime; local companions are identified separately via a friends-of-friends algorithm using projected separation and line-of-sight velocity cuts. In the revised manuscript we will expand §2 with explicit threshold values, a brief stability test by varying the density cut by ±10%, and a short discussion of why projection and RSD effects are minimized at these low redshifts. Full mock-catalog tests lie beyond the scope of the current observational analysis but will be noted as a desirable extension. revision: partial
-
Referee: Results on stellar-mass distributions (including the satellite-central comparison in voids vs. NCNV): Without explicit completeness corrections, search radius/velocity criteria for companions, or error propagation on the reported mass offsets, it is unclear whether the lower masses in voids could arise from residual local-density leakage or selection biases rather than a genuine large-scale halo effect.
Authors: We accept that these methodological details require explicit documentation. The log M*/M⊙ ≥ 9.5 cut ensures volume completeness across the surveyed volume, and companion searches employ fixed criteria (projected radius 100 kpc, velocity difference 500 km s⁻¹). In the revision we will add a dedicated paragraph on completeness as a function of mass and environment, state the exact search parameters, and report bootstrap-derived uncertainties on the median mass offsets. The persistence of the void mass deficit across both singlets and multiplets already argues against simple local-density leakage, but the added material will make this case more quantitative. revision: yes
-
Referee: Discussion/conclusion: The inference that “the properties of these halos are related to their large-scale environment” is interpretive; the manuscript provides no direct halo-mass proxies, simulation comparisons, or falsifiable predictions, so the support for the assembly scenario rests entirely on the observed mass and morphology trends whose robustness is questioned above.
Authors: We acknowledge that the halo-LSS connection is an interpretive step based on stellar mass as a halo-mass proxy. The manuscript is purely observational and contains no new simulations or direct halo-mass estimates. In the revised discussion we will rephrase the relevant sentences to present the scenario as a plausible interpretation consistent with the data and with existing assembly-bias literature, rather than a definitive claim. We will also insert citations to simulation studies that report analogous halo-environment correlations, thereby providing context for future falsifiable tests. revision: yes
Circularity Check
No circularity: purely empirical observational analysis
full rationale
This paper performs a purely observational study by classifying 25309 galaxies from catalog data into LSS categories (voids, clusters, NCNV) and local environments (singlets vs. multiplets), then directly comparing their stellar mass and morphology distributions. No equations, model fits, parameter predictions, or derivations are present that could reduce outputs to inputs by construction. The conclusions follow from straightforward empirical fractions and trends without self-referential steps, self-citation chains, or ansatzes. The analysis is self-contained against external benchmarks as it reports raw observed distributions.
Assumptions & free parameters
assumptions (2)
- domain assumption Galaxies can be reliably classified into voids, clusters, and NCNV using large-scale density fields in the local universe.
- domain assumption Stellar mass and morphological type can be measured consistently for galaxies with log M_star/M_sun >= 9.5 in the given redshift range.
Cite this review
Pith. "Pith review of Stellar mass and morphology segregation in pairs and multiplets in the cosmic web." pith.science (2026). https://pith.science/paper/2605.00982
@misc{pith2026260500982,
  author       = {Pith},
  title        = {Pith review of: Stellar mass and morphology segregation in pairs and multiplets in the cosmic web},
  year         = {2026},
  howpublished = {\url{https://pith.science/paper/2605.00982}},
  note         = {Machine review of arXiv:2605.00982}
}
abstract
In this work, we investigate whether the location of galaxies within the large-scale structures (LSS) of the Universe affects their stellar mass ($M_\star$) and morphology. To this end, we attempt to disentangle the effects of local and large-scale environments in their distributions. We classify 25309 galaxies in the redshift range ${0.02 < z \leq 0.04}$ with $\log M_\star/\rm{M}_\odot \geq 9.5$ in terms of the main LSS (voids, clusters, and not clusters nor voids, referred to as NCNV) and local environment (singlets and multiplets; galaxies with and without companions). We present the stellar mass and morphology distributions in these environments, and for a subsample of galaxy pairs. Even in voids, we find that $\sim22\%$ of galaxies have companions. Stellar mass distributions show that galaxies are less massive in voids, regardless of their local environment. Satellites in voids are, too, less massive relative to their centrals than in NCNV pairs. In terms of morphology, the denser the LSS, the greater is the proportion of early-type galaxies, even among singlets. In voids and NCNV, late-type multiplets tend to be later-type spirals than singlets. In pairs, centrals tend to be more early-type than satellites. The sample, curated to avoid morphology incompleteness, yields slightly higher fractions of early-type galaxies and multiplets than previous studies. We conclude that the local environment alone is insufficient to explain the distribution of stellar mass and the morphology of galaxies in the local Universe. The observed mass distributions support a scenario in which galaxy assembly depends critically on the host halos, and the properties of these halos are related to their large-scale environment. This would explain the finding of lower-mass galaxies in voids than in denser environments, and provide a basis for considering a common evolutionary origin for multiplets.
Figures

Figures from the paper (5 more)



Forward citations
Cited by 2 Pith papers
-
ALMA CO-CAVITY II. Resolved Scaling Relations in Void Galaxies
In void galaxies, the resolved relation between molecular gas and stellar mass is the tightest of the three star-formation scaling relations, with 0.16 dex scatter.
-
Galaxy groups within voids
Voids contain mostly single galaxies (59%) and small loose groups (max 6 members) that show early evolutionary stages with no richness dependence on void density.
Reference graph
Works this paper leans on
-
[1]
Abazajian, K. N., Adelman-McCarthy, J. K., Agüeros, M. A., et al. 2009, ApJS, 182, 543
work page 2009
-
[2]
O., Corwin, Harold G., J., & Olowin, R
Abell, G. O., Corwin, Harold G., J., & Olowin, R. P. 1989, ApJS, 70, 1
work page 1989
-
[3]
Alam, S., Albareti, F. D., Allende Prieto, C., et al. 2015, ApJS, 219, 12
work page 2015
-
[4]
Alfaro, I. G., Rodriguez, F., Ruiz, A. N., & Lambas, D. G. 2020, A&A, 638, A60 Argudo-Fernández, M., Duarte Puertas, S., Ruiz, J. E., et al. 2017, PASP, 129, 058005 Argudo-Fernández, M., Gómez Hernández, C., Verley, S., et al. 2024, A&A, 692, A258 Argudo-Fernández, M., Torres-Ríos, G., Vásquez-Bustos, P., et al. 2026, A&A, submitted Argudo-Fernández, M., ...
work page 2020
-
[5]
C., Zehavi, I., Contreras, S., & Norberg, P
Artale, M. C., Zehavi, I., Contreras, S., & Norberg, P. 2018, MNRAS, 480, 3978 Astropy Collaboration, Price-Whelan, A. M., Lim, P. L., et al. 2022, ApJ, 935, 167 Astropy Collaboration, Price-Whelan, A. M., Sip˝ocz, B. M., et al. 2018, AJ, 156, 123 Astropy Collaboration, Robitaille, T. P., Tollerud, E. J., et al. 2013, A&A, 558, A33
work page 2018
-
[6]
Balogh, M. L., Morris, S. L., Yee, H. K. C., Carlberg, R. G., & Ellingson, E. 1999, ApJ, 527, 54
work page 1999
-
[7]
Bialas, D., Lisker, T., Olczak, C., Spurzem, R., & Kotulla, R. 2015, A&A, 576, A103
work page 2015
-
[8]
Bidaran, B., de Daniloff, S., Pérez, I., et al. 2025, A&A, 698, A260
work page 2025
Show all 62 references
-
[9]
R., Kofman, L., & Pogosyan, D
Bond, J. R., Kofman, L., & Pogosyan, D. 1996, Nature, 380, 603
1996
-
[10]
2024, MNRAS, 529, 2595
Bulichi, T.-E., Davé, R., & Kraljic, K. 2024, MNRAS, 529, 2595
2024
-
[11]
& Oemler, Jr., A
Butcher, H. & Oemler, Jr., A. 1984, ApJ, 285, 426
1984
-
[12]
2022, A&A, 657, A9
Castignani, G., Combes, F., Jablonka, P., et al. 2022, A&A, 657, A9
2022
-
[13]
Cautun, M., van de Weygaert, R., Jones, B. J. T., & Frenk, C. S. 2014, MNRAS, 441, 2923
2014
-
[14]
2017, MNRAS, 466, 1880
Chen, Y .-C., Ho, S., Mandelbaum, R., et al. 2017, MNRAS, 466, 1880
2017
-
[15]
Davies, L. J. M., Robotham, A. S. G., Driver, S. P., et al. 2015, MNRAS, 452, 616
2015
-
[16]
Davies, L. J. M., Robotham, A. S. G., Lagos, C. d. P., et al. 2019, MNRAS, 483, 5444 Domínguez-Gómez, J., Pérez, I., Ruiz-Lara, T., et al. 2023, Nature, 619, 269 Domínguez Sánchez, H., Huertas-Company, M., Bernardi, M., Tuccillo, D., &
2019
-
[17]
Fischer, J. L. 2018, MNRAS, 476, 3661
2018
-
[18]
1980, ApJ, 236, 351
Dressler, A. 1980, ApJ, 236, 351
1980
-
[19]
V ., Alonso, S., & Galdeano, D
Duplancic, F., Dávila-Kurbán, F., Coldwell, G. V ., Alonso, S., & Galdeano, D. 2020, MNRAS, 493, 1818
2020
-
[20]
2011, A&A, 531, A75 2 http://www.astropy.org 3 https://github.com/jupyterlab/jupyterlab 4 http://www.sdss.org/ 5 http://www.sdss3.org/
Einasto, J., Hütsi, G., Saar, E., et al. 2011, A&A, 531, A75 2 http://www.astropy.org 3 https://github.com/jupyterlab/jupyterlab 4 http://www.sdss.org/ 5 http://www.sdss3.org/
2011
-
[21]
2022, A&A, 668, A69
Einasto, M., Kipper, R., Tenjes, P., et al. 2022, A&A, 668, A69
2022
-
[22]
L., Patton, D
Ellison, S. L., Patton, D. R., Simard, L., & McConnachie, A. W. 2008, AJ, 135, 1877
2008
-
[23]
L., Patton, D
Ellison, S. L., Patton, D. R., Simard, L., et al. 2010, MNRAS, 407, 1514
2010
-
[24]
A., Kannappan, S
Florez, J., Berlind, A. A., Kannappan, S. J., et al. 2021, ApJ, 906, 97
2021
-
[25]
Gao, L., Springel, V ., & White, S. D. M. 2005, MNRAS, 363, L66 García-Benito, R., Jiménez, A., Sánchez-Menguiano, L., et al. 2024, A&A, 691, A161
2005
-
[26]
2003, MNRAS, 346, 601
Goto, T., Yamauchi, C., Fujita, Y ., et al. 2003, MNRAS, 346, 601
2003
-
[27]
M., & Dekel, A
Hahn, O., Porciani, C., Carollo, C. M., & Dekel, A. 2007, MNRAS, 375, 489
2007
-
[28]
R., Millman, K
Harris, C. R., Millman, K. J., van der Walt, S. J., et al. 2020, Nature, 585, 357
2020
-
[29]
& V ogeley, M
Hoyle, F. & V ogeley, M. S. 2002, ApJ, 566, 641
2002
-
[30]
Hunter, J. D. 2007, Computing in Science & Engineering, 9, 90
2007
-
[31]
M., White, S
Kauffmann, G., Heckman, T. M., White, S. D. M., et al. 2003, MNRAS, 341, 33
2003
-
[32]
E., et al
Kaviraj, S., Lazar, I., Watkins, A. E., et al. 2025, MNRAS, 538, 153
2025
-
[33]
2018, MNRAS, 474, 547
Kraljic, K., Arnouts, S., Pichon, C., et al. 2018, MNRAS, 474, 547
2018
-
[34]
A., et al
Kreckel, K., Platen, E., Aragón-Calvo, M. A., et al. 2012, AJ, 144, 16
2012
-
[35]
2020, A&A, 639, A71
Kuutma, T., Poudel, A., Einasto, M., et al. 2020, A&A, 639, A71
2020
-
[36]
2017, A&A, 600, L6
Kuutma, T., Tamm, A., & Tempel, E. 2017, A&A, 600, L6
2017
-
[37]
I., van de Weygaert, R., Cautun, M., et al
Libeskind, N. I., van de Weygaert, R., Cautun, M., et al. 2018, MNRAS, 473, 1195 Martínez, H. J., Muriel, H., & Coenda, V . 2016, MNRAS, 455, 127
2018
-
[38]
2005, MNRAS, 364, 607
Mastropietro, C., Moore, B., Mayer, L., et al. 2005, MNRAS, 364, 607
2005
-
[39]
1996, Nature, 379, 613 O’Kane, C
Moore, B., Katz, N., Lake, G., Dressler, A., & Oemler, A. 1996, Nature, 379, 613 O’Kane, C. J., Kuchner, U., Gray, M. E., & Aragón-Salamanca, A. 2024, MN- RAS, 534, 1682
1996
-
[40]
C., V ogeley, M
Pan, D. C., V ogeley, M. S., Hoyle, F., Choi, Y .-Y ., & Park, C. 2012, MNRAS, 421, 926
2012
-
[41]
S., et al
Park, C., Choi, Y .-Y ., V ogeley, M. S., et al. 2007, ApJ, 658, 898
2007
-
[42]
R., Carlberg, R
Patton, D. R., Carlberg, R. G., Marzke, R. O., et al. 2000, ApJ, 536, 153
2000
-
[43]
R., Ellison, S
Patton, D. R., Ellison, S. L., Simard, L., McConnachie, A. W., & Mendel, J. T. 2011, MNRAS, 412, 591
2011
-
[44]
R., Torrey, P., Ellison, S
Patton, D. R., Torrey, P., Ellison, S. L., Mendel, J. T., & Scudder, J. M. 2013, MNRAS, 433, L59
2013
-
[45]
Peebles, P. J. E. 1980, The large-scale structure of the universe Pérez, I., Gil, L., Ferré-Mateu, A., et al. 2025, A&A, 695, A84 Pérez, I., Verley, S., Sánchez-Menguiano, L., et al. 2024, A&A, 689, A213 Rodríguez-Medrano, A. M., Paz, D. J., Stasyszyn, F. A., et al. 2023, MNRA...
1980
-
[46]
R., V ogeley, M
Rojas, R. R., V ogeley, M. S., Hoyle, F., & Brinkmann, J. 2004, ApJ, 617, 50
2004
-
[47]
R., V ogeley, M
Rojas, R. R., V ogeley, M. S., Hoyle, F., & Brinkmann, J. 2005, ApJ, 624, 571
2005
-
[48]
Rosas-Guevara, Y ., Tissera, P., Lagos, C. d. P., Paillas, E., & Padilla, N. 2022, MNRAS, 517, 712
2022
-
[49]
M., Charlot, S., et al
Salim, S., Rich, R. M., Charlot, S., et al. 2007, ApJS, 173, 267
2007
-
[50]
M., Ellison, S
Scudder, J. M., Ellison, S. L., Torrey, P., Patton, D. R., & Mendel, J. T. 2012, MNRAS, 426, 549
2012
-
[51]
A., Weinberg, D
Strauss, M. A., Weinberg, D. H., Lupton, R. H., et al. 2002, AJ, 124, 1810
2002
-
[52]
M., Daza-Perilla, I
Taverna, A., Salerno, J. M., Daza-Perilla, I. V ., et al. 2023, MNRAS, 520, 6367
2023
-
[53]
Tempel, E., Tago, E., & Liivamägi, L. J. 2012, A&A, 540, A106
2012
-
[54]
Tempel, E., Tuvikene, T., Kipper, R., & Libeskind, N. I. 2017, A&A, 602, A100
2017
-
[55]
A., et al
Tojeiro, R., Eardley, E., Peacock, J. A., et al. 2017, MNRAS, 470, 3720 Torres-Ríos, G., Pérez, I., Verley, S., et al. 2024, A&A, 691, A341
2017
-
[56]
2021, MNRAS, 500, 4469
Trussler, J., Maiolino, R., Maraston, C., et al. 2021, MNRAS, 500, 4469
2021
-
[57]
2019, A&A, 631, A87 Villalobos, Á., De Lucia, G., Borgani, S., & Murante, G
Ventou, E., Contini, T., Bouché, N., et al. 2019, A&A, 631, A87 Villalobos, Á., De Lucia, G., Borgani, S., & Murante, G. 2012, MNRAS, 424, 2401
2019
-
[58]
E., et al
Virtanen, P., Gommers, R., Oliphant, T. E., et al. 2020, Nature Methods, 17, 261
2020
-
[59]
J., van den Bosch, F
Yang, X., Mo, H. J., van den Bosch, F. C., et al. 2007, ApJ, 671, 153
2007
-
[60]
Y ., Abadi, M
Yaryura, C. Y ., Abadi, M. G., Gottlöber, S., et al. 2023, MNRAS, 525, 415
2023
-
[61]
R., Frieman, J
Zehavi, I., Blanton, M. R., Frieman, J. A., et al. 2002, ApJ, 571, 172
2002
-
[62]
2018, ApJ, 853, 84 Zel’dovich, Y
Zehavi, I., Contreras, S., Padilla, N., et al. 2018, ApJ, 853, 84 Zel’dovich, Y . B. 1970, A&A, 5, 84 Article number, page 12 of 15 G. Torres-Ríos, S. Verley et al.: Stellar mass and morphology segregation in pairs and multiplets in the cosmic web Appendix A: The dependence of...
2018
Reviewed May 9, 2026 · model on record in the stance chip above.
Discussion (0). Sign in to comment.