REVIEW 3 major objections 4 minor 1 cited by
Voids found in galaxy groups can stand in for dark-matter halo voids in cosmological analyses, even when only 40% of galaxies have precise redshifts.
Reviewed by Pith at T0; open to challenge. T0 means a machine referee read the full paper against a public rubric. the ladder, T0–T4 →
Group-voids identified from galaxy group catalogs reproduce halo-void size functions and density profiles in CSST mocks above ~40% spectroscopic completeness, with incompleteness at 30% captured by an effective redshift-error parameter.
T0 review reviewed 2026-08-02 challenge →
load-bearing objection Useful CSST group-void calibration, but the 30%-completeness headline relies on a hand-tuned σ0 that is descriptive, not yet predictive. the 3 major comments →
CSST large-scale structure analysis pipeline: IV. Cosmic Voids Identified from Galaxy Group Samples as Probes of the Large-scale Structure
The pith
A machine-rendered reading of the paper's core claim, the machinery that carries it, and where it could break.
The reading
Core claim
The paper's central claim is that group-voids—underdensities traced by galaxy groups rather than individual galaxies—are statistically equivalent to halo-voids for the void size function and stacked void density profile, provided the group catalog has sufficient redshift completeness. In the ideal case of full spectroscopic redshifts, the two statistics agree within 1σ at z<0.8 and for large voids at higher redshift. In a conservative case with partial spectroscopic coverage, agreement holds where spectroscopic completeness is at least 40%; below that, a single free parameter describing a Gaussian redshift error applied to halos (with values 0.005, 0.01, and 0.02 in successive redshift bins)
What carries the argument
The argument rests on four pieces: (1) a halo-based group finder that assigns galaxies to dark matter halos, removing the finger-of-god distortion and stabilizing tracer positions; (2) a watershed-based void finder that identifies underdense zones without assuming a shape and returns volume-weighted centers and effective radii; (3) use of the brightest central galaxy (BCG) as the group center, which improves void-center accuracy when spectroscopic redshifts are sparse; and (4) a parameterization of incompleteness as an effective Gaussian redshift error applied to simulation halos, which the authors show reproduces the group-void size function in each redshift bin.
Load-bearing premise
The load-bearing premise is that the combined effect of incomplete spectroscopy and photometric redshift errors on the group-void size function is exactly equivalent to assigning halos a Gaussian redshift error with a single amplitude per redshift bin; if this equivalence fails at other completeness levels or redshifts, the 30% acceptance claim does not follow.
What would settle it
Run the same group-finder and void-finder on mocks with spectroscopic completeness varying continuously between 20% and 50% while holding everything else fixed, and check whether the best-fit Gaussian redshift error on halos reproduces the group-void size function at every level and in every redshift bin. A break in that mapping—e.g., a sigma0 that cannot be found or that changes abruptly—would disprove the one-parameter equivalence claim.
If this is right
- Group-void size functions and density profiles can be predicted directly from dark-matter-only simulations, making emulator-based cosmological inference feasible without galaxy-formation prescriptions.
- Spectroscopic incompleteness in a survey can be captured by one effective redshift-error parameter per redshift bin, greatly simplifying nuisance-parameter treatment.
- The method extends the usable redshift range and void-size range for void cosmology with partial spectroscopic surveys, because group tracers are less sensitive to individual galaxy redshift errors.
- Using the brightest central galaxy as the void center recovers accurate low-density regions out to z≈0.6 even when only a third of galaxies have precise redshifts.
- The 40% completeness threshold provides a target for survey design: surveys that meet it can use group-voids without extra modeling.
Where Pith is reading between the lines
- The single-redshift-error mapping may also absorb other residual systematics (e.g., group-finder incompleteness, photometric outliers), so the inferred sigma0 values should not be interpreted literally as redshift errors; this can be tested by varying completeness in controlled mocks.
- If the equivalence holds in real data, void statistics from group catalogs could be combined with galaxy-void statistics to cross-check systematics and tighten dark-energy constraints.
- The approach might generalize to other tracer types, such as galaxy clusters or emission-line galaxies, wherever a group/halo correspondence can be established.
- A direct test on a real survey with both photometric and spectroscopic redshifts (like the one the mock emulates) would confirm whether the 30% floor holds outside the mock.
Editorial analysis
A structured set of objections, weighed in public.
Referee Report
Summary. The paper proposes using voids identified in galaxy group catalogs (group-voids) as cosmological probes, arguing that groups are directly linked to dark matter halos and therefore that group-void statistics can be modeled from halo catalogs in simulations, bypassing expensive galaxy-formation modeling. Using the CSST MGRS mock, the authors construct group catalogs in an ideal case (100% spectroscopic redshifts, z_spec) and a conservative case (~30% spectroscopic completeness, z_CSST), identify voids with the VIDE/ZOBOV algorithm, and measure the void size function (VSF) and stacked void density profile in five redshift bins from z=0 to 1. They compare these statistics with halo-voids and further attempt to model the conservative-case VSF by adding a Gaussian redshift error sigma0(1+z) to the halo redshifts, claiming that sigma0=0.005, 0.01, and 0.02 in different redshift bins reproduces the group-void VSF. The central assertion is that group-voids with ≥40% spectroscopic completeness faithfully reproduce halo-void statistics, and that even at 30% completeness the effect can be captured by a single effective redshift-error parameter.
Significance. If fully validated, the proposed group-void approach could significantly simplify void-based cosmological analyses by replacing galaxy-void emulators requiring galform models or HOD/abundance matching with halo-void emulators. The paper uses realistic CSST mock catalogs with a sophisticated slitless-spectroscopy simulation and a well-established group finder, and the ideal-case comparisons (z_spec group-voids vs halo-voids) are a useful sanity check of the pipeline. The density-profile analysis with BCG centers is also a potentially valuable practical improvement. However, the headline claim about 30% completeness rests on a post-hoc, unvalidated effective parameter, and the 40% claim is stronger than the plotted 2-sigma and density-profile evidence supports. With additional formal fitting and out-of-sample validation, the idea could be made compelling.
major comments (3)
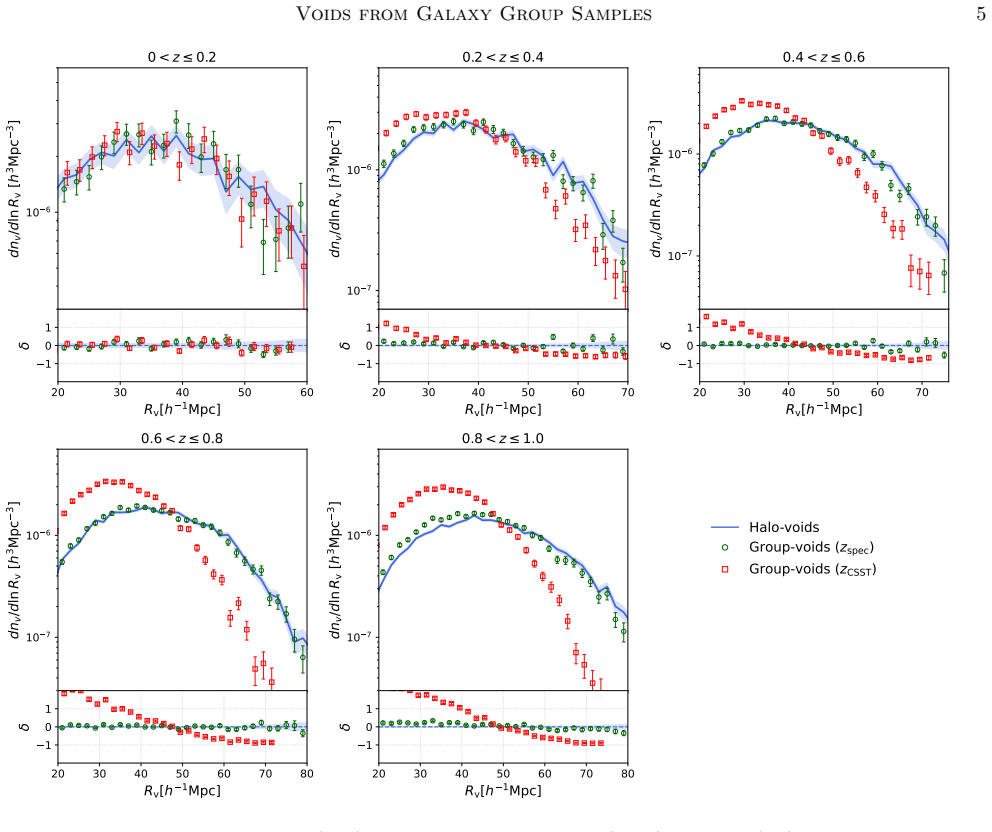
- [Section 3.1 / Figure 3] The effective redshift error sigma0 is chosen per redshift bin (0.005, 0.01, 0.02) by visually matching the halo-void VSF to the group-void z_CSST VSF. No goodness-of-fit statistic, uncertainty on sigma0, or independent test is provided. Because sigma0 is tuned to the exact data it is then claimed to reproduce, the statement in the Abstract and Conclusion that group-voids at 30% completeness can be 'reliably described' via a redshift error term is circular and unsupported. The text itself (Section 3.1) concedes 'We intend to investigate this strategy in future work,' which confirms the model is not yet established. This is load-bearing: the 30% tolerance is a key result. A formal likelihood fit with jackknife covariances and an out-of-sample prediction (e.g., predicting the density profile, or the VSF at an intermediate sigma0/completeness not used in the fit) is needed.
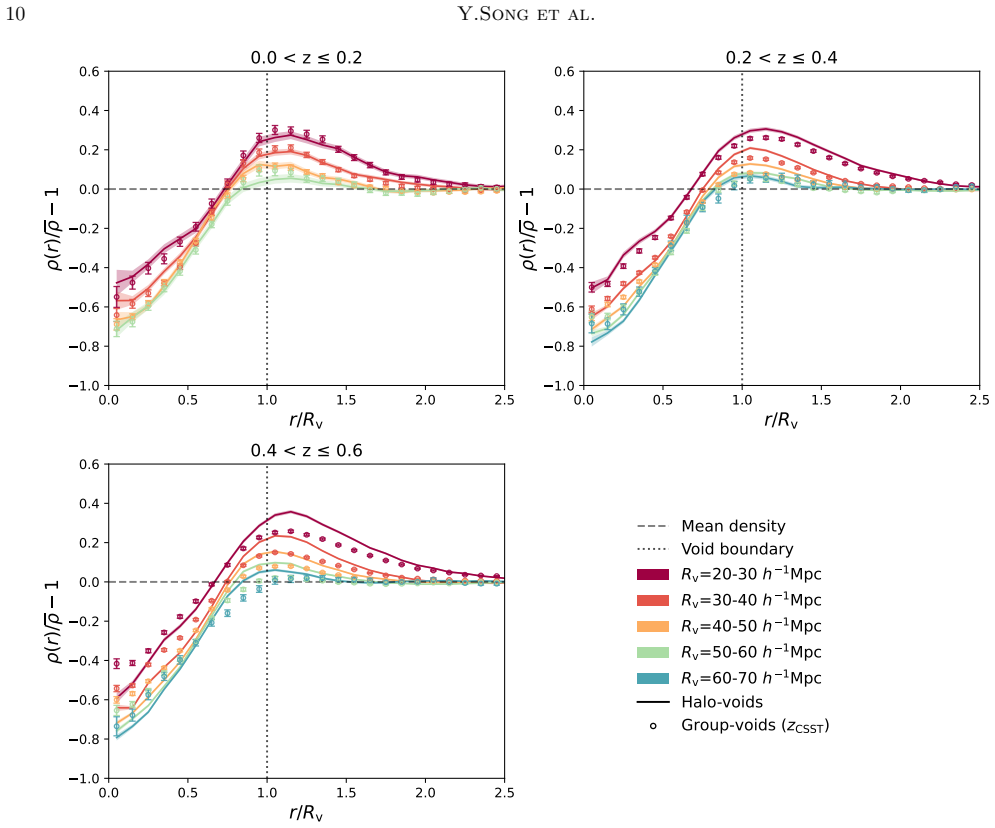
- [Section 4 / Section 3.2 / Figure 6] The conclusion that 'group-voids can reliably represent halo-voids in redshift bins with spectroscopic completeness of 40% or higher' is overstated. In the 0.2<z≤0.4 bin (the 40%-completeness bin), Figure 2 shows agreement only for voids with R_v ≳ 40 h−1Mpc and at the 2-sigma level, not a full 1-sigma match. Moreover, Figure 6 shows that the density profiles from group-voids with z_CSST deviate significantly at z>0.2 unless BCG centers are used; the improvement from BCG is demonstrated only for z≤0.6. Thus the blanket '40% or higher' claim is not uniformly supported by the plotted statistics. The conclusion should be qualified to specify radius range, center choice, and statistic.
- [Section 2 / Overall interpretation] The group-void versus halo-void comparison is partly self-referential by construction: the mock galaxies are placed into subhalos via SHAM, and the group finder assigns halo masses by abundance matching to an assumed HMF. The near-agreement in the ideal case is therefore an expected consistency check of the group finder and SHAM, not an independent empirical validation that group-voids generally trace halo-voids in real surveys. This does not invalidate the practical modeling approach, but it means the claims of 'faithfully reproduce' should be framed as a pipeline validation on mocks rather than an independent discovery, and the paper should discuss how group-finder uncertainties or mass errors in real data might break this agreement.
minor comments (4)
- [Title and text] The title and several headings contain 'V oids' with an apparent space; this is likely a LaTeX/compilation artifact and should be corrected.
- [Figure 3] The caption does not list the exact sigma0 values for each panel in the printed text, relying on the reader to infer from the line styles; please state explicitly (e.g., '0.2<z≤0.4: sigma0=0.005') in the caption.
- [Section 3.1] The relative deviation δ is mentioned in the text and figure subpanels but never defined by an equation. Please define δ explicitly (e.g., δ = (VSF_group − VSF_halo)/VSF_halo) and state how the jackknife errors are propagated into the subpanels.
- [Section 3.1] The number of sigma0 values tested is only three (0.005, 0.01, 0.02), yet the paper states these 'match' the group-void VSF. It would be clearer to describe these as discrete trial values rather than a fit, unless a fitting procedure is actually used.
Circularity Check
Central 30%-completeness claim rests on sigma0 tuned to the same group-void VSF it is then said to describe; the match is by construction rather than a validated prediction.
specific steps
-
fitted input called prediction
[Section 3.1, Figure 3; Abstract; Section 4]
"We apply redshift errors with σ0 = 0.005, 0.01, and 0.02 to the halo catalog, and compare the VSFs of these halo-voids with that of the group-voids from zCSST at z >0.2 in different redshift bins. As shown in Figure 3, the VSFs of halo-voids with σ0 = 0.005, 0.01, and 0.02 match the results of group-voids (zCSST) in the redshift ranges 0.2 < z ≤ 0.4, 0.4 < z ≤ 0.8, and 0.8 < z ≤ 1.0, respectively."
σ0 is chosen post hoc so that the smoothed halo-void VSF lines up with the very zCSST group-void VSF used for the comparison; the agreement is therefore a consequence of the choice, not a prediction. The chosen values are not taken from the catalog's input photo-z error σz=(0.01+0.015z)(1+z), so they are empirical adjustment parameters. No independent redshift bin, completeness level, or void density profile is used to validate the effective-error model. The paper itself defers validation ("We intend to investigate this strategy in future work"), yet the Abstract and Conclusion state that 30% completeness can be reliably described and that the effect is well captured by the redshift error term—restating the fit as a result.
full rationale
The ideal-case comparison (group-voids from zspec vs halo-voids) is a genuine, non-circular consistency test of the group finder: the groups are not assigned the halo positions, and the measured VSF/density-profile agreement is not guaranteed by construction. Nor is there a load-bearing self-citation chain: the Yang et al. group finder and Gu et al. MGRS are tool/mock references, not uniqueness theorems that force the conclusion. The circular component is isolated to the paper's strongest practical claim: that at ~30% spectroscopic completeness, group-voids can be reliably modeled by halo-voids with a Gaussian redshift-error term. That term's amplitude σ0 is selected per redshift bin by matching the same zCSST group-void VSF it is then said to reproduce, so the match in Figure 3 is by construction. Because this calibrated-σ0 step is the only support for the 30% threshold and the abstract's headline statement, the central claim is partially circular. Score 6 reflects partial circularity: one key prediction reduces to a fit, while the 40%-completeness and zspec results retain independent content.
Axiom & Free-Parameter Ledger
free parameters (4)
- sigma0 (effective halo redshift error) =
0.005 for 0.2<z<=0.4; 0.01 for 0.4<z<=0.8; 0.02 for 0.8<z<=1.0
- Photometric redshift error sigma_z =
sigma_z = (0.01+0.015 z_spec)(1+z)
- Void radius threshold =
R_v > 20 h^-1 Mpc
- Density-profile upper radius limits =
60, 70, 70, 80, 80 h^-1 Mpc in the five z-bins
axioms (5)
- domain assumption The extended halo-based group finder (Yang et al. 2021) correctly assigns galaxies to halos and gives centers (luminosity-weighted or BCG) close to true halo centers.
- domain assumption SHAM-based galaxy luminosities and matching to DESI LS DR9 produce a realistic galaxy population for CSST.
- domain assumption VIDE/ZOBOV watershed voids in tracer samples trace the same underdense regions as voids in dark matter.
- ad hoc to paper A Gaussian redshift error of size sigma0(1+z) applied to halos reproduces the VSF change caused by spectroscopic incompleteness and photometric redshift errors.
- domain assumption One realization of the Jiutian simulation box suffices; cosmic variance is not assessed.
Cite this review
Pith. "Pith review of CSST large-scale structure analysis pipeline: IV. Cosmic Voids Identified from Galaxy Group Samples as Probes of the Large-scale Structure." pith.science (2026). https://pith.science/paper/CIZKUEXP
@misc{pith2026260601907,
  author       = {Pith},
  title        = {Pith review of: CSST large-scale structure analysis pipeline: IV. Cosmic Voids Identified from Galaxy Group Samples as Probes of the Large-scale Structure},
  year         = {2026},
  howpublished = {\url{https://pith.science/paper/CIZKUEXP}},
  note         = {Machine review of arXiv:2606.01907}
}
read the original abstract
Because groups are directly associated with halos, they allow for considerably simpler theoretical modeling than approaches based on individual galaxies. We therefore propose to use voids identified in galaxy group catalogs, referred to as group-voids, to investigate the cosmic large-scale structure (LSS). Using the reference mock galaxy redshift survey (MGRS) designed for the Chinese Space-station Survey Telescope (CSST), we build two galaxy group catalogs representing ideal and realistic scenarios, derived from galaxy samples with 100\% and roughly 30\% spectroscopic redshift completeness, respectively. We then identify voids in these two mock group catalogs, as well as in the underlying halo catalog, and measure two void statistics, the void size function (VSF) and the void density profile, within five redshift intervals spanning $z=0$ to $1.0$. We compare the statistics obtained from two kinds of voids: those defined by galaxy groups (group-voids) and those defined by dark matter halos (halo-voids). In the void-finding process, we adopt the brightest central galaxy (BCG) as the group center to improve the accuracy of the inferred void centers. Our analysis shows that void statistics derived from group-voids with spectroscopic redshift completeness of at least 40\% can faithfully reproduce the corresponding statistics from halo-voids. Even when the redshift completeness of galaxies falls to as low as 30\%, we can still reliably describe group-voids via halo-voids by incorporating a redshift error term. This indicates that group-voids are a promising tool for probing LSS and offer a valuable complement to standard void studies, which is especially advantageous for emulator-based methods.
Figures




Forward citations
Cited by 1 Pith paper
-
Quantifying Environmental Effects on Galaxy Properties using Non-spherical Voids Identified from SDSS DR7
Void galaxies identified by local volume in non-spherical voids are bluer and more star-forming than non-void galaxies, with the environmental effect decreasing with stellar mass.
Reference graph
Works this paper leans on
-
[1]
2022, MNRAS, 513, 186, doi: 10.1093/mnras/stac828
Aubert, M., Cousinou, M.-C., Escoffier, S., et al. 2022, MNRAS, 513, 186, doi: 10.1093/mnras/stac828
-
[2]
2023, A&A, 670, A47, doi: 10.1051/0004-6361/202244445
Bonici, M., Carbone, C., Davini, S., et al. 2023, A&A, 670, A47, doi: 10.1051/0004-6361/202244445
-
[3]
Cai, Y.-C., Taylor, A., Peacock, J. A., & Padilla, N. 2016, MNRAS, 462, 2465, doi: 10.1093/mnras/stw1809
-
[4]
2018, MNRAS, 476, 3195, doi: 10.1093/mnras/sty463
Cautun, M., Paillas, E., Cai, Y.-C., et al. 2018, MNRAS, 476, 3195, doi: 10.1093/mnras/sty463
-
[5]
2021, MNRAS, 504, 5021, doi: 10.1093/mnras/stab1112
Contarini, S., Marulli, F., Moscardini, L., et al. 2021, MNRAS, 504, 5021, doi: 10.1093/mnras/stab1112
-
[6]
2023, ApJ, 953, 46, doi: 10.3847/1538-4357/acde54 —
Contarini, S., Pisani, A., Hamaus, N., et al. 2023, ApJ, 953, 46, doi: 10.3847/1538-4357/acde54 —. 2024, A&A, 682, A20, doi: 10.1051/0004-6361/202347572
-
[7]
2019, MNRAS, 488, 3526, doi: 10.1093/mnras/stz1989
Contarini, S., Ronconi, T., Marulli, F., et al. 2019, MNRAS, 488, 3526, doi: 10.1093/mnras/stz1989
-
[8]
2022, A&A, 667, A162, doi: 10.1051/0004-6361/202244095
Contarini, S., Verza, G., Pisani, A., et al. 2022, A&A, 667, A162, doi: 10.1051/0004-6361/202244095
-
[9]
Correa, C. M., Paz, D. J., S´ anchez, A. G., et al. 2021, MNRAS, 500, 911, doi: 10.1093/mnras/staa3252 CSST Collaboration, Gong, Y., Miao, H., et al. 2026, Science China Physics, Mechanics, and Astronomy, 69, 239501, doi: 10.1007/s11433-025-2809-0 DESI Collaboration, Aghamousa, A., Aguilar, J., et al. 2016, arXiv e-prints, arXiv:1611.00036, doi: 10.48550/...
-
[10]
2022, The Journal of Open Source Software, 7, 4033, doi: 10.21105/joss.04033
Douglass, K., Veyrat, D., O’Neill, S., et al. 2022, The Journal of Open Source Software, 7, 4033, doi: 10.21105/joss.04033
-
[11]
2019, ApJ, 883, 203, doi: 10.3847/1538-4357/ab391e
Gong, Y., Liu, X., Cao, Y., et al. 2019, ApJ, 883, 203, doi: 10.3847/1538-4357/ab391e
-
[12]
2025, Science China
Gong, Y., Miao, H., Zhou, X., et al. 2025, Science China
2025
-
[13]
Physics, Mechanics, and Astronomy, 68, 280402, doi: 10.1007/s11433-025-2646-2
-
[14]
2024, MNRAS, 529, 4015, doi: 10.1093/mnras/stae762
Gu, Y., Yang, X., Han, J., et al. 2024, MNRAS, 529, 4015, doi: 10.1093/mnras/stae762
-
[15]
2022, A&A, 658, A20, doi: 10.1051/0004-6361/202142073
Hamaus, N., Aubert, M., Pisani, A., et al. 2022, A&A, 658, A20, doi: 10.1051/0004-6361/202142073
-
[16]
2025, Science China
Han, J., Li, M., Jiang, W., et al. 2025, Science China
2025
-
[17]
Physics, Mechanics, and Astronomy, 68, 109511, doi: 10.1007/s11433-025-2712-1
-
[18]
Mauland, R., Elgarøy, Ø., Mota, D. F., & Winther, H. A. 2023, A&A, 674, A185, doi: 10.1051/0004-6361/202346287 12Y.Song et al. 0.0 0.5 1.0 1.5 2.0 2.5 r/Rv 1.0 0.8 0.6 0.4 0.2 0.0 0.2 0.4 0.6 (r)/ 1 0.0 < z 0.2 0.0 0.5 1.0 1.5 2.0 2.5 r/Rv 1.0 0.8 0.6 0.4 0.2 0.0 0.2 0.4 0.6 (r)/ 1 0.2 < z 0.4 0.0 0.5 1.0 1.5 2.0 2.5 r/Rv 1.0 0.8 0.6 0.4 0.2 0.0 0.2 0.4 0...
-
[19]
2023, MNRAS, 519, 1132, doi: 10.1093/mnras/stac3583
Miao, H., Gong, Y., Chen, X., et al. 2023, MNRAS, 519, 1132, doi: 10.1093/mnras/stac3583
-
[20]
Nadathur, S., Carter, P. M., Percival, W. J., Winther, H. A., & Bautista, J. E. 2019, PhRvD, 100, 023504, doi: 10.1103/PhysRevD.100.023504
-
[21]
Nadathur, S., & Percival, W. J. 2019, MNRAS, 483, 3472, doi: 10.1093/mnras/sty3372
-
[22]
Neyrinck, M. C. 2008, MNRAS, 386, 2101, doi: 10.1111/j.1365-2966.2008.13180.x
arXiv 2008
-
[23]
2023, MNRAS, 522, 152, doi: 10.1093/mnras/stad956
Pelliciari, D., Contarini, S., Marulli, F., et al. 2023, MNRAS, 522, 152, doi: 10.1093/mnras/stad956
-
[24]
2026, arXiv e-prints, arXiv:2601.03883, doi: 10.48550/arXiv.2601.03883
Peng, H., Yu, Y., Guo, Y., et al. 2026, arXiv e-prints, arXiv:2601.03883, doi: 10.48550/arXiv.2601.03883
-
[25]
Pisani, A., Sutter, P. M., Hamaus, N., et al. 2015, PhRvD, 92, 083531, doi: 10.1103/PhysRevD.92.083531 Planck Collaboration, Aghanim, N., Akrami, Y., et al. 2020, A&A, 641, A6, doi: 10.1051/0004-6361/201833910
-
[26]
Platen, E., van de Weygaert, R., & Jones, B. J. T. 2007, MNRAS, 380, 551, doi: 10.1111/j.1365-2966.2007.12125.x
arXiv 2007
-
[27]
2017, MNRAS, 469, 787, doi: 10.1093/mnras/stx785
Pollina, G., Hamaus, N., Dolag, K., et al. 2017, MNRAS, 469, 787, doi: 10.1093/mnras/stx785
-
[28]
2019, MNRAS, 487, 2836, doi: 10.1093/mnras/stz1470 Radinovi´ c, S., Winther, H
Pollina, G., Hamaus, N., Paech, K., et al. 2019, MNRAS, 487, 2836, doi: 10.1093/mnras/stz1470 Radinovi´ c, S., Winther, H. A., Nadathur, S., et al. 2024, A&A, 691, A39, doi: 10.1051/0004-6361/202451358 Radinovi´ c, S., Nadathur, S., Winther, H. A., et al. 2023, A&A, 677, A78, doi: 10.1051/0004-6361/202346121
-
[29]
2019, MNRAS, 488, 5075, doi: 10.1093/mnras/stz2115 S´ anchez, C., Clampitt, J., Kovacs, A., et al
Moscardini, L. 2019, MNRAS, 488, 5075, doi: 10.1093/mnras/stz2115 S´ anchez, C., Clampitt, J., Kovacs, A., et al. 2017, MNRAS, 465, 746, doi: 10.1093/mnras/stw2745
-
[30]
2016, ApJ, 833, 241, doi: 10.3847/1538-4357/833/2/241 —
Shi, F., Yang, X., Wang, H., et al. 2016, ApJ, 833, 241, doi: 10.3847/1538-4357/833/2/241 —. 2018, ApJ, 861, 137, doi: 10.3847/1538-4357/aacb20
-
[31]
2025a, MNRAS, 538, 114, doi: 10.1093/mnras/staf305
Song, Y., Gong, Y., Xiong, Q., et al. 2025a, MNRAS, 538, 114, doi: 10.1093/mnras/staf305
-
[32]
2025b, MNRAS, 540, 2853, doi: 10.1093/mnras/staf918
Song, Y., Gong, Y., Zhou, X., et al. 2025b, MNRAS, 540, 2853, doi: 10.1093/mnras/staf918
-
[33]
2024a, MNRAS, 534, 128, doi: 10.1093/mnras/stae2094 —
Song, Y., Xiong, Q., Gong, Y., et al. 2024a, MNRAS, 534, 128, doi: 10.1093/mnras/stae2094 —. 2024b, MNRAS, 532, 1049, doi: 10.1093/mnras/stae1575 —. 2024c, ApJ, 976, 244, doi: 10.3847/1538-4357/ad8de9
-
[34]
2025, MNRAS, 538, 395, doi: 10.1093/mnras/staf304
Sui, J., Zou, H., Yang, X., et al. 2025, MNRAS, 538, 395, doi: 10.1093/mnras/staf304
-
[35]
M., Lavaux, G., Hamaus, N., et al
Sutter, P. M., Lavaux, G., Hamaus, N., et al. 2015, Astronomy and Computing, 9, 1, doi: 10.1016/j.ascom.2014.10.002
-
[36]
2024, ApJ, 969, 89, doi: 10.3847/1538-4357/ad434e
Thiele, L., Massara, E., Pisani, A., et al. 2024, ApJ, 969, 89, doi: 10.3847/1538-4357/ad434e
-
[37]
2024, JCAP, 2024, 079, doi: 10.1088/1475-7516/2024/10/079
Matarrese, S. 2024, JCAP, 2024, 079, doi: 10.1088/1475-7516/2024/10/079
-
[38]
2025, ApJ, 993, 227, doi: 10.3847/1538-4357/ae07d9
Verza, G., Degni, G., Pisani, A., et al. 2025, ApJ, 993, 227, doi: 10.3847/1538-4357/ae07d9
-
[39]
2023, JCAP, 2023, 010, doi: 10.1088/1475-7516/2023/08/010
Baccigalupi, C. 2023, JCAP, 2023, 010, doi: 10.1088/1475-7516/2023/08/010
-
[40]
2021, MNRAS, 500, 464, doi: 10.1093/mnras/staa3231
Vielzeuf, P., Kov´ acs, A., Demirbozan, U., et al. 2021, MNRAS, 500, 464, doi: 10.1093/mnras/staa3231
-
[41]
2022, ApJ, 936, 161, doi: 10.3847/1538-4357/ac8986
Wang, J., Yang, X., Zhang, J., et al. 2022, ApJ, 936, 161, doi: 10.3847/1538-4357/ac8986
-
[42]
Wechsler, R. H., & Tinker, J. L. 2018, ARA&A, 56, 435, doi: 10.1146/annurev-astro-081817-051756
-
[43]
Wen, R., Zheng, X. Z., Han, Y., et al. 2024, MNRAS, 528, 2770, doi: 10.1093/mnras/stae157
-
[44]
Woodfinden, A., Nadathur, S., Percival, W. J., et al. 2022, MNRAS, 516, 4307, doi: 10.1093/mnras/stac2475
-
[45]
Yang, X., Mo, H. J., van den Bosch, F. C., & Jing, Y. P. 2005, MNRAS, 356, 1293, doi: 10.1111/j.1365-2966.2005.08560.x
arXiv 2005
-
[46]
Yang, X., Mo, H. J., van den Bosch, F. C., et al. 2007, ApJ, 671, 153, doi: 10.1086/522027
doi:10.1086/522027 2007
-
[47]
2012, ApJ, 752, 41, doi: 10.1088/0004-637X/752/1/41
Han, J. 2012, ApJ, 752, 41, doi: 10.1088/0004-637X/752/1/41
-
[48]
2021, ApJ, 909, 143, doi: 10.3847/1538-4357/abddb2
Yang, X., Xu, H., He, M., et al. 2021, ApJ, 909, 143, doi: 10.3847/1538-4357/abddb2
-
[49]
2021, Chinese Science Bulletin, 66, 1290, doi: 10.1360/TB-2021-0016
Zhan, H. 2021, Chinese Science Bulletin, 66, 1290, doi: 10.1360/TB-2021-0016
-
[50]
2025, MNRAS, 539, 1692, doi: 10.1093/mnras/staf611
Zhang, Y., Yang, X., Guo, H., Wang, P., & Shi, F. 2025, MNRAS, 539, 1692, doi: 10.1093/mnras/staf611
-
[51]
Zhou, R., Newman, J. A., Mao, Y.-Y., et al. 2021, MNRAS, 501, 3309, doi: 10.1093/mnras/staa3764
-
[52]
2024, ApJ, 977, 69, doi: 10.3847/1538-4357/ad8bbf
Zhou, X., Gong, Y., Zhang, X., et al. 2024, ApJ, 977, 69, doi: 10.3847/1538-4357/ad8bbf
This paper was first reviewed by deepseek-v4-flash on August 2, 2026.
discussion (0)
Sign in with ORCID, Apple, or X to comment. Anyone can read and Pith papers without signing in.