Statistical Estimation and Correction of Model-Measurement Bias in Time-Dependent Correction Factors of KAGRA
Pith reviewed 2026-06-27 15:21 UTC · model grok-4.3
The pith
A statistical framework estimates and corrects model-measurement bias in time-dependent correction factors for KAGRA calibration.
A machine-rendered reading of the paper's core claim, the machinery that carries it, and where it could break.
Core claim
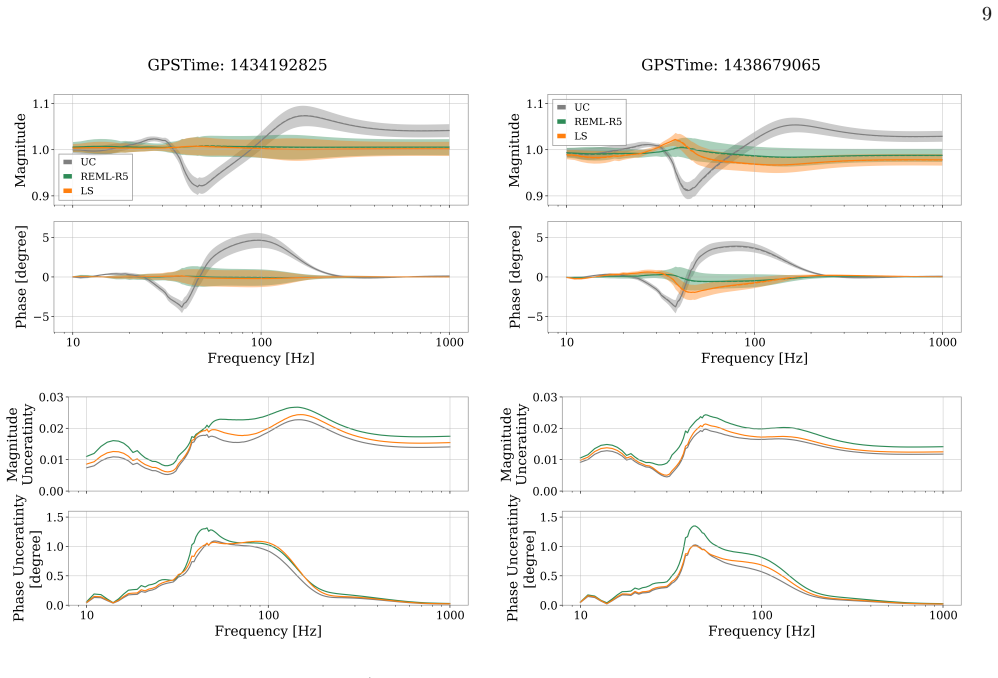
The authors propose a statistical framework to estimate and correct bias between the measured transfer function and the reference model using repeated measurement-to-model ratios at calibration-line frequencies. The bias correction factors are estimated with a rolling random-effects model based on restricted maximum likelihood and incorporated into the TDCF estimation, with their uncertainty propagated to the reconstructed response. When applied to KAGRA O4c data, the uncorrected response shows deviations of up to approximately 7 percent in magnitude and 5 degrees in phase relative to the SSCM-based reference, and the correction reduces these deviations with only a modest increase in propaga
What carries the argument
Rolling random-effects model based on restricted maximum likelihood applied to repeated measurement-to-model ratios at calibration-line frequencies to estimate bias correction factors for TDCFs.
If this is right
- Uncorrected TDCFs introduce systematic deviations of up to 7 percent in magnitude and 5 degrees in phase from the SSCM-based reference.
- Incorporating the estimated bias correction factors reduces those deviations in the reconstructed strain.
- The uncertainty on the final response increases modestly once the uncertainty from the correction factors is included.
- The framework allows calibration-line tracking to be combined with broadband reference models even when model-measurement bias exists.
Where Pith is reading between the lines
- The same rolling random-effects approach could be tested on data from other ground-based detectors that use similar calibration-line and SSCM procedures.
- If the bias varies slowly over time, the rolling window length could be tuned to balance responsiveness against estimation stability.
- Extending the model to include frequency-dependent bias terms beyond the discrete line frequencies would be a direct next step if residuals remain after correction.
Load-bearing premise
The bias observed between measurements and the reference model at calibration-line frequencies is representative of the bias across the full detector response.
What would settle it
An independent broadband measurement at frequencies away from the calibration lines that shows the corrected response still deviates from the SSCM reference by more than the propagated uncertainty would falsify the central claim.
Figures

read the original abstract
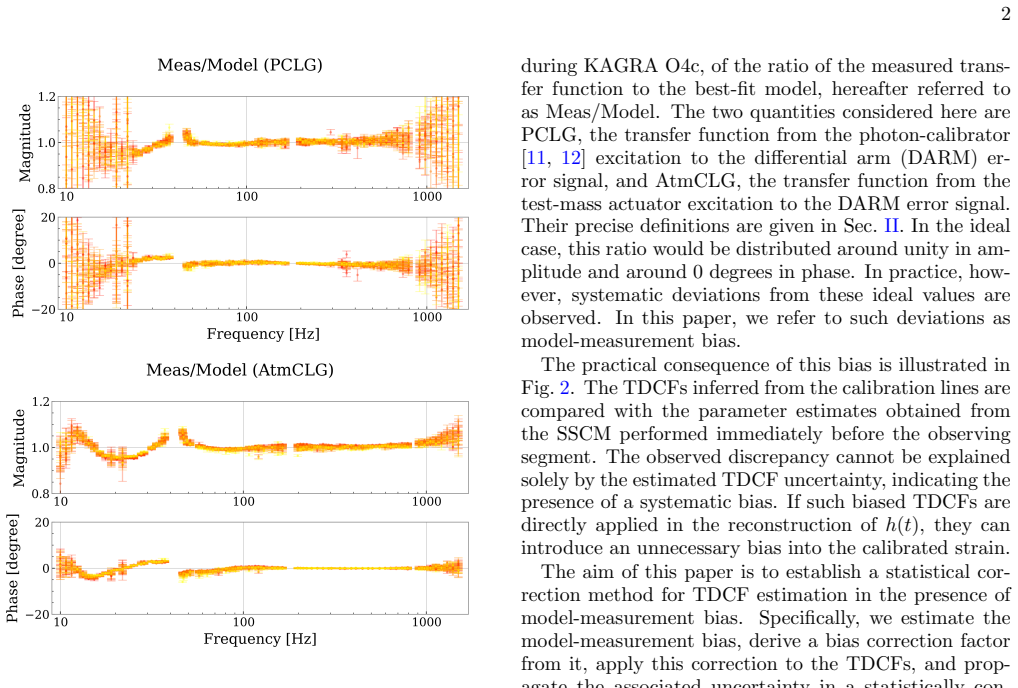
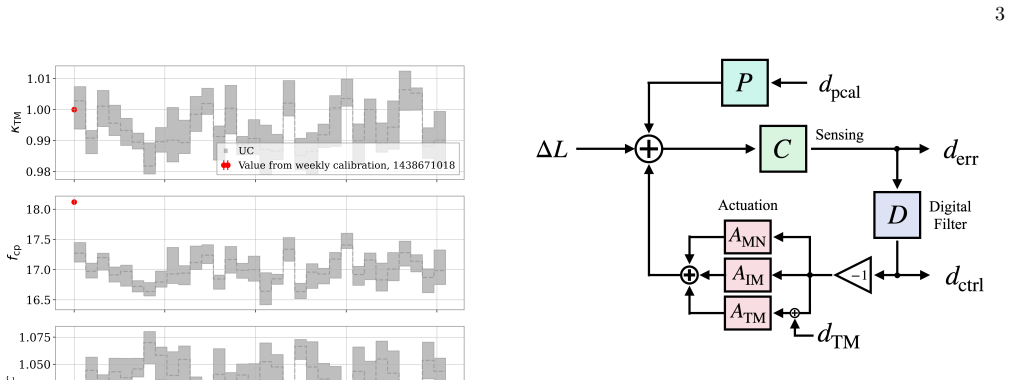
Calibration of gravitational-wave detectors reconstructs the strain h(t) from the detector output, and bias and uncertainty in this reconstruction directly affect downstream analyses. In ground-based interferometers, time-dependent correction factors (TDCFs) are estimated from calibration lines to track temporal variations of the detector response, while the underlying model parameters are periodically updated using broadband swept-sine calibration measurements (SSCMs). However, if a model-measurement bias exists between the measured transfer function and the reference model, the TDCFs inferred from calibration lines can introduce a systematic deviation into the reconstructed strain. We propose a statistical framework to estimate and correct this bias using repeated measurement-to-model ratios at the calibration-line frequencies. The bias correction factors are estimated with a rolling random-effects model based on restricted maximum likelihood (REML) and incorporated into the TDCF estimation, with their uncertainty propagated to the reconstructed response. Applying the method to KAGRA O4c data, we find that the uncorrected response shows deviations of up to approximately 7% in magnitude and 5 degrees in phase relative to the SSCM-based reference in representative examples. The correction reduces these deviations, with a modest increase in the propagated uncertainty due to the included correction-factor uncertainty. This framework provides a practical way to combine broadband reference models with calibration-line-based tracking when model-measurement bias is present.
Editorial analysis
A structured set of objections, weighed in public.
Referee Report
Summary. The manuscript proposes a statistical framework to estimate and correct model-measurement bias in KAGRA's time-dependent correction factors (TDCFs) derived from calibration lines. It uses repeated measurement-to-model ratios at line frequencies, modeled via a rolling random-effects structure with restricted maximum likelihood (REML), incorporates the resulting bias correction factors into TDCF estimation, and propagates their uncertainty. Application to KAGRA O4c data shows that uncorrected responses deviate by up to ~7% in magnitude and ~5° in phase from the SSCM broadband reference, with the correction reducing these deviations at modest cost to uncertainty.
Significance. If the central assumption holds, the method supplies a practical, statistically grounded procedure for combining periodic broadband SSCM references with continuous line-based tracking while accounting for bias; this directly addresses a source of systematic error in strain reconstruction that affects downstream GW analyses. The use of REML and explicit uncertainty propagation are strengths that support reproducibility.
major comments (2)
- [Abstract] Abstract (paragraph on the proposed framework) and results section: the claim that bias sampled at calibration-line frequencies is representative of the overall response bias across the science band is load-bearing for the correction's validity, yet the reported KAGRA O4c examples compare only at the same line frequencies or in aggregate; no explicit test of residuals at off-line frequencies is described, leaving open the possibility that frequency-dependent model error remains uncorrected.
- [Methods] Methods (description of the rolling random-effects model): the choice of rolling window length, data exclusion criteria, and the precise form of the random-effects covariance are not specified in sufficient detail to allow independent verification of the REML estimates or to assess sensitivity to these choices; these parameters directly affect the bias correction factors that are then propagated into the reconstructed response.
minor comments (2)
- Figure captions and text should explicitly state whether the plotted deviations are evaluated only at calibration lines or include interpolated points; this affects interpretation of the reported reduction.
- The abstract states 'modest increase in the propagated uncertainty'; a quantitative statement of the typical fractional increase (e.g., from Table X or Eq. Y) would improve clarity.
Simulated Author's Rebuttal
We thank the referee for their constructive and detailed review of our manuscript. We address each major comment below and indicate the revisions we will incorporate.
read point-by-point responses
-
Referee: [Abstract] Abstract (paragraph on the proposed framework) and results section: the claim that bias sampled at calibration-line frequencies is representative of the overall response bias across the science band is load-bearing for the correction's validity, yet the reported KAGRA O4c examples compare only at the same line frequencies or in aggregate; no explicit test of residuals at off-line frequencies is described, leaving open the possibility that frequency-dependent model error remains uncorrected.
Authors: We agree that the representativeness assumption is central and that explicit validation at off-line frequencies would strengthen the results. Our presented examples focus on the calibration-line frequencies (where the bias correction is directly estimated) and aggregate comparisons to the SSCM reference. In the revised manuscript we will add a dedicated analysis of residuals at off-line frequencies using the available SSCM data points to quantify any remaining frequency-dependent discrepancies. revision: yes
-
Referee: [Methods] Methods (description of the rolling random-effects model): the choice of rolling window length, data exclusion criteria, and the precise form of the random-effects covariance are not specified in sufficient detail to allow independent verification of the REML estimates or to assess sensitivity to these choices; these parameters directly affect the bias correction factors that are then propagated into the reconstructed response.
Authors: We acknowledge that the current Methods section does not provide sufficient implementation detail for reproducibility. In the revised manuscript we will explicitly state the rolling window length, the data exclusion criteria, and the precise form of the random-effects covariance structure. We will also include a short sensitivity discussion of these choices and their effect on the propagated uncertainty. revision: yes
Circularity Check
No circularity: derivation uses external SSCM reference and independent statistical estimation on calibration-line data
full rationale
The paper's central construction estimates bias correction factors from repeated measurement-to-model ratios at calibration-line frequencies via a rolling random-effects REML model, then propagates uncertainty into TDCF-corrected responses. This is compared against an independent SSCM broadband reference that is not derived from the same calibration-line inputs. No step reduces a prediction to a fitted parameter by construction, invokes a self-citation chain for uniqueness, or renames an input as output. The framework remains self-contained against the external SSCM benchmark, with the representativeness of line-frequency bias treated as an explicit modeling assumption rather than a definitional identity.
Axiom & Free-Parameter Ledger
free parameters (1)
- bias correction factors
axioms (2)
- domain assumption Measurement-to-model ratios at calibration-line frequencies represent the model-measurement bias across the response.
- domain assumption The bias varies in a manner amenable to random-effects modeling over rolling time windows.
Forward citations
Cited by 1 Pith paper
-
Statistical-Uncertainty-Driven Selection of Evaluation Frequency for Time-Dependent Sensing Calibration: A Demonstration with KAGRA Data
Statistical framework ranks candidate frequencies by combined amplitude and phase uncertainty widths from empirical percentiles, selecting 244 Hz for KAGRA sensing calibration with reduced amplitude interval width.
Reference graph
Works this paper leans on
-
[1]
T. L. S. Collaboration, J. Aasi, B. P. Abbott, R. Ab- bott, T. Abbott, M. R. Abernathy, K. Ackley, C. Adams, T. Adams, P. Addesso, R. X. Adhikari, V. Adya, C. Af- feldt, N. Aggarwal, O. D. Aguiar, A. Ain, P. Ajith, A. Alemic, B. Allen, D. Amariutei, S. B. Anderson, W. G. Anderson, K. Arai, M. C. Araya, C. Arceneaux, J. S. Areeda, G. Ashton, S. Ast, S. M. ...
2015
-
[2]
B. P. Abbott, R. Abbott, T. D. Abbott, M. R. Aber- nathy, F. Acernese, K. Ackley, C. Adams, T. Adams, P. Addesso, R. X. Adhikari, V. B. Adya, C. Affeldt, M. Agathos, K. Agatsuma, N. Aggarwal, O. D. Aguiar, L. Aiello, A. Ain, P. Ajith, B. Allen, A. Allocca, P. A. Altin, S. B. Anderson, W. G. Anderson, K. Arai, M. A. Arain, M. C. Araya, C. C. Arceneaux, J. ...
2016
-
[3]
Acernese, M
F. Acernese, M. Agathos, K. Agatsuma, D. Aisa, N. Alle- mandou, A. Allocca, J. Amarni, P. Astone, G. Balestri, G. Ballardin, F. Barone, J.-P. Baronick, M. Barsug- lia, A. Basti, F. Basti, T. S. Bauer, V. Bavigadda, M. Bejger, M. G. Beker, C. Belczynski, D. Bersanetti, A. Bertolini, M. Bitossi, M. A. Bizouard, S. Bloemen, M. Blom, M. Boer, G. Bogaert, D. B...
2014
-
[4]
Akutsu, M
T. Akutsu, M. Ando, K. Arai, Y. Arai, S. Araki, A. Araya, N. Aritomi, Y. Aso, S. Bae, Y. Bae, L. Baiotti, R. Bajpai, M. A. Barton, K. Cannon, E. Capocasa, M. Chan, C. Chen, K. Chen, Y. Chen, H. Chu, Y. K. Chu, S. Eguchi, Y. Enomoto, R. Flaminio, Y. Fujii, M. Fukunaga, M. Fukushima, G. Ge, A. Hagiwara, S. Haino, K. Hasegawa, H. Hayakawa, K. Hayama, Y. Hime...
2020
-
[5]
T. L. S. Collaboration, the Virgo Collaboration, and the KAGRA Collaboration, Gwtc-5.0: Observations from the second part of the fourth ligo-virgo-kagra observing run and updates to the gravitational-wave transient catalog (2026), arXiv:2605.27225 [gr-qc]
Pith/arXiv arXiv 2026
-
[6]
Completion of ligo-virgo-kagras fourth observing run (2025), (Accessed: 2026-03-10)
2025
-
[7]
Gupta, K
A. Gupta, K. G. Arun, E. Barausse, L. Bernard, E. Berti, S. A. Bhat, A. Buonanno, V. Cardoso, S. Y. Cheung, T. A. Clarke, S. Datta, A. Dhani, J. M. Ezquiaga, I. Gupta, N. Guttman, T. Hinderer, Q. Hu, J. Jan- quart, N. K. Johnson-McDaniel, R. Kashyap, N. V. Kr- ishnendu, P. D. Lasky, A. Lundgren, E. Maggio, P. Ma- hapatra, A. Maselli, P. Narayan, A. B. Nie...
2025
-
[8]
M. R. Sinha, L. Sun, and S. Ma, Phys. Rev. D112, 084038 (2025)
2025
-
[9]
E. D. Hall, C. Cahillane, K. Izumi, R. J. E. Smith, and R. X. Adhikari, Classical and Quantum Gravity36, 205006 (2019)
2019
-
[10]
Tuyenbayev, S
D. Tuyenbayev, S. Karki, J. Betzwieser, C. Cahillane, E. Goetz, K. Izumi, S. Kandhasamy, J. S. Kissel, G. Mendell, M. Wade, A. J. Weinstein, and R. L. Savage, Classical and Quantum Gravity34, 015002 (2016)
2016
-
[11]
Estevez, P
D. Estevez, P. Lagabbe, A. Masserot, L. Rolland, M. Seglar-Arroyo, and D. Verkindt, Classical and Quan- tum Gravity38, 075007 (2021)
2021
-
[12]
D. Chen, S. Hido, D. Tuyenbayev, D. Bhattacharjee, N. Kanda, R. L. Savage, R. Bajpai, S. Haino, T. Sawada, T. Yamamoto, T. Tomaru, and Y. Moriwaki, Classical and Quantum Gravity42, 185018 (2025)
2025
-
[13]
L. Sun, E. Goetz, J. S. Kissel, J. Betzwieser, S. Karki, A. Viets, M. Wade, D. Bhattacharjee, V. Bossilkov, P. B. Covas, L. E. H. Datrier, R. Gray, S. Kandhasamy, Y. K. Lecoeuche, G. Mendell, T. Mistry, E. Payne, R. L. Sav- age, A. J. Weinstein, S. Aston, A. Buikema, C. Cahillane, J. C. Driggers, S. E. Dwyer, R. Kumar, and A. Urban, Classical and Quantum ...
2020
-
[14]
Cahillane, J
C. Cahillane, J. Betzwieser, D. A. Brown, E. Goetz, E. D. Hall, K. Izumi, S. Kandhasamy, S. Karki, J. S. Kissel, G. Mendell, R. L. Savage, D. Tuyenbayev, A. Urban, A. Viets, M. Wade, and A. J. Weinstein, Phys. Rev. D 96, 102001 (2017)
2017
-
[15]
Akutsu, M
T. Akutsu, M. Ando, K. Arai, Y. Arai, S. Araki, A. Araya, N. Aritomi, H. Asada, Y. Aso, S. Bae, Y. Bae, L. Baiotti, R. Bajpai, M. A. Barton, K. Cannon, Z. Cao, E. Capocasa, M. Chan, C. Chen, K. Chen, Y. Chen, C. Y. Chiang, H. Chu, Y. K. Chu, S. Eguchi, Y. Enomoto, R. Flaminio, Y. Fujii, Y. Fujikawa, M. Fukunaga, M. Fukushima, D. Gao, G. Ge, S. Ha, A. Hagi...
2021
-
[16]
J. P. T. Higgins, S. G. Thompson, and D. J. Spiegelhalter, Journal of the Royal Statistical Society Series A172, 137 (2009)
2009
-
[17]
W. Viechtbauer, Journal of Educational and Behavioral Statistics30, 261 (2005), https://doi.org/10.3102/10769986030003261
-
[18]
Bendat, Journal of Sound and Vibration59, 405 (1978)
J. Bendat, Journal of Sound and Vibration59, 405 (1978)
1978
-
[19]
W. Viechtbauer, Statistics in Medicine26, 37 (2007), https://onlinelibrary.wiley.com/doi/pdf/10.1002/sim.2514
-
[20]
Hartung and G
J. Hartung and G. Knapp, Statistics in medicine20, 3875 (2001)
2001
-
[21]
Partlett and R
C. Partlett and R. Riley, Statistics in medicine36(2016)
2016
-
[22]
A. D. Viets, M. Wade, A. L. Urban, S. Kand- hasamy, J. Betzwieser, D. A. Brown, J. Burguet-Castell, C. Cahillane, E. Goetz, K. Izumi, S. Karki, J. S. Kissel, G. Mendell, R. L. Savage, X. Siemens, D. Tuyenbayev, and A. J. Weinstein, Classical and Quantum Gravity35, 095015 (2018)
2018
discussion (0)
Sign in with ORCID, Apple, or X to comment. Anyone can read and Pith papers without signing in.