Anatomy of the Market: A Body-Tail Test of Factor Models
Pith reviewed 2026-07-01 07:21 UTC · model grok-4.3
The pith
A capitalization-ranked split of the market into body and tail legs reveals that the q5 model produces offsetting daily alphas even when it spans the aggregate market best.
A machine-rendered reading of the paper's core claim, the machinery that carries it, and where it could break.
Core claim
In an ideal stochastic discount factor zero pricing errors and maximum Sharpe ratio coincide, but in low-dimensional approximations they need not. Decomposing an investible CRSP market into capitalization-ranked body and tail legs that recombine to the market return shows that at daily frequency all models pass the aggregate benchmark, yet q5 alone leaves systematic offsetting leg alphas—negative body, positive tail—at all nine split ratios despite holding the strongest spanning position. Matched random splits remove the pattern. Monthly aggregation attenuates q5's joint rejection and shifts relative weakness toward FF3.
What carries the argument
The capitalization-ranked body-tail decomposition that splits the CRSP market into legs recombining exactly to the market return.
If this is right
- Internal consistency of factor models is frequency-dependent rather than a fixed property.
- q5 exhibits the strongest market spanning yet still fails the body-tail consistency test at daily frequency.
- Aggregate benchmarks alone are insufficient to detect offsetting pricing errors across market segments.
- Random splits of the market do not generate the same offsetting alpha pattern seen in the capitalization-ranked split.
- Monthly data aggregation changes which model shows the greatest weakness relative to the others.
Where Pith is reading between the lines
- Daily-frequency tests may surface approximation errors in factor models that monthly data smooth over.
- The body-tail method could be applied to other markets or asset classes to check whether the same frequency dependence appears.
- Models that survive both aggregate and leg tests might be closer to ideal SDFs than those that pass only aggregates.
Load-bearing premise
Splitting the market by capitalization rank isolates variation that is economically meaningful enough to expose internal inconsistencies in factor models.
What would settle it
Observing that the negative-body positive-tail alpha pattern for q5 disappears under an alternative non-capitalization split or after orthogonalizing the legs to additional factors would undermine the claim of systematic inconsistency.
Figures

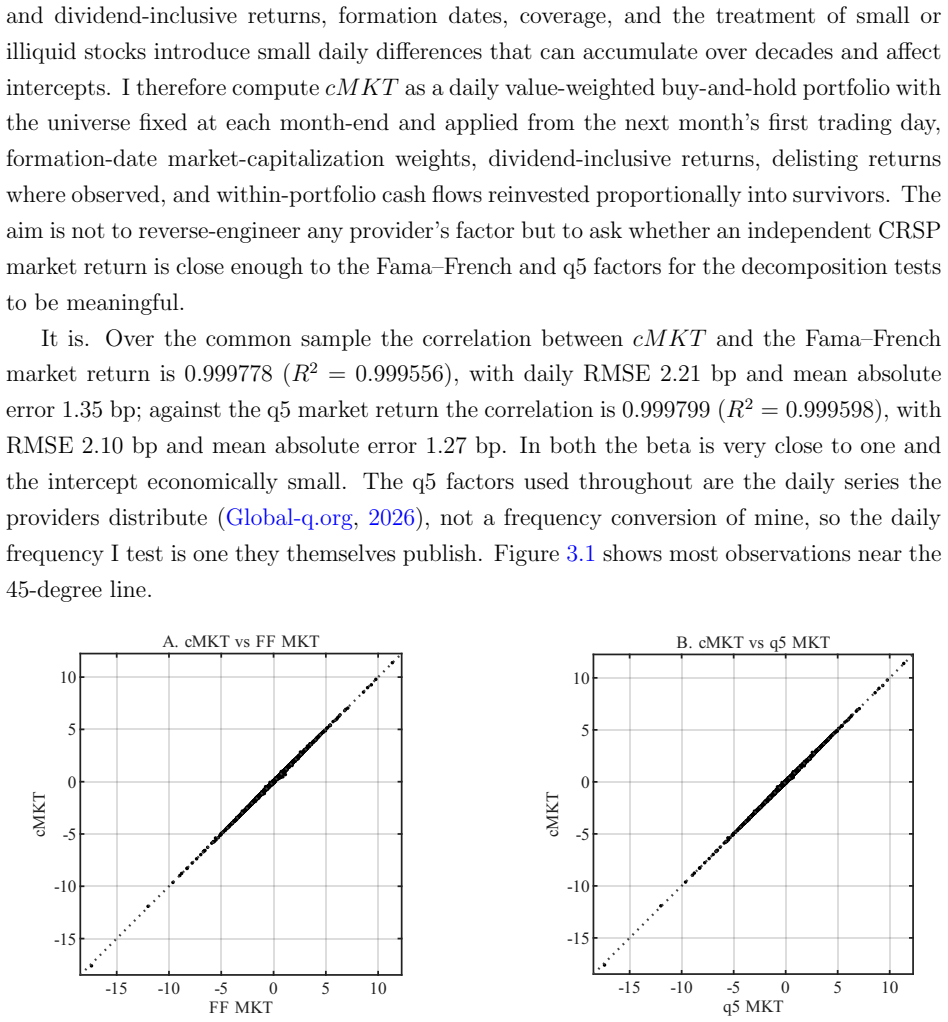
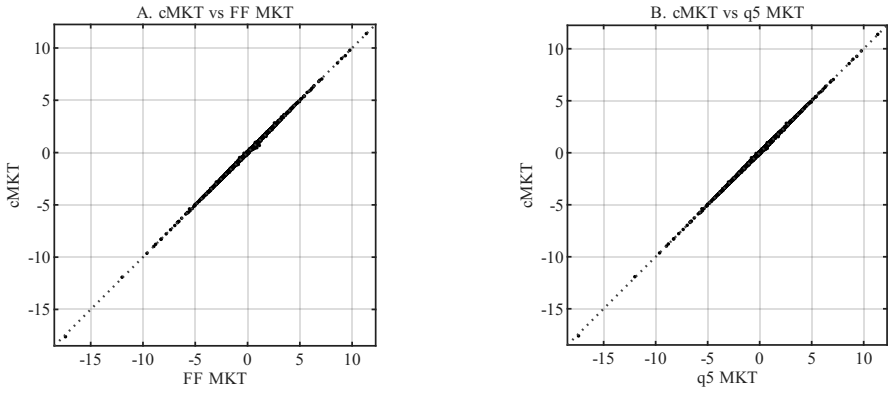
read the original abstract
In an ideal stochastic discount factor, zero pricing errors and maximum Sharpe ratio coincide; in a low-dimensional approximation they need not. I test this separation by decomposing an investible CRSP market into capitalization-ranked body and tail legs that recombine to the market return. At the daily frequency, all models pass the aggregate benchmark, but q5 alone leaves systematic offsetting leg alphas-negative body, positive tail-at all nine split ratios, despite holding the strongest spanning position. Matched random splits remove the pattern. Monthly aggregation attenuates q5's joint rejection and shifts relative weakness toward FF3, showing that internal consistency is frequency-dependent.
Editorial analysis
A structured set of objections, weighed in public.
Referee Report
Summary. The paper decomposes the CRSP market into capitalization-ranked body and tail legs that recombine to the aggregate return. It reports that at daily frequency all tested factor models span the aggregate market, but q5 alone produces systematic negative body alphas and positive tail alphas across nine split ratios; this pattern is absent in matched random splits. Monthly aggregation attenuates the q5 rejection and shifts relative weakness toward FF3, leading to the conclusion that internal consistency of factor models is frequency-dependent.
Significance. The body-tail decomposition with a random-split placebo is a clean and falsifiable design that directly tests whether spanning the aggregate implies consistency on economically meaningful sub-portfolios. If the daily-frequency pattern survives microstructure controls, the result would show that even the best-spanning model (q5) can be internally inconsistent at high frequency, with implications for the use of daily data in asset-pricing tests and for the interpretation of multi-factor models.
major comments (2)
- [Abstract] Abstract and daily-frequency results: the claim of 'systematic offsetting leg alphas' for q5 is presented without error bars, t-statistics, or any statistical test of the joint body-tail rejection; this absence is load-bearing because the central claim rests on the existence and consistency of these alphas across nine splits.
- [Daily-frequency results] Daily-frequency leg-alpha results (described in abstract and results section): the tail leg consists of low-capitalization stocks whose daily returns are known to be contaminated by bid-ask bounce and non-synchronous trading; the paper reports that monthly aggregation weakens the rejection but supplies no robustness checks using mid-quote returns, liquidity screens, or lead-lag adjustments, leaving open the possibility that the offsetting alphas reflect microstructure noise rather than model inconsistency.
minor comments (2)
- [Method] The nine capitalization-ranked split ratios are described only by their existence; a table or appendix listing the exact percentile cutoffs would improve reproducibility.
- [Aggregate benchmark] The paper states that q5 'holds the strongest spanning position' on the aggregate; reporting the precise R² or pricing-error metrics that establish this ranking would strengthen the contrast with the leg results.
Simulated Author's Rebuttal
We thank the referee for the detailed and constructive report. The two major comments identify clear opportunities to strengthen the statistical presentation and to address potential microstructure concerns. We respond to each below and will incorporate the suggested changes in the revision.
read point-by-point responses
-
Referee: [Abstract] Abstract and daily-frequency results: the claim of 'systematic offsetting leg alphas' for q5 is presented without error bars, t-statistics, or any statistical test of the joint body-tail rejection; this absence is load-bearing because the central claim rests on the existence and consistency of these alphas across nine splits.
Authors: We agree that explicit statistical tests would make the central claim more robust. Although the consistency of the sign pattern across all nine split ratios already provides strong informal evidence, we will add t-statistics for the individual body and tail alphas together with a joint Wald test of the body-tail pair in the revised results section. A brief reference to these tests will also be added to the abstract. revision: yes
-
Referee: [Daily-frequency results] Daily-frequency leg-alpha results (described in abstract and results section): the tail leg consists of low-capitalization stocks whose daily returns are known to be contaminated by bid-ask bounce and non-synchronous trading; the paper reports that monthly aggregation weakens the rejection but supplies no robustness checks using mid-quote returns, liquidity screens, or lead-lag adjustments, leaving open the possibility that the offsetting alphas reflect microstructure noise rather than model inconsistency.
Authors: This is a legitimate concern. While the matched random-split placebo already controls for size-driven artifacts, it does not directly purge bid-ask bounce or non-synchronicity. In the revision we will add three robustness exercises: (i) Dimson (1979) lead-lag adjustments, (ii) exclusion of the smallest 1 % and 5 % of stocks within the tail, and (iii) liquidity screens based on positive trading volume. We will report whether the q5 offsetting pattern survives these filters and will qualify the conclusions if the alphas are materially attenuated. revision: yes
Circularity Check
No circularity: empirical test uses external data and standard models
full rationale
The paper performs an empirical decomposition of CRSP market returns into capitalization-ranked body and tail legs, then runs time-series regressions of these legs on standard factor models (q5, FF3, etc.) at daily and monthly frequencies, with random-split placebos. No derivation chain exists that reduces a claimed prediction or result to a fitted parameter defined by the result itself, nor does any load-bearing premise rely on self-citation of an unverified uniqueness theorem or ansatz. The test is externally falsifiable against CRSP returns and does not rename known patterns or smuggle assumptions via prior work by the same author. This is the normal case of a self-contained empirical study.
Axiom & Free-Parameter Ledger
free parameters (1)
- split ratios
axioms (1)
- domain assumption Factor models are evaluated by whether they produce zero alphas on sub-portfolios after spanning the aggregate return
Forward citations
Cited by 1 Pith paper
-
A Cap-Axis Integral Diagnostic of Factor Models
Introduces cap-axis integral diagnostic revealing zero-alpha violations on cap-rank subspaces in factor models using 1967-2024 CRSP data.
Reference graph
Works this paper leans on
-
[1]
Gibbons, M. R., Ross, S. A., & Shanken, J. (1989). A test of the efficiency of a given portfolio. Econometrica, 57(5), 1121--1152. https://www.jstor.org/stable/1913625
-
[2]
Lo, A. W., & MacKinlay, A. C. (1990). Data-snooping biases in tests of financial asset pricing models. The Review of Financial Studies, 3(3), 431--467. https://doi.org/10.1093/rfs/3.3.431
-
[3]
Hansen, L. P., & Jagannathan, R. (1997). Assessing specification errors in stochastic discount factor models. The Journal of Finance, 52(2), 557--590. https://doi.org/10.1111/j.1540-6261.1997.tb04813.x
-
[4]
Cochrane, J. H. (2005). Asset Pricing (Revised ed.). Princeton University Press. https://www.johnhcochrane.com/asset-pricing
2005
-
[5]
Lewellen, J., Nagel, S., & Shanken, J. (2010). A skeptical appraisal of asset-pricing tests. Journal of Financial Economics, 96(2), 175--194. https://doi.org/10.1016/j.jfineco.2009.09.001
-
[6]
Barillas, F., & Shanken, J. (2017). Which alpha? The Review of Financial Studies, 30(4), 1316--1338. https://doi.org/10.1093/rfs/hhw101
-
[7]
Barillas, F., & Shanken, J. (2018). Comparing asset pricing models. The Journal of Finance, 73(2), 715--754. https://doi.org/10.1111/jofi.12607
-
[8]
Kozak, S., Nagel, S., & Santosh, S. (2018). Interpreting factor models. The Journal of Finance, 73(3), 1183--1223. https://doi.org/10.1111/jofi.12612
-
[9]
Chen, A. Y., & Zimmermann, T. (2022). Open source cross-sectional asset pricing. Critical Finance Review, 11(2), 207--264. https://doi.org/10.1561/104.00000112
-
[10]
Giglio, S., Xiu, D., & Zhang, D. (2025). Test assets and weak factors. The Journal of Finance, 80(1), 259--319. https://doi.org/10.1111/jofi.13415
-
[11]
Shin, U. (2026). Which portfolios? The construction dependence of factor model performance. arXiv preprint arXiv:2606.19550. https://doi.org/10.48550/arXiv.2606.19550
work page internal anchor Pith review Pith/arXiv arXiv doi:10.48550/arxiv.2606.19550 2026
-
[12]
Jegadeesh, N., & Titman, S. (1993). Returns to buying winners and selling losers: Implications for stock market efficiency. The Journal of Finance, 48(1), 65--91. https://doi.org/10.1111/j.1540-6261.1993.tb04702.x
-
[13]
Carhart, M. M. (1997). On persistence in mutual fund performance. The Journal of Finance, 52(1), 57--82. https://doi.org/10.1111/j.1540-6261.1997.tb03808.x
-
[14]
Fama, E. F., & French, K. R. (1992). The cross-section of expected stock returns. The Journal of Finance, 47(2), 427--465. https://doi.org/10.1111/j.1540-6261.1992.tb04398.x
-
[15]
Fama, E. F., & French, K. R. (1993). Common risk factors in the returns on stocks and bonds. Journal of Financial Economics, 33(1), 3--56. https://doi.org/10.1016/0304-405X(93)90023-5
-
[16]
Fama, E. F., & French, K. R. (2015). A five-factor asset pricing model. Journal of Financial Economics, 116(1), 1--22. https://doi.org/10.1016/j.jfineco.2014.10.010
-
[17]
Fama, E. F., & French, K. R. (2018). Choosing factors. Journal of Financial Economics, 128(2), 234--252. https://doi.org/10.1016/j.jfineco.2018.02.012
-
[18]
Hou, K., Xue, C., & Zhang, L. (2015). Digesting anomalies: An investment approach. The Review of Financial Studies, 28(3), 650--705. https://doi.org/10.1093/rfs/hhu068
-
[19]
Hou, K., Mo, H., Xue, C., & Zhang, L. (2019). Which factors? Review of Finance, 23(1), 1--35. https://doi.org/10.1093/rof/rfy032
-
[20]
Hou, K., Xue, C., & Zhang, L. (2020). Replicating anomalies. The Review of Financial Studies, 33(5), 2019--2133. https://doi.org/10.1093/rfs/hhy131
-
[21]
Hou, K., Mo, H., Xue, C., & Zhang, L. (2021). An augmented q-factor model with expected growth. Review of Finance, 25(1), 1--41. https://doi.org/10.1093/rof/rfaa004
-
[22]
Hou, K., Mo, H., Xue, C., & Zhang, L. (2024). The economics of security analysis. Management Science, 70(1), 164--186. https://doi.org/10.1287/mnsc.2022.4640
-
[23]
Center for Research in Security Prices, LLC. (2026). CRSP US Stock Databases [Data set]. Accessed via Wharton Research Data Services, June 5, 2026. https://www.crsp.org/research/
2026
-
[24]
French, K. R. (2026). Kenneth R. French Data Library [Data set]. Accessed May 5, 2026. https://mba.tuck.dartmouth.edu/pages/faculty/ken.french/data_library.html
2026
-
[25]
Global-q.org. (2026). Factors and testing portfolios [Data set]. Accessed May 5, 2026. https://global-q.org/factors.html
2026
-
[26]
Open Source Asset Pricing. (2026). Open Source Asset Pricing [Data set]. Accessed June 24, 2026. https://www.openassetpricing.com
2026
discussion (0)
Sign in with ORCID, Apple, or X to comment. Anyone can read and Pith papers without signing in.