Detection of anti-correlation of hot and cold baryons in galaxy clusters
Pith reviewed 2026-05-25 08:48 UTC · model grok-4.3
The pith
Multi-wavelength observations of 41 galaxy clusters detect anti-correlation between hot gas mass and stellar mass at fixed total mass.
A machine-rendered reading of the paper's core claim, the machinery that carries it, and where it could break.
Core claim
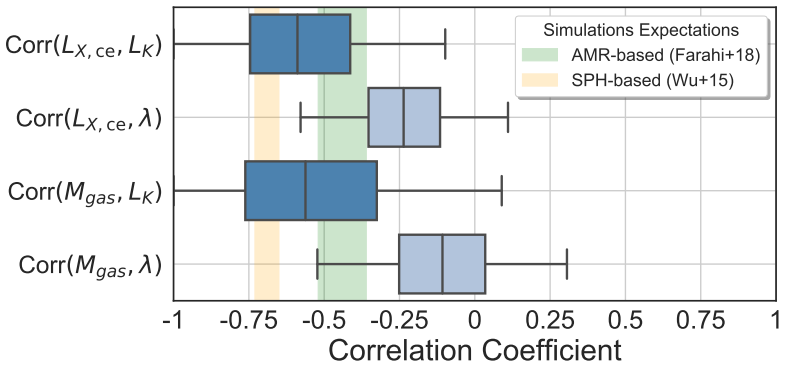
We report observational detection of this anti-correlation based on 4 elements of a 9×9 element covariance matrix for nine cluster properties, measured from X-ray, optical, infrared and millimetre wavelength observations of 41 clusters from the Local Cluster Substructure Survey. These clusters were selected using explicit and quantitative selection rules that were then encoded in our hierarchical Bayesian model. Our detection of anti-correlation is consistent with predictions from contemporary hydrodynamic cosmological simulations that were not tuned to reproduce this signal.
What carries the argument
The 9×9 covariance matrix for nine cluster properties, extracted via hierarchical Bayesian modeling that encodes the survey selection function from multi-wavelength observations.
If this is right
- The highest-mass clusters retain the full cosmic baryon fraction with no net loss.
- Hydrodynamic simulations correctly partition baryons between hot and cold phases without tuning to this observable.
- The anti-correlation supplies a new observational constraint on models of star formation and feedback inside clusters.
- Scaling relations among cluster observables must incorporate this negative covariance when used for mass calibration.
Where Pith is reading between the lines
- The same anti-correlation may appear in lower-mass groups once selection effects are modeled at similar precision.
- Future wide-field surveys could treat the measured covariance as a prior when inferring individual cluster masses from mixed observables.
- The result tightens the link between total halo mass and retained baryons, which could affect interpretations of the missing-baryons problem at cluster scales.
Load-bearing premise
The hierarchical Bayesian model accurately encodes the survey selection rules and the measured cluster properties contain no unaccounted systematic errors that could create a spurious covariance signal.
What would settle it
Repeating the covariance measurement on an independent sample of clusters with different selection rules and finding the four relevant matrix elements consistent with zero or positive correlation would falsify the reported anti-correlation.
Figures


read the original abstract
The largest clusters of galaxies in the Universe contain vast amounts of dark matter, plus baryonic matter in two principal phases, a majority hot gas component and a minority cold stellar phase comprising stars, compact objects, and low-temperature gas. Hydrodynamic simulations indicate that the highest-mass systems retain the cosmic fraction of baryons, a natural consequence of which is anti-correlation between the masses of hot gas and stars within dark matter halos of fixed total mass. We report observational detection of this anti-correlation based on 4 elements of a $9\times9$ element covariance matrix for nine cluster properties, measured from X-ray, optical, infrared and millimetre wavelength observations of 41 clusters from the Local Cluster Substructure Survey. These clusters were selected using explicit and quantitative selection rules that were then encoded in our hierarchical Bayesian model. Our detection of anti-correlation is consistent with predictions from contemporary hydrodynamic cosmological simulations that were not tuned to reproduce this signal.
Editorial analysis
A structured set of objections, weighed in public.
Referee Report
Summary. The manuscript claims an observational detection of anti-correlation between the masses of hot gas and cold stellar baryons within galaxy clusters at fixed dark matter halo mass. This is based on nine cluster properties measured from X-ray, optical, infrared and millimetre observations of 41 clusters selected from the Local Cluster Substructure Survey according to explicit quantitative rules. A hierarchical Bayesian model encodes these selection rules to infer a 9×9 covariance matrix; four off-diagonal elements are reported as showing the anti-correlation, and the result is stated to be consistent with predictions from untuned hydrodynamic cosmological simulations.
Significance. If the central claim holds, the result would constitute the first observational confirmation of a baryon-partitioning prediction from cosmological hydrodynamical simulations. The multi-wavelength data set and the explicit encoding of the survey selection function are strengths that reduce certain classes of bias relative to simpler analyses.
major comments (2)
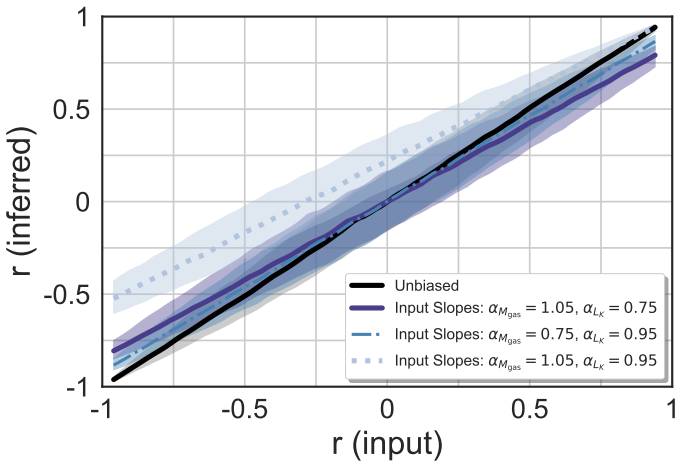
- [Hierarchical Bayesian model and covariance inference] The detection rests on four specific elements of the inferred 9×9 covariance matrix. The hierarchical Bayesian model must therefore correctly encode the survey selection function and treat all wavelength-dependent measurement errors as uncorrelated; with only 41 clusters the posterior is sensitive to even modest misspecification of either ingredient. The manuscript should present explicit validation (e.g., mock-data recovery tests) that residual selection bias or correlated systematics cannot produce the reported signal.
- [Results on the covariance matrix] Table or figure presenting the 9×9 covariance matrix: the statistical significance and robustness of the four highlighted off-diagonal elements should be quantified after marginalizing over all other parameters, including any possible wavelength-dependent systematics that could correlate hot-gas and stellar-mass proxies.
minor comments (1)
- The abstract describes the method at a high level but omits details on data quality, error propagation, and model-validation tests; adding one or two sentences on these points would improve accessibility.
Simulated Author's Rebuttal
We thank the referee for their constructive review and for recognizing the potential importance of the result. We respond to each major comment below and have revised the manuscript to address the concerns raised.
read point-by-point responses
-
Referee: [Hierarchical Bayesian model and covariance inference] The detection rests on four specific elements of the inferred 9×9 covariance matrix. The hierarchical Bayesian model must therefore correctly encode the survey selection function and treat all wavelength-dependent measurement errors as uncorrelated; with only 41 clusters the posterior is sensitive to even modest misspecification of either ingredient. The manuscript should present explicit validation (e.g., mock-data recovery tests) that residual selection bias or correlated systematics cannot produce the reported signal.
Authors: We agree that explicit validation is warranted given the sample size. The hierarchical model was constructed to encode the survey selection function via the explicit quantitative rules described in Section 3, and wavelength-dependent measurement errors are modeled as uncorrelated following the independent data pipelines. To strengthen the presentation, the revised manuscript now includes a dedicated appendix with mock-data recovery tests. These tests inject known covariance matrices (including the target anti-correlations) into simulated clusters drawn from the same selection function and recover the input parameters without bias, confirming that neither residual selection effects nor the assumed error structure produce the reported signal. revision: yes
-
Referee: [Results on the covariance matrix] Table or figure presenting the 9×9 covariance matrix: the statistical significance and robustness of the four highlighted off-diagonal elements should be quantified after marginalizing over all other parameters, including any possible wavelength-dependent systematics that could correlate hot-gas and stellar-mass proxies.
Authors: The revised manuscript adds a new figure that displays the full 9×9 posterior covariance matrix, with posterior means and 68% credible intervals reported for every element. The four off-diagonal elements of interest are highlighted, and their fully marginalized posterior distributions (after integrating over all other covariance parameters) are shown explicitly. To address possible wavelength-dependent systematics, we have added a robustness section that introduces nuisance parameters allowing correlated errors between the X-ray and optical/infrared proxies; the anti-correlation signal remains significant (>3σ) under these extensions. revision: yes
Circularity Check
No significant circularity; result from independent multi-wavelength data fit
full rationale
The paper infers a 9x9 covariance matrix (with 4 off-diagonal elements showing anti-correlation) directly from X-ray, optical, IR and mm observations of 41 clusters. The hierarchical Bayesian model encodes the survey's explicit selection rules as an input to the likelihood; the reported anti-correlation is an output of that fit, not a re-expression of the selection function or of any fitted parameter. Consistency with untuned hydrodynamic simulations is presented as external corroboration rather than a load-bearing premise. No self-citation, ansatz smuggling, or renaming of known results occurs in the derivation chain. The result is therefore self-contained against external benchmarks.
Axiom & Free-Parameter Ledger
axioms (1)
- domain assumption The survey selection function is properly modeled in the hierarchical Bayesian analysis.
Reference graph
Works this paper leans on
- [1]
-
[2]
Self-similar secondary infall and accretion in an Einstein-de Sitter universe
Bertschinger, E. Self-similar secondary infall and accretion in an Einstein-de Sitter universe. Astrophys. J. Supp. 58, 39–65 (1985)
work page 1985
-
[3]
Gunn, J. E. & Gott, J. R., III. On the Infall of Matter Into Clusters of Galaxies and Some Effects on Their Evolution. Astrophys. J. 176, 1 (1972)
work page 1972
-
[4]
White, S. D. M., Navarro, J. F., Evrard, A. E. & Frenk, C. S. The baryon content of galaxy clusters: a challenge to cosmological orthodoxy. Nat. 366, 429–433 (1993)
work page 1993
-
[5]
Riess, A. G. et al. Observational Evidence from Supernovae for an Accelerating Universe and a Cosmological Constant. The Astron. J. 116, 1009–1038 (1998)
work page 1998
-
[6]
Silk, J. & Mamon, G. A. The current status of galaxy formation. Res. Astron. Astrophys. 12, 917–946 (2012)
work page 2012
-
[7]
V oit, G. M.et al. A Global Model for Circumgalactic and Cluster-core Precipitation. Astrophys. J. 845, 80 (2017)
work page 2017
-
[8]
Vikhlinin, A. et al. Chandra Sample of Nearby Relaxed Galaxy Clusters: Mass, Gas Fraction, and Mass-Temperature Relation. Astrophys. J. 640, 691–709 (2006)
work page 2006
-
[9]
H., Sivanandam, S., Zabludoff, A
Gonzalez, A. H., Sivanandam, S., Zabludoff, A. I. & Zaritsky, D. Galaxy Cluster Baryon Fractions Revisited. Astrophys. J. 778, 14 (2013)
work page 2013
-
[10]
Wu, H.-Y .et al. RHAPSODY-G simulations: galaxy clusters as baryonic closed boxes and the covariance between hot gas and galaxies. Mon. Not. R. Astron. Soc. 452, 1982–1991 (2015)
work page 1982
-
[11]
Farahi, A., Evrard, A. E., McCarthy, I., Barnes, D. J. & Kay, S. T. Localized massive halo properties in BAHAMAS and MACSIS simulations: scalings, log-normality, and covariance. Mon. Not. R. Astron. Soc. (2018)
work page 2018
-
[12]
Sunyaev, R. A. & Zeldovich, I. B. Microwave background radiation as a probe of the contemporary structure and history of the universe. Annu. Rev. Astron. Astrophys. 18, 537–560 (1980)
work page 1980
-
[13]
Giodini, S. et al. Scaling Relations for Galaxy Clusters: Properties and Evolution. Space Sci. Rev. 177, 247–282 (2013)
work page 2013
-
[14]
Mantz, A., Allen, S. W., Ebeling, H., Rapetti, D. & Drlica-Wagner, A. The observed growth of massive galaxy clusters - II. X-ray scaling relations. Mon. Not. R. Astron. Soc. 406, 1773–1795 (2010)
work page 2010
-
[15]
Maughan, B. J. PICACS: self-consistent modelling of galaxy cluster scaling relations. Mon. Not. R. Astron. Soc. 437, 1171–1186 (2014). 8/14
work page 2014
-
[16]
Mantz, A. B., Allen, S. W., Morris, R. G. & Schmidt, R. W. Cosmology and astrophysics from relaxed galaxy clusters - III. Thermodynamic profiles and scaling relations. Mon. Not. R. Astron. Soc. 456, 4020–4039 (2016)
work page 2016
-
[17]
Andreon, S., Wang, J., Trinchieri, G., Moretti, A. & Serra, A. L. Variegate galaxy cluster gas content: Mean fraction, scatter, selection effects, and covariance with X-ray luminosity. Astron. Astrophys. 606, A24 (2017)
work page 2017
-
[18]
Okabe, N. & Smith, G. P. LoCuSS: weak-lensing mass calibration of galaxy clusters. Mon. Not. R. Astron. Soc. 461, 3794–3821 (2016)
work page 2016
-
[19]
Mulroy, S. L. et al. LoCuSS: scaling relations between galaxy cluster mass, gas, and stellar content. Mon. Not. R. Astron. Soc. 484, 60–80 (2019)
work page 2019
-
[20]
Evrard, A. E., Arnault, P., Huterer, D. & Farahi, A. A model for multiproperty galaxy cluster statistics. Mon. Not. R. Astron. Soc. 441, 3562–3569 (2014)
work page 2014
-
[21]
Evolution and clustering of rich clusters
Kaiser, N. Evolution and clustering of rich clusters. Mon. Not. R. Astron. Soc. 222, 323–345 (1986)
work page 1986
- [22]
-
[23]
Borgani, S. & Kravtsov, A. Cosmological Simulations of Galaxy Clusters. Adv. Sci. Lett. 4, 204–227 (2011)
work page 2011
-
[24]
Allen, S. W., Schmidt, R. W., Ebeling, H., Fabian, A. C. & van Speybroeck, L. Constraints on dark energy from Chandra observations of the largest relaxed galaxy clusters. Mon. Not. R. Astron. Soc. 353, 457–467 (2004)
work page 2004
- [25]
-
[26]
Mulroy, S. L. et al. LoCuSS: the near-infrared luminosity and weak-lensing mass scaling relation of galaxy clusters. Mon. Not. R. Astron. Soc. 443, 3309–3317 (2014)
work page 2014
-
[27]
Costanzi, M. et al. Modelling projection effects in optically selected cluster catalogues. Mon. Not. R. Astron. Soc. 482, 490–505 (2019)
work page 2019
-
[28]
Stanek, R., Rasia, E., Evrard, A. E., Pearce, F. & Gazzola, L. Massive Halos in Millennium Gas Simulations: Multivariate Scaling Relations. Astrophys. J. 715, 1508–1523 (2010)
work page 2010
-
[29]
Truong, N. et al. Cosmological hydrodynamical simulations of galaxy clusters: X-ray scaling relations and their evolution. Mon. Not. R. Astron. Soc. 474, 4089–4111 (2018)
work page 2018
-
[30]
Mantz, A. B. et al. Weighing the giants- V . Galaxy cluster scaling relations.Mon. Not. R. Astron. Soc. 463, 3582–3603 (2016)
work page 2016
-
[31]
Cross-calibration of cluster mass observables
Cunha, C. Cross-calibration of cluster mass observables. Phys. Rev. D 79, 063009 (2009)
work page 2009
-
[32]
Mantz, A. B. et al. Cosmology and astrophysics from relaxed galaxy clusters - II. Cosmological constraints. Mon. Not. R. Astron. Soc. 440, 2077–2098 (2014)
work page 2077
-
[33]
Ebeling, H. et al. The ROSAT Brightest Cluster Sample - I. The compilation of the sample and the cluster log N-log S distribution. Mon. Not. R. Astron. Soc. 301, 881–914 (1998)
work page 1998
-
[34]
Ebeling, H. et al. The ROSAT Brightest Cluster Sample - IV . The extended sample.Mon. Not. R. Astron. Soc. 318, 333–340 (2000)
work page 2000
-
[35]
B¨ohringer, H. et al. The ROSAT-ESO Flux Limited X-ray (REFLEX) Galaxy cluster survey. V . The cluster catalogue. Astron. Astrophys. 425, 367–383 (2004)
work page 2004
-
[36]
Navarro, J. F., Frenk, C. S. & White, S. D. M. A Universal Density Profile from Hierarchical Clustering. Astrophys. J. 490, 493–508 (1997)
work page 1997
-
[37]
Martino, R. et al. LoCuSS: hydrostatic mass measurements of the high-LX cluster sample - cross-calibration of Chandra and XMM-Newton. Mon. Not. R. Astron. Soc. 443, 2342–2360 (2014)
work page 2014
-
[38]
Rykoff, E. S. et al. redMaPPer. I. Algorithm and SDSS DR8 Catalog. Astrophys. J. 785, 104 (2014)
work page 2014
-
[39]
Alam, S. et al. The Eleventh and Twelfth Data Releases of the Sloan Digital Sky Survey: Final Data from SDSS-III. Astrophys. J. Supp. 219, 12 (2015)
work page 2015
-
[40]
Pillepich, A. et al. First results from the IllustrisTNG simulations: the stellar mass content of groups and clusters of galaxies. Mon. Not. R. Astron. Soc. 475, 648–675 (2018)
work page 2018
-
[41]
Chiu, I. et al. Baryon Content in a Sample of 91 Galaxy Clusters Selected by the South Pole Telescope at 0.2 ¡ z ¡ 1.25. Mon. Not. R. Astron. Soc. (2018). 9/14
work page 2018
-
[42]
Patil, A., Huard, D. & Fonnesbeck, C. J. Pymc: Bayesian stochastic modelling in python. J. statistical software 35, 1 (2010)
work page 2010
-
[43]
Kasun, S. F. & Evrard, A. E. Shapes and Alignments of Galaxy Cluster Halos. Astrophys. J. 629, 781–790 (2005)
work page 2005
-
[44]
The effect of distant large scale structure on weak lensing mass estimates
Hoekstra, H. The effect of distant large scale structure on weak lensing mass estimates. Astron. Astrophys. 370, 743–753 (2001)
work page 2001
-
[45]
Rozo, E. & Rykoff, E. S. redMaPPer II: X-Ray and SZ Performance Benchmarks for the SDSS Catalog. Astrophys. J. 783, 80 (2014). Acknowledgements We are grateful to Adam Mantz and Ben Maughan for useful discussions on population statistics. We thank Arif Babul and members of the LoCuSS, DES and XMM-XXL collaborations for their support. A.F. is supported by ...
work page 2014
discussion (0)
Sign in with ORCID, Apple, or X to comment. Anyone can read and Pith papers without signing in.