An in-silico study of conventional and FLASH radiotherapy iso-effectiveness: Radiolytic oxygen depletion and its potential impact on tumor control probability
Pith reviewed 2026-05-24 06:17 UTC · model grok-4.3
The pith
Mathematical models show radiolytic oxygen depletion produces lower tumor control probability for FLASH radiotherapy than conventional radiotherapy, while preclinical tumor volumes remain similar.
A machine-rendered reading of the paper's core claim, the machinery that carries it, and where it could break.
Core claim
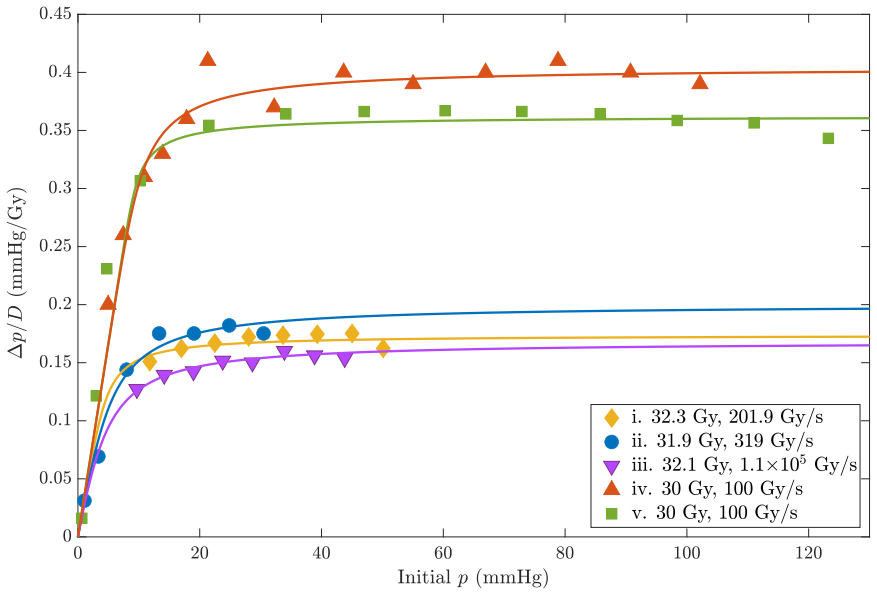
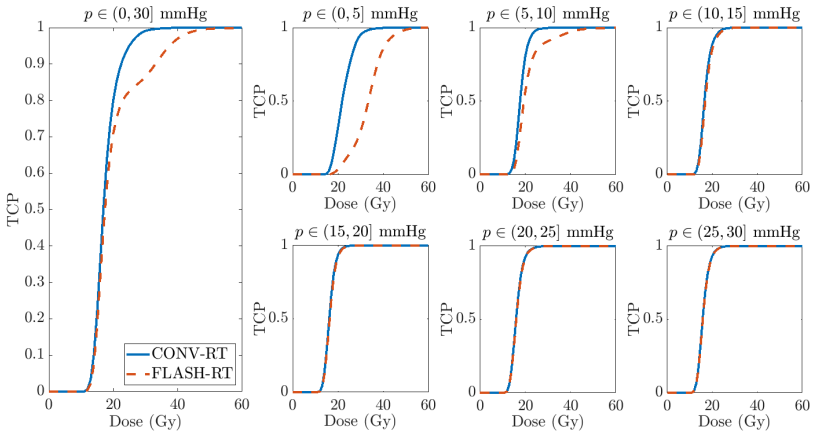
ROD causes differences in SF between FLASH-RT and CONV-RT, especially in low α/β and poorly oxygenated cells. These changes do not lead to significant differences in the evolution of preclinical tumors. However, when extrapolating this effect to TCP curves, we observed important differences between both techniques (TCP is lower in FLASH-RT).
What carries the argument
Spatiotemporal reaction-diffusion model of tumor oxygenation that incorporates radiolytic oxygen depletion, linked to linear-quadratic cell survival with oxygen enhancement ratios and to Poisson-LQ tumor control probability.
If this is right
- Surviving fractions differ most between the two techniques in low α/β and hypoxic cells.
- Preclinical tumor volume trajectories remain nearly identical under both irradiation methods.
- Extrapolated tumor control probability curves are lower for FLASH radiotherapy.
- Other unmodeled effects could still restore iso-effectiveness in actual tumors.
Where Pith is reading between the lines
- If TCP differences persist in patients, FLASH radiotherapy might require higher doses than conventional radiotherapy to achieve equivalent control.
- The model implies that endpoints based on volume curves versus control probability can give contradictory impressions of iso-effectiveness.
- Vascular or repair mechanisms omitted from the simulation could counteract the oxygen-depletion effect inside tumors.
Load-bearing premise
The linear-quadratic model with oxygen enhancement ratios and the chosen reaction-diffusion parameters accurately capture the dominant biological response to radiolytic oxygen depletion without needing additional unmodeled repair or vascular effects.
What would settle it
A clinical trial that directly measures tumor control probability after matched FLASH and conventional doses would show whether the modeled TCP difference appears in patients.
Figures


read the original abstract
FLASH radiotherapy (FLASH-RT) has shown the potential to spare normal tissue while seemingly maintaining the effectiveness of conventional radiotherapy (CONV-RT). It has been suggested that the protective effect arises from the radiolytic oxygen depletion (ROD) caused by FLASH-RT, but it is not entirely clear why this protective effect is not observed in tumors. Iso-effectiveness has been experimentally observed in time-volume curves of preclinical tumors irradiated with FLASH and conventional radiotherapy, but it may not translate to clinical trials, where tumor control probability (TCP) is typically the investigated endpoint. In this work, we used mathematical models to investigate the iso-effectiveness of FLASH-RT/CONV-RT on tumors, focusing on the role of ROD. We used a spatiotemporal reaction-diffusion model, including ROD, to simulate tumor oxygenation. From those oxygen distributions we obtained surviving fractions (SFs), using the linear-quadratic model with oxygen enhancement ratios (OER). We then used the calculated SFs to describe the evolution of preclinical tumor volumes through a mathematical model of tumor response. We also calculated TCPs using the Poisson-LQ approach. Our study suggests that ROD causes differences in SF between FLASH-RT and CONV-RT, especially in low $\alpha$/$\beta$ and poorly oxygenated cells. These changes do not lead to significant differences in the evolution of preclinical tumors. However, when extrapolating this effect to TCP curves, we observed important differences between both techniques (TCP is lower in FLASH-RT). Nonetheless, it cannot be discarded that other effects not modeled in this work could contribute to tumor control and maintain the iso-effectiveness of FLASH-RT.
Editorial analysis
A structured set of objections, weighed in public.
Referee Report
Summary. The manuscript uses a spatiotemporal reaction-diffusion model incorporating radiolytic oxygen depletion (ROD) to generate tumor oxygen distributions, from which surviving fractions (SFs) are derived via the linear-quadratic model with oxygen enhancement ratios (OER). These SFs feed a mathematical model of preclinical tumor volume evolution and a Poisson-LQ calculation of tumor control probability (TCP). The central claim is that ROD produces SF differences (especially for low α/β and hypoxic cells) that do not yield significant differences in tumor volume curves but do produce lower TCP for FLASH-RT than CONV-RT; other unmodeled effects may preserve iso-effectiveness.
Significance. If the extrapolation holds, the work shows that preclinical volume-based iso-effectiveness need not imply clinical TCP equivalence, which bears on the design and interpretation of FLASH-RT trials. The modeling chain is internally consistent and employs standard components (reaction-diffusion, LQ-OER, Poisson-LQ), but the TCP gap is a direct numerical consequence of literature-derived parameters without reported sensitivity analysis or validation against independent TCP data.
major comments (3)
- [TCP calculation (Poisson-LQ approach)] TCP calculation (Poisson-LQ approach): the reported TCP differences are obtained by direct application of the Poisson-LQ formula to the ROD-modified SFs; because α/β ratios, OER parameters, and cell-number assumptions are taken from prior literature without sensitivity analysis, the TCP gap is a constructed outcome of those inputs rather than an independent prediction.
- [LQ-OER and Poisson-LQ steps] Transition from oxygen fields to SFs and TCP: the claim that ROD-induced SF changes dominate the response (producing volume iso-effectiveness yet TCP differences) rests on the LQ-OER mapping and Poisson statistics; the manuscript does not test whether inclusion of repair kinetics, reoxygenation, or vascular response would erase or invert the TCP gap while leaving the volume result intact.
- [Tumor response and volume evolution model] Tumor volume evolution model: the absence of significant volume-curve differences despite SF variations is load-bearing for the preclinical-versus-clinical distinction; explicit demonstration is needed that this null result is robust to the chosen growth/response parameters and is not an artifact of the particular mapping from SF to volume.
minor comments (2)
- Parameter values (diffusion coefficient, depletion rate constant, α/β, OER factors) should be tabulated with their literature sources to improve reproducibility.
- The abstract and results should quantify what constitutes an 'important' TCP difference (e.g., shift in D50 or TCP at a fixed dose) rather than leaving the term qualitative.
Simulated Author's Rebuttal
We thank the referee for their constructive review and the opportunity to clarify aspects of our modeling study. We respond point-by-point to the major comments, proposing revisions where they strengthen the manuscript while maintaining our core findings.
read point-by-point responses
-
Referee: TCP calculation (Poisson-LQ approach): the reported TCP differences are obtained by direct application of the Poisson-LQ formula to the ROD-modified SFs; because α/β ratios, OER parameters, and cell-number assumptions are taken from prior literature without sensitivity analysis, the TCP gap is a constructed outcome of those inputs rather than an independent prediction.
Authors: The TCP results are indeed obtained by applying the standard Poisson-LQ model to SFs computed from literature-derived parameters, which is the conventional approach in such radiobiological extrapolations. Our aim is to demonstrate the logical consequence of ROD under these accepted inputs rather than to claim an empirical prediction. In the revised manuscript we will add a dedicated sensitivity analysis on α/β, OER, and initial clonogen number to quantify how the TCP gap varies with these parameters. revision: yes
-
Referee: Transition from oxygen fields to SFs and TCP: the claim that ROD-induced SF changes dominate the response (producing volume iso-effectiveness yet TCP differences) rests on the LQ-OER mapping and Poisson statistics; the manuscript does not test whether inclusion of repair kinetics, reoxygenation, or vascular response would erase or invert the TCP gap while leaving the volume result intact.
Authors: We agree that the model isolates the ROD effect within the LQ-OER and Poisson-LQ framework and does not incorporate repair kinetics, reoxygenation, or vascular dynamics. These omissions are deliberate to focus on the immediate radiochemical consequence of ROD. In the revision we will expand the discussion to state this scope limitation explicitly and note that the observed TCP-volume dissociation illustrates why TCP should be examined separately from volume endpoints, even if additional biology could modulate the gap. revision: partial
-
Referee: Tumor volume evolution model: the absence of significant volume-curve differences despite SF variations is load-bearing for the preclinical-versus-clinical distinction; explicit demonstration is needed that this null result is robust to the chosen growth/response parameters and is not an artifact of the particular mapping from SF to volume.
Authors: We will include supplementary simulations that systematically vary the tumor growth rate, the functional mapping from SF to volume reduction, and the post-irradiation regrowth parameters. These additional runs will confirm that the lack of statistically significant volume-curve separation between FLASH and CONV remains consistent across plausible parameter ranges. revision: yes
Circularity Check
No significant circularity; forward simulation from literature parameters
full rationale
The derivation consists of a reaction-diffusion oxygen model (with ROD), followed by LQ-OER survival fractions, a tumor-volume evolution model, and Poisson-LQ TCP calculation. All parameters (diffusion, consumption, α/β, OER) are taken from external literature or stated as typical values; the TCP difference is a numerical output of these independent inputs rather than a self-definitional reduction, fitted prediction, or self-citation chain. The paper explicitly notes unmodeled effects could alter results, confirming the chain is not closed by construction.
Axiom & Free-Parameter Ledger
free parameters (4)
- oxygen diffusion coefficient
- radiolytic oxygen depletion rate constant
- α/β ratios for tumor subpopulations
- OER parameters
axioms (3)
- domain assumption Linear-quadratic model with oxygen enhancement ratio accurately describes cell survival under varying oxygenation
- domain assumption Poisson statistics with LQ survival gives clinically relevant TCP
- domain assumption Reaction-diffusion equation with constant consumption and diffusion coefficients suffices for spatiotemporal oxygen dynamics
Reference graph
Works this paper leans on
-
[1]
M. Durante, E. Br¨ auer-Krisch, and M. Hill. Faster and safer? F LASH ultra-high dose rate in radiotherapy. Br. J. Radiol. , 91(1082):20170628, 2018
work page 2018
-
[2]
V. Favaudon, R. Labarbe, and C. L. Limoli. Model studies of the r ole of oxygen in the FLASH effect. Med. Phys., 49(3):2068–2081, 2022
work page 2068
-
[3]
V. Favaudon, L. Caplier, V. Monceau, F. Pouzoulet, M. Sayarat h, C. Fouillade, et al. Ultrahigh dose-rate FLASH irradiation increases the differential response b etween normal and tumor tissue in mice. Sci. Transl. Med. , 6(245):245ra93, 2014
work page 2014
-
[4]
P. Montay-Gruel, K. Petersson, M. Jaccard, G. Boivin, J. F. Ge rmond, B. Petit, et al. Irradia- tion in a flash: Unique sparing of memory in mice after whole brain irradia tion with dose rates above 100 Gy/s. Radiother. Oncol., 124(3):365–369, 2017
work page 2017
-
[5]
P. Montay-Gruel, A. Bouchet, M. Jaccard, D. Patin, R. Serduc , W. Aim, et al. X-rays can trigger the FLASH effect: Ultra-high dose-rate synchrotron light source prevents normal brain injury after whole brain irradiation in mice. Radiother. Oncol., 129(3):582–588, 2018
work page 2018
-
[6]
M. C. Vozenin, P. De Fornel, K. Petersson, V. Favaudon, M. Jac card, J. F. Germond, et al. The advantage of FLASH radiotherapy confirmed in mini-pig and cat- cancer patients. Clin. Cancer Res., 25(1):35–42, 2019
work page 2019
-
[7]
P. Montay-Gruel, M. M. Acharya, K. Petersson, L. Alikhani, C. Y akkala, B. D. Allen, et al. Long-term neurocognitive benefits of FLASH radiotherapy driven by reduced reactive oxygen species. PNAS, 116(22):10943–10951, 2019
work page 2019
-
[8]
K. Levy, S. Natarajan, J. Wang, S. Chow, J. T. Eggold, P. E. Lo o, et al. Abdominal FLASH ir- radiation reduces radiation-induced gastrointestinal toxicity for the treatment of ovarian cancer in mice. Sci. Rep., 10(1):21600, 2020
work page 2020
-
[9]
E. S. Diffenderfer, I. I. Verginadis, M. M. Kim, K. Shoniyozov, A. Velalopoulou, D. Goia, et al. Design, implementation, and in vivo validation of a novel proton FLASH radiation therapy system. Int. J. Radiat. Oncol. Biol. Phys. , 106(2):440–448, 2020
work page 2020
-
[10]
E. Liljedahl, E. Konradsson, E. Gustafsson, K. F¨ ornvik Jons son, J. K. Olofsson, C. Ceberg, et al. Long-term anti-tumor effects following both conventional ra diotherapy and FLASH in fully immunocompetent animals with glioblastoma. Sci. Rep. , 12(1):1–12, 2022
work page 2022
-
[11]
F. Gao, Y. Yang, H. Zhu, J. Wang, D. Xiao, Z. Zhou, et al. First d emonstration of the FLASH effect with ultrahigh dose rate high-energy X-rays. Radiother. Oncol., 166:44–50, 2022. 18
work page 2022
-
[12]
G. Pratx and D. S. Kapp. A computational model of radiolytic ox ygen depletion during FLASH irradiation and its effect on the oxygen enhancement ratio. Phys. Med. Biol. , 64(18):185005, 2019
work page 2019
-
[13]
G. Pratx and D. S. Kapp. Ultra-high-dose-rate FLASH irradiat ion may spare hypoxic stem cell niches in normal tissues. Int. J. Radiat. Oncol. Biol. Phys. , 105(1):190–192, 2019
work page 2019
-
[14]
K. Petersson, G. Adrian, K. Butterworth, and S. J. McMahon . A quantitative analysis of the role of oxygen tension in FLASH radiation therapy. Int. J. Radiat. Oncol. Biol. Phys. , 107(3):539–547, 2020
work page 2020
-
[15]
X. Cao, R. Zhang, T. V. Esipova, S. R. Allu, R. Ashraf, M. Rahma n, et al. Quantification of oxygen depletion during FLASH irradiation in vitro and in vivo. Int. J. Radiat. Oncol. Biol. Phys., 111(1):240–248, 2021
work page 2021
-
[16]
M. El Khatib, A. L. Van Slyke, A. Velalopoulou, M. M. Kim, K. Shoniy ozov, S. R. Allu, et al. Ultrafast tracking of oxygen dynamics during proton FLASH. Int. J. Radiat. Oncol. Biol. Phys. , 113(3):624–634, 2022
work page 2022
-
[17]
B. Ha, K. Liang, C. Liu, S. Melemenidis, R. Manjappa, V. Viswanat han, et al. Real-time optical oximetry during FLASH radiotherapy using a phosphorescent nano probe. Radiother. Oncol. , 176:239–243, 2022
work page 2022
- [18]
-
[19]
D. R. Spitz, G. R. Buettner, M. S. Petronek, J. J. St-Aubin, R . T. Flynn, T. J. Waldron, et al. An integrated physico-chemical approach for explaining the differe ntial impact of FLASH versus conventional dose rate irradiation on cancer and normal tissue re sponses. Radiother. Oncol. , 139:23–27, 2019
work page 2019
-
[20]
J. Y. Jin, A. Gu, W. Wang, N. L. Oleinick, M. Machtay, and K. Feng -Ming. Ultra-high dose rate effect on circulating immune cells: A potential mechanism for FLA SH effect? Radiother. Oncol., 149:55–62, 2020
work page 2020
-
[21]
R. Abolfath, A. Baikalov, S. Rahvar, A. Fraile, S. Bartzsch, E. Sch¨ uler, et al. Differential tissue sparing of FLASH ultra high dose rates: an in-silico study. arXiv preprint arXiv:2210.03565 , 2022
-
[22]
H. Liew, S. Mein, T. Tessonnier, A. Abdollahi, J. Debus, I. Dokic, et al. Do we preserve tumor control probability (TCP) in FLASH radiotherapy? A model-based an alysis. Int. J. Mol. Sci. , 24(6):5118, 2023
work page 2023
-
[23]
A. L. Van Slyke, M. El Khatib, A. Velalopoulou, E. Diffenderfer, K . Shoniyozov, M. M. Kim, et al. Oxygen monitoring in model solutions and in vivo in mice during prot on irradiation at conventional and FLASH dose rates. Radiat. Res., 198(2):181–189, 2022
work page 2022
- [24]
-
[25]
Partial Differential Equation Toolbox vers ion: 3.9 (R2022b), 2022
The MathWorks Inc. Partial Differential Equation Toolbox vers ion: 3.9 (R2022b), 2022
work page 2022
-
[26]
P. Rodr ´ ıguez-Barbeito, P. D ´ ıaz-Botana, A. Gago-Arias, M.Feijoo, S. Neira, J. Guiu-Souto, et al. A model of indirect cell death caused by tumor vascular damage aft er high-dose radiotherapy. Cancer Res., 79(23):6044–6053, 2019
work page 2019
-
[27]
I. Espinoza, P. Peschke, and C. P. Karger. A model to simulate the oxygen distribution in hypoxic tumors for different vascular architectures. Med. Phys., 40(8):081703, 2013
work page 2013
-
[28]
M. A. Konerding, E. Fait, and A. Gaumann. 3D microvascular arc hitecture of pre-cancerous lesions and invasive carcinomas of the colon. Br. J. Cancer , 84(10):1354–1362, 2001
work page 2001
-
[29]
J. F. Fowler. The linear-quadratic formula and progress in frac tionated radiotherapy. Br. J. Radiol., 62(740):679–694, 1989. 19
work page 1989
-
[30]
B. G. Wouters and J. M. Brown. Cells at intermediate oxygen leve ls can be more important than the “hypoxic fraction” in determining tumor response to frac tionated radiotherapy. Radiat. Res., 147(5):541–550, 1997
work page 1997
-
[31]
S. Webb and A. E. Nahum. A model for calculating tumour contro l probability in radiotherapy including the effects of inhomogeneous distributions of dose and clon ogenic cell density. Phys. Med. Biol., 38(6):653–666, 1993
work page 1993
-
[32]
H. Zhu, D. Xie, Y. Wang, R. Huang, X. Chen, Y. Yang, et al. Comp arison of intratumor and local immune response between MV X-ray FLASH and convention al radiotherapies. Clin. Transl. Radiat. Oncol., 38:138–146, 2023
work page 2023
-
[33]
S. Kirkpatrick, C. D. Gelatt Jr, and M. P. Vecchi. Optimization by Simulated Annealing. Science, 220(4598):671–680, 1983
work page 1983
-
[34]
C. S. Reichardt. Quasi-experimentation: A guide to design and analysis . Guilford Publications, 2019
work page 2019
- [35]
-
[36]
H. Zhu, J. Li, X. Deng, R. Qiu, Z. Wu, and H. Zhang. Modeling of ce llular response after FLASH irradiation: a quantitative analysis based on the radiolytic oxygen de pletion hypothesis. Phys. Med. Biol., 66(18):185009, 2021
work page 2021
- [37]
-
[38]
J. Bourhis, W. J. Sozzi, P. Gon¸ calves Jorge, O. Gaide, C. Bailat , F. Duclos, et al. Treatment of a first patient with FLASH-radiotherapy. Radiother. Oncol., 139:18–22, 2019
work page 2019
-
[39]
J. Bourhis, P. Montay-Gruel, P. Gon¸ calves Jorge, C. Bailat, B . Petit, J. Ollivier, et al. Clinical translation of FLASH radiotherapy: Why and how? Radiother. Oncol., 139:11–17, 2019
work page 2019
-
[40]
M. C. Vozenin, J. Bourhis, and M. Durante. Towards clinical tra nslation of FLASH radiother- apy. Nat. Rev. Clin. Oncol. , 19(12):791–803, 2022
work page 2022
- [41]
discussion (0)
Sign in with ORCID, Apple, or X to comment. Anyone can read and Pith papers without signing in.