Emergent poverty traps and inequality at multiple levels impedes social mobility
Pith reviewed 2026-05-23 07:41 UTC · model grok-4.3
The pith
Interactions between individual risk aversion and institutional segregation create persistent poverty traps that reduce social mobility.
A machine-rendered reading of the paper's core claim, the machinery that carries it, and where it could break.
Core claim
Poverty traps and inequality at multiple levels emerge from interactions between individual characteristics like risk aversion, attention, and saving propensity, which cause sub-optimal choices, and institutional mechanisms such as lack of financial inclusion, technology access, and economic segregation. Addressing these factors through coordinated interventions yields a double dividend by reducing poverty and inequality within and between communities while creating positive feedback loops that withstand external shocks.
What carries the argument
Agent-based simulations of multi-level interactions between behavioral parameters and institutional barriers.
Load-bearing premise
The parameters selected for individual behaviors and institutional conditions in the simulations reflect actual dynamics in real populations without being fitted to produce the reported poverty traps.
What would settle it
A real-world study finding no reduction in poverty traps after implementing changes to financial inclusion and segregation levels would challenge the claim.
Figures


read the original abstract
Eradicating extreme poverty and inequality are the key leverage points to achieve the seventeen Sustainable Development goals. Yet, the reduction in extreme poverty and inequality are vulnerable to shocks such as the pandemic and climate change. We find that that these vulnerabilities emerge from the interaction between individual and institutional mechanisms. Individual characteristics like risk aversion, attention, and saving propensity can lead to sub-optimal diversification and low capital accumulation. These individual drivers are reinforced by institutional mechanisms such as lack of financial inclusion, access to technology, and economic segregation, leading to persistent inequality and poverty traps. Our experiments demonstrate that addressing above factors yields 'double dividend' - reducing poverty and inequality within-and-between communities and create positive feedback that can withstand shocks.
Editorial analysis
A structured set of objections, weighed in public.
Referee Report
Summary. The manuscript claims that poverty traps and persistent inequality at individual and community levels arise from interactions between individual traits (risk aversion, attention, saving propensity leading to sub-optimal diversification and low capital accumulation) and institutional factors (lack of financial inclusion, technology access, and economic segregation). Simulation experiments are said to demonstrate that interventions addressing these factors produce a 'double dividend': reduced within- and between-community poverty and inequality, plus positive feedback loops that enhance resilience to shocks such as pandemics or climate events.
Significance. If the simulation framework were shown to be empirically grounded and robust, the work could usefully highlight multi-level feedback mechanisms relevant to SDG targets on poverty and inequality. The emphasis on joint individual-institutional drivers and shock resilience is a potentially valuable angle, but the absence of model specification, calibration, or validation prevents any assessment of whether the reported double-dividend outcome reflects real dynamics or parameterization choices.
major comments (3)
- [Abstract and simulation description] The abstract and main text describe simulation experiments demonstrating emergent poverty traps and a double dividend, yet no model equations, agent decision rules, or interaction mechanisms are supplied. Without these, it is impossible to evaluate how the listed parameters generate the claimed traps or the policy effects.
- [Simulation experiments] The free parameters governing risk aversion, saving propensity, financial inclusion, technology access, and segregation are presented without any empirical calibration, micro-data benchmarks, or sensitivity analysis. This directly undermines the central claim that addressing these factors produces robust reductions in inequality and shock resilience, as the outcomes may be artifacts of the chosen values.
- [Results and experiments] No validation against real-world data, out-of-sample tests, or robustness checks (e.g., alternative parameter ranges or shock specifications) are reported. The double-dividend result therefore cannot be distinguished from a parameterization chosen to illustrate persistent traps.
minor comments (1)
- [Abstract] The abstract refers to 'above factors' without a clear prior enumeration; a numbered list of the individual and institutional mechanisms would improve readability.
Simulated Author's Rebuttal
We thank the referee for the constructive comments, which highlight important areas for improving transparency and robustness in our simulation study. We agree that greater detail on the model and additional checks will strengthen the paper and will revise accordingly.
read point-by-point responses
-
Referee: [Abstract and simulation description] The abstract and main text describe simulation experiments demonstrating emergent poverty traps and a double dividend, yet no model equations, agent decision rules, or interaction mechanisms are supplied. Without these, it is impossible to evaluate how the listed parameters generate the claimed traps or the policy effects.
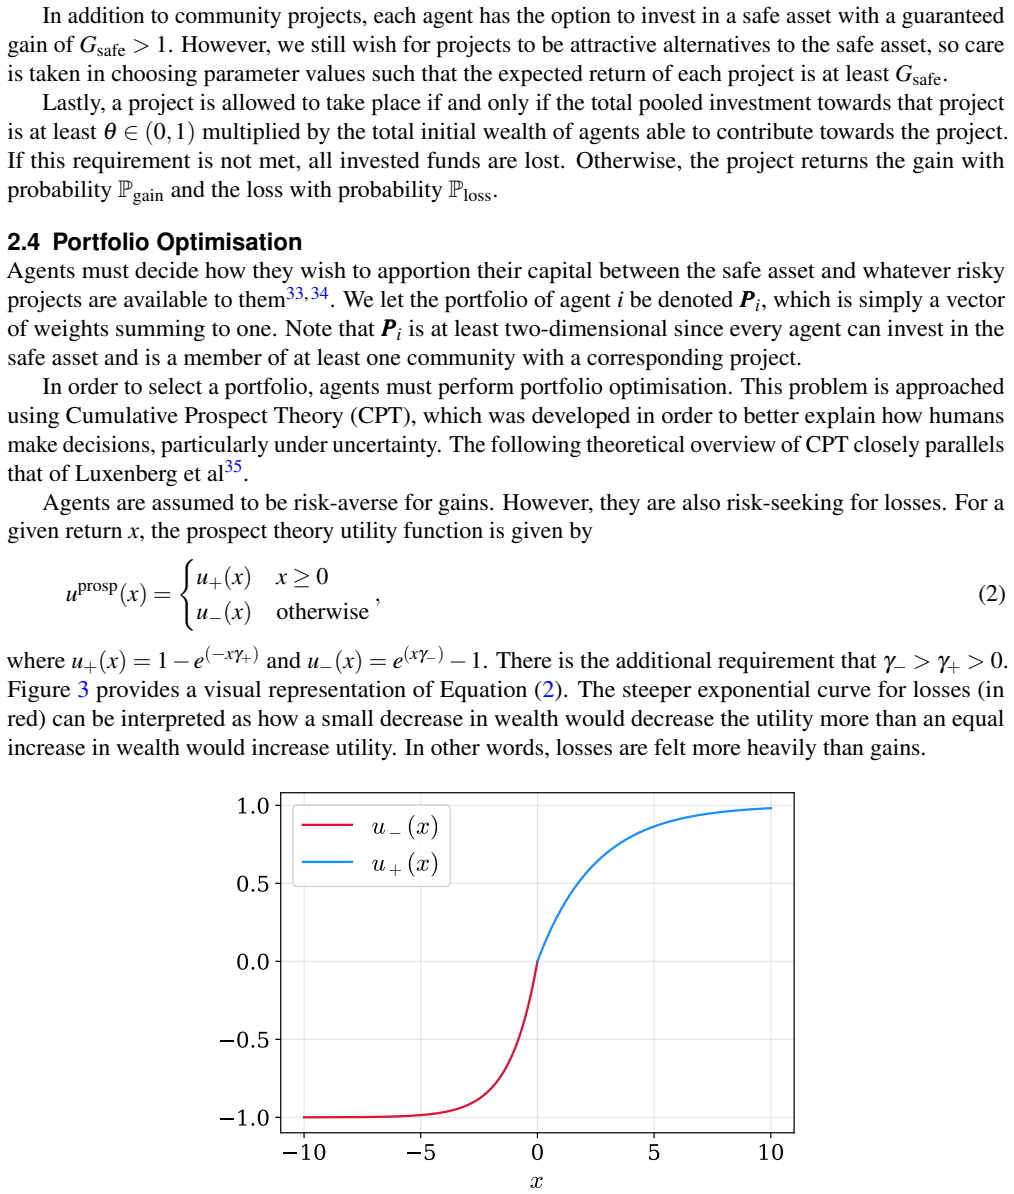
Authors: We agree that the current version lacks sufficient detail on the underlying model. In the revised manuscript, we will add a dedicated methods section presenting the agent decision rules (including how risk aversion, attention, and saving propensity determine portfolio choices and capital accumulation), the interaction mechanisms between individual traits and institutional factors (financial inclusion, technology access, and segregation), and the equations governing community-level dynamics. This will allow direct evaluation of how these generate the reported poverty traps and double-dividend outcomes. revision: yes
-
Referee: [Simulation experiments] The free parameters governing risk aversion, saving propensity, financial inclusion, technology access, and segregation are presented without any empirical calibration, micro-data benchmarks, or sensitivity analysis. This directly undermines the central claim that addressing these factors produces robust reductions in inequality and shock resilience, as the outcomes may be artifacts of the chosen values.
Authors: Parameter values were chosen to align with ranges documented in the behavioral and development economics literature. We will revise the manuscript to include explicit citations to micro-data sources (e.g., household surveys and field experiments) used to inform the ranges, along with a new sensitivity analysis section that varies each key parameter across plausible bounds and reports the resulting effects on inequality, poverty, and shock resilience to demonstrate that the double-dividend result is not an artifact of specific choices. revision: yes
-
Referee: [Results and experiments] No validation against real-world data, out-of-sample tests, or robustness checks (e.g., alternative parameter ranges or shock specifications) are reported. The double-dividend result therefore cannot be distinguished from a parameterization chosen to illustrate persistent traps.
Authors: We will add robustness checks in the revision, including alternative shock specifications (varying pandemic and climate event intensities) and expanded parameter sweeps. As this is a theoretical agent-based model focused on emergent mechanisms rather than empirical prediction, comprehensive out-of-sample validation against specific datasets was not performed; however, we will include qualitative alignment with patterns reported in the empirical literature on multi-level inequality to address concerns about parameterization artifacts. revision: partial
Circularity Check
No circularity: simulation outputs independent of input definitions
full rationale
The provided abstract and excerpts describe an agent-based simulation in which parameters for risk aversion, saving propensity, financial inclusion and segregation are set to run experiments that produce poverty traps and a 'double dividend' when addressed. No equations, self-citations, or fitted-input steps are quoted that reduce the reported outcomes to the inputs by construction (e.g., no parameter fitted to a subset of runs then relabeled as a prediction, no self-definitional loop, no uniqueness theorem imported from the authors' prior work). The derivation chain consists of forward simulation from chosen parameters; the results are therefore not equivalent to the inputs by definition and the paper is self-contained against external benchmarks for the purpose of this circularity check.
Axiom & Free-Parameter Ledger
free parameters (2)
- risk aversion, attention, saving propensity parameters
- financial inclusion, technology access, segregation parameters
axioms (1)
- domain assumption Agent-based models with parameterized individual and institutional rules can represent emergent poverty traps at multiple scales.
Reference graph
Works this paper leans on
-
[1]
Roser, M. & Ortiz-Ospina, E. Global extreme poverty. Our world data (2013)
work page 2013
-
[2]
Mirza, M. U., Richter, A., van Nes, E. H. & Scheffer, M. Technology driven inequality leads to poverty and resource depletion. Ecol. Econ. 160, 215–226 (2019)
work page 2019
-
[3]
Barrett, C. B. & Carter, M. R. The economics of poverty traps and persistent poverty: Empirical and policy implications. The J. Dev. Stud. 49, 976–990 (2013)
work page 2013
-
[4]
Barrett, C. B. & Swallow, B. M. Fractal poverty traps. World development 34, 1–15 (2006)
work page 2006
-
[5]
Adato, M., Carter, M. R. & May, J. Exploring poverty traps and social exclusion in south africa using qualitative and quantitative data. In Understanding and Reducing Persistent Poverty in Africa, 60–81 (Routledge, 2013)
work page 2013
-
[6]
Jalan, J. & Ravallion, M. Geographic poverty traps? a micro model of consumption growth in rural china. J. applied econometrics 17, 329–346 (2002)
work page 2002
-
[7]
Radosavljevic, S., Haider, L. J., Lade, S. J. & Schlüter, M. Implications of poverty traps across levels. World Dev. 144, 105437, DOI: https://doi.org/10.1016/j.worlddev.2021.105437 (2021)
-
[8]
Barrett, C. B., Carter, M. R. & Chavas, J.-P. The Economics of Poverty Traps. No. barr-3 in NBER Books (National Bureau of Economic Research, Inc, 2018)
work page 2018
-
[9]
Group, W. B. Lifting 800 million people out of poverty – new report looks at lessons from china’s experience (2022)
work page 2022
-
[10]
Xie, Y . & Zhou, X. Income inequality in today’s china.Proc. Natl. Acad. Sci. 111, 6928–6933, DOI: 10.1073/pnas.1403158111 (2014). https://www.pnas.org/doi/pdf/10.1073/pnas.1403158111
-
[11]
Rising inequality: A major issue of our time | Brookings — brookings.edu
Qureshi, Z. Rising inequality: A major issue of our time | Brookings — brookings.edu. https: //www.brookings.edu/articles/rising-inequality-a-major-issue-of-our-time/ (2023). [Accessed 16-08- 2023]
work page 2023
-
[12]
Roy, D. et al. Survey-based socio-economic data from slums in bangalore, india. Sci. data 5, 1–9 (2018)
work page 2018
-
[13]
Mutlu, A., Roy, D. & Filatova, T. Capitalized value of evolving flood risks discount and nature-based solution premiums on property prices. Ecol. Econ. 205, 107682 (2023)
work page 2023
-
[14]
Roy, D., Lees, M. H., Pfeffer, K. & Sloot, P. M. Spatial segregation, inequality, and opportunity bias in the slums of bengaluru. Cities 74, 269–276 (2018)
work page 2018
-
[15]
Stiglitz, J. E. Education and inequality. The Annals Am. Acad. Polit. Soc. Sci. 409, 135–145 (1973)
work page 1973
-
[16]
Galor, O. & Zeira, J. Income distribution and macroeconomics. The review economic studies 60, 35–52 (1993)
work page 1993
-
[17]
Goderis, B. & Malone, S. W. Natural resource booms and inequality: theory and evidence. Scand. J. Econ. 113, 388–417 (2011)
work page 2011
-
[18]
Aghion, P., Caroli, E. & Garcia-Penalosa, C. Inequality and economic growth: the perspective of the new growth theories. J. Econ. literature 37, 1615–1660 (1999)
work page 1999
-
[19]
Banerjee, A. V . & Newman, A. F. Risk-bearing and the theory of income distribution. The review economic studies 58, 211–235 (1991). 35/39
work page 1991
-
[20]
Aghion, P. & Bolton, P. Distribution and growth in models of imperfect capital markets.Eur. economic review 36, 603–611 (1992)
work page 1992
-
[21]
Chakraborti, A. & Chakrabarti, B. K. Statistical mechanics of money: how saving propensity affects its distribution. The Eur. Phys. J. B-Condensed Matter Complex Syst. 17, 167–170 (2000)
work page 2000
-
[22]
Banerjee, A. & Yakovenko, V . M. Universal patterns of inequality.New J. Phys. 12, 075032 (2010)
work page 2010
-
[23]
Chong, A. & Gradstein, M. Inequality and institutions. The review Econ. Stat. 89, 454–465 (2007)
work page 2007
-
[24]
Economic growth and income inequality
Kuznets, S. Economic growth and income inequality. In The gap between rich and poor , 25–37 (Routledge, 2019)
work page 2019
-
[25]
Pasinetti, L. L. Rate of profit and income distribution in relation to the rate of economic growth. The Rev. Econ. Stud. 29, 267–279 (1962)
work page 1962
-
[26]
Piketty, T. Putting distribution back at the center of economics: Reflections on capital in the twenty- first century. J. Econ. Perspectives 29, 67–88 (2015)
work page 2015
-
[27]
Making best use of model evaluations to compute sensitivity indices
Saltelli, A. Making best use of model evaluations to compute sensitivity indices. Comput. Phys. Commun. 145, 280–297, DOI: 10.1016/S0010-4655(02)00280-1 (2002)
-
[28]
McPherson, M., Smith-Lovin, L. & Cook, J. M. Birds of a feather: Homophily in social networks. Annu. Rev. Sociol. 27, 415–444, DOI: 10.1146/annurev.soc.27.1.415 (2001). https://doi.org/10.1146/ annurev.soc.27.1.415
-
[29]
Talaga, S. & Nowak, A. Homophily as a process generating social networks: Insights from social distance attachment model. J. Artif. Soc. Soc. Simul. 23, DOI: 10.18564/jasss.4252 (2020)
-
[30]
Radicchi, F., Castellano, C., Cecconi, F., Loreto, V . & Parisi, D. Defining and identifying communities in networks. Proc. Natl. Acad. Sci. 101, 2658–2663, DOI: 10.1073/pnas.0400054101 (2004). https: //www.pnas.org/doi/pdf/10.1073/pnas.0400054101
-
[31]
Cordasco, G. & Gargano, L. Community detection via semi-synchronous label propagation algorithms. 1 – 8, DOI: 10.1109/BASNA.2010.5730298 (2011)
-
[32]
Gonzales Martinez, R., D’Espallier, B. & Mersland, R. Bifurcations in business profitability: An agent-based simulation of homophily in self-financing groups. J. Bus. Res. 129, 495–514, DOI: https://doi.org/10.1016/j.jbusres.2020.06.051 (2021)
-
[33]
De Bruijn, E.-J. & Antonides, G. Poverty and economic decision making: a review of scarcity theory. Theory Decis. 92, 5–37 (2022)
work page 2022
- [34]
- [35]
-
[36]
Bazyleva, V ., Garibay, V . M. & Roy, D. Global sensitivity analysis using polynomial chaos expansion on the grassmann manifold. In Mikyška, J. et al. (eds.) Computational Science – ICCS 2023, 583–597 (Springer Nature Switzerland, Cham, 2023)
work page 2023
-
[37]
Bazyleva, V ., Garibay, V . M. & Roy, D. Trajectory-based global sensitivity analysis in multiscale models. Sci. Reports 14, 13902 (2024)
work page 2024
-
[38]
Park, C.-Y . & Mercado, R. Financial inclusion, poverty, and income inequality in developing asia. Asian Dev. Bank Econ. Work. Pap. Ser.(2015). 36/39
work page 2015
-
[39]
Omar, M. A. & Inaba, K. Does financial inclusion reduce poverty and income inequality in developing countries? a panel data analysis. J. economic structures 9, 37 (2020)
work page 2020
-
[40]
Banerjee, A. V . & Duflo, E. The economic lives of the poor.J. Econ. Perspectives 21, 141–168, DOI: 10.1257/jep.21.1.141 (2007)
-
[41]
Steinert, J. I. et al. Do saving promotion interventions increase household savings, consumption, and investments in sub-saharan africa? a systematic review and meta-analysis. World development 104, 238–256 (2018)
work page 2018
-
[42]
Karlan, D., Ratan, A. L. & Zinman, J. Savings by and for the poor: A research review and agenda. Rev. Income Wealth 60, 36–78 (2014)
work page 2014
-
[43]
Do, M. H. The role of savings and income diversification in households’ resilience strategies: Evidence from rural vietnam. Soc. Indic. Res. 168, 353–388 (2023)
work page 2023
-
[44]
Chetty, R. et al. Social capital i: measurement and associations with economic mobility. Nature 608, 108–121 (2022)
work page 2022
-
[45]
Pena-López, A., Rungo, P. & Sánchez-Santos, J. M. Inequality and individuals’ social networks: the other face of social capital. Camb. J. Econ. 45, 675–694 (2021)
work page 2021
-
[46]
Chantarat, S. & Barrett, C. B. Social network capital, economic mobility and poverty traps. The J. Econ. Inequal. 10, 299–342 (2012)
work page 2012
-
[47]
Tóth, G. et al. Inequality is rising where social network segregation interacts with urban topology. Nat. communications 12, 1143 (2021)
work page 2021
-
[48]
Yesuf, M. & Bluffstone, R. A. Poverty, risk aversion, and path dependence in low-income countries: Experimental evidence from ethiopia. Am. J. Agric. Econ. 91, 1022–1037 (2009)
work page 2009
-
[49]
Rosenzweig, M. R. & Binswanger, H. P. Wealth, weather risk and the composition and profitability of agricultural investments. The Econ. J. 103, 56–78 (1993)
work page 1993
-
[50]
Marcella, R. & Chowdhury, G. Eradicating information poverty: An agenda for research. J. Li- brariansh. Inf. Sci. 52, 366–381, DOI: 10.1177/0961000618804589 (2020). https://doi.org/10.1177/ 0961000618804589
-
[51]
Van Nieuwerburgh, S. & Veldkamp, L. Information acquisition and under-diversification.The Rev. Econ. Stud. 77, 779–805 (2010)
work page 2010
-
[52]
Capuano, A. & Ramsay, I. What causes suboptimal financial behaviour? an exploration of financial literacy, social influences and behavioural economics.An Explor. Financial Literacy, Soc. Influ. Behav. Econ. (March 23, 2011). U Melbourne Leg. Stud. Res. Pap.(2011)
work page 2011
-
[53]
Michler, J. D. & Josephson, A. L. To specialize or diversify: Agricultural diversity and poverty dynamics in ethiopia. World Dev. 89, 214–226 (2017)
work page 2017
-
[54]
Antonelli, C., Coromaldi, M. & Pallante, G. Crop and income diversification for rural adaptation: Insights from ugandan panel data. Ecol. Econ. 195, 107390 (2022)
work page 2022
-
[55]
Miao, Y . & Li, Z. The poverty alleviation effect of transfer payments: evidence from china.Humanit. Soc. Sci. Commun. 10, 910, DOI: 10.1057/s41599-023-02446-8 (2023)
-
[56]
Alfani, G. & Schifano, S. Wealth inequality in the long run (2021). 37/39
work page 2021
-
[58]
The Effect of Cash-based Interventions on Gender Outcomes in Development and Humanitarian Settings
Women, U. The Effect of Cash-based Interventions on Gender Outcomes in Development and Humanitarian Settings. UN Women Discussion Papers (UN, 2019)
work page 2019
-
[59]
Programme), U. U. N. D. 2023 global multidimensional poverty index (mpi). UNDP (United Nations Dev. Programme) (2023)
work page 2023
-
[60]
Atkinson, A. B. & Bourguignon, F. Handbook of income distribution (Elsevier, 2014)
work page 2014
- [61]
-
[62]
Atkinson, A. B. & Bourguignon, F. Income distribution and differences in needs. In Arrow and the Foundations of the Theory of Economic Policy, 350–370 (Springer, 1987)
work page 1987
-
[63]
The effect of economic growth on social structures
Bourguignon, F. The effect of economic growth on social structures. In Handbook of Economic Growth, vol. 1, 1701–1747 (Elsevier, 2005)
work page 2005
-
[64]
Deininger, K. & Squire, L. A new data set measuring income inequality. The World Bank Econ. Rev. 10, 565–591 (1996)
work page 1996
-
[65]
Trends in income inequality and its impact on economic growth
Cingano, F. Trends in income inequality and its impact on economic growth. OECD Social, Employ. Migr. Work. Pap.DOI: https://doi.org/https://doi.org/10.1787/5jxrjncwxv6j-en (2014)
-
[66]
The dynamics of the wealth distribution and the interest rate with credit rationing
Piketty, T. The dynamics of the wealth distribution and the interest rate with credit rationing. The Rev. Econ. Stud. 64, 173–189 (1997)
work page 1997
-
[67]
Fitoussi, J. P. & Saraceno, F. Europe: How deep is a crisis? policy responses and structural factors behind diverging performances. J. Glob. development 1 (2010)
work page 2010
-
[68]
Stiglitz, J. E. Macroeconomic fluctuations, inequality, and human development. In Macroeconomics and Human Development, 31–58 (Routledge, 2015)
work page 2015
-
[69]
Kumhof, M., Rancière, R. & Winant, P. Inequality, leverage, and crises. Am. economic review 105, 1217–1245 (2015)
work page 2015
-
[70]
Us growth, the housing market, and the distribution of income
Zezza, G. Us growth, the housing market, and the distribution of income. J. Post Keynes. Econ.30, 375–401 (2008)
work page 2008
-
[71]
Did inequality cause the us financial crisis? J
Van Treeck, T. Did inequality cause the us financial crisis? J. economic Surv. 28, 421–448 (2014)
work page 2014
-
[72]
Dosi, G., Fagiolo, G., Napoletano, M. & Roventini, A. Income distribution, credit and fiscal policies in an agent-based keynesian model. J. Econ. Dyn. Control. 37, 1598–1625 (2013)
work page 2013
-
[73]
Russo, A., Riccetti, L. & Gallegati, M. Increasing inequality, consumer credit and financial fragility in an agent based macroeconomic model. J. Evol. Econ. 26, 25–47 (2016)
work page 2016
-
[74]
Barrett, C. B., Carter, M. R. & Ikegami, M. Poverty traps and social protection. Available at SSRN 1141881 (2008)
work page 2008
-
[75]
Ikegami, M., Carter, M. R., Barrett, C. B. & Janzen, S. Poverty traps and the social protection paradox. In The economics of poverty traps, 223–256 (University of Chicago Press, 2017)
work page 2017
-
[76]
Lade, S. J., Haider, L. J., Engström, G. & Schlüter, M. Resilience offers escape from trapped thinking on poverty alleviation. Sci. Adv. 3, DOI: 10.1126/sciadv.1603043 (2017). https://advances.sciencemag. org/content/3/5/e1603043.full.pdf. 38/39
-
[77]
Brinkmann, K., Kübler, D., Liehr, S. & Buerkert, A. Agent-based modelling of the social-ecological nature of poverty traps in southwestern madagascar. Agric. Syst. 190, 103125, DOI: https://doi.org/10. 1016/j.agsy.2021.103125 (2021). 39/39
discussion (0)
Sign in with ORCID, Apple, or X to comment. Anyone can read and Pith papers without signing in.