The Early Maturity of High-Redshift Galaxies: Insights from sSFR, M/L and SFHs at z~7-14
Pith reviewed 2026-05-16 23:17 UTC · model grok-4.3
The pith
Galaxies at z=7-14 keep constant median sSFR and mass-to-light ratios, showing mature stellar populations only a few hundred million years after the Big Bang.
A machine-rendered reading of the paper's core claim, the machinery that carries it, and where it could break.
Core claim
Non-parametric modeling of star formation histories for 2420 candidates shows that median sSFR and M/L remain approximately constant from z~7 to z~14. The sample contains galaxies with low sSFR and high M/L up to z~10, indicating already-evolved stellar populations. Subset reconstruction finds that the highest-M/L objects at z~7-8 assembled most of their stars at least 500 Myr earlier, while z>11 galaxies followed stochastic histories with recent major growth episodes.
What carries the argument
Non-parametric star formation histories fitted to multi-band JWST photometry, used to extract specific star formation rate and stellar mass-to-light ratio for each galaxy.
Load-bearing premise
The constancy result assumes that no large undetected population of dust-enshrouded starbursts exists at these redshifts and biases the medians.
What would settle it
Deep infrared observations that uncover a substantial number of high-sSFR, dust-obscured galaxies at z>10 would raise the median sSFR and falsify the reported constancy.
Figures

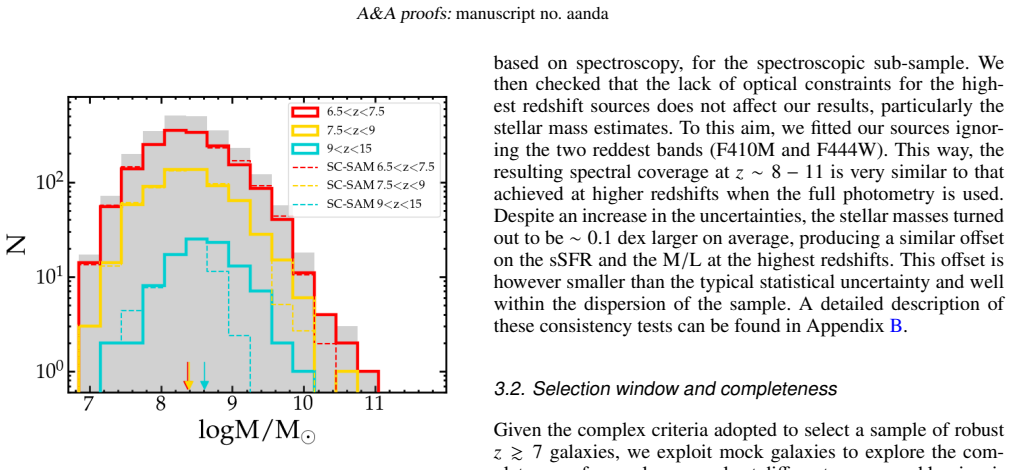

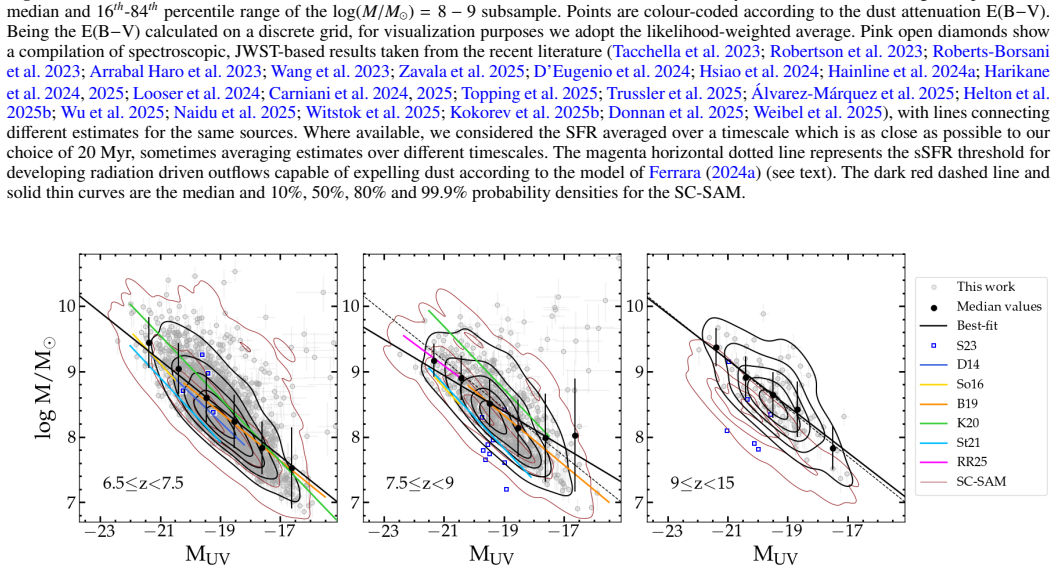
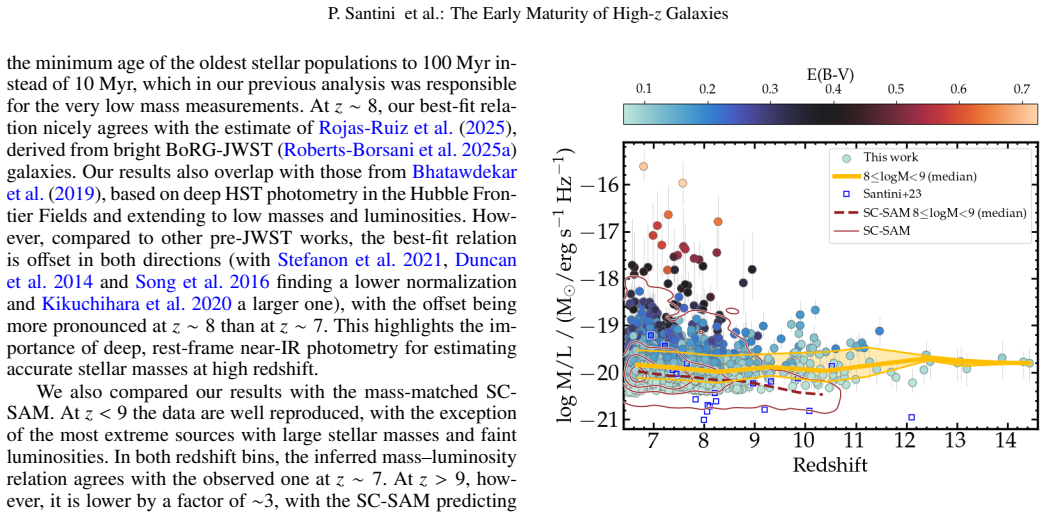


read the original abstract
The James Webb Space Telescope (JWST) has revealed an unexpected excess of UV-bright galaxies at z>10, unaccounted for by extrapolations from pre-JWST observations and theoretical models. Understanding the physical properties and star formation histories (SFHs) of high-redshift systems is key to distinguishing between the proposed scenarios. We identified and analysed a sample of 2420 robust candidates at z~7-14 drawn from the ASTRODEEP-JWST dataset over ~0.2 deg^2, and modelled their properties with non-parametric SFHs to derive the specific star formation rate (sSFR) and stellar population properties. We find that the median sSFR and M/L remain roughly constant across the probed redshift range. We show that this result is robust against potential systematics unless a hidden population of dust-enshrouded starbursts, undetectable in current data, exists at these redshifts. In any case, the absence of observed high-sSFR systems at the highest redshifts suggests that any dust-free starburst phase must be short-lived. The observed sSFR evolution is in tension with most theoretical models, making it a key quantity for discriminating among competing scenarios. The sample shows a wide range of physical conditions and galaxy classes, including systems with low sSFRs and high mass-to-light ratios (M/L) up to z~10, indicative of already-evolved galaxies only a few hundred Myr after the Big Bang, and different degrees of dust attenuation. We finally reconstructed the assembly histories of two sub-samples, namely the highest-M/L galaxies at z~7-8, which appear to have formed the bulk of their stars at least 500 Myr before observation, implying progenitors observable as UV-bright sources at z>20, and the full sample of z>11 galaxies, which formed through stochastic SFHs, remaining UV-faint for most of their early evolution, before undergoing recent (~50 Myr old) episodes of major growth.
Editorial analysis
A structured set of objections, weighed in public.
Referee Report
Summary. The paper analyzes 2420 robust galaxy candidates at z~7-14 from the ASTRODEEP-JWST dataset over ~0.2 deg². Non-parametric SFH modeling yields median sSFR and M/L ratios that remain roughly constant across the redshift range. The work identifies evolved systems with low sSFR and high M/L up to z~10, reconstructs assembly histories for the highest-M/L subsample at z~7-8 and the full z>11 sample, and reports tension with most theoretical models while noting robustness unless a hidden dust-enshrouded population exists.
Significance. If the central observational result holds, the paper supplies a valuable empirical benchmark for high-redshift galaxy evolution. The reported constancy of median sSFR and M/L, together with the presence of already-evolved systems only a few hundred Myr after the Big Bang, would tighten constraints on competing scenarios for the UV-bright galaxy excess and on the duration of any dust-free starburst phase.
major comments (3)
- [Abstract] Abstract and robustness discussion: the claim that results are robust 'unless a hidden population of dust-enshrouded starbursts exists' is not accompanied by a quantitative test. No estimate is given for the minimum fraction or bias amplitude of such a population that would be required to erase the flat median sSFR trend, nor is there an assessment of how the non-parametric priors suppress high-sSFR solutions at z>10.
- [SFH modeling] SFH modeling section: at z>10 the rest-frame UV-to-optical coverage is narrow and S/N modest; the paper does not report a dedicated test (e.g., mock recovery or prior-variation runs) of the age-dust degeneracy that could systematically lower recovered sSFR and flatten the observed trend. Without such a test the constancy result remains anchored only by the statement that no high-sSFR systems are observed.
- [Results] Results on median trends: the reported constancy of median sSFR and M/L lacks quoted uncertainties (bootstrap or jackknife) on the binned medians. This omission makes it difficult to judge whether the trend is statistically consistent with zero evolution or merely consistent within large errors.
minor comments (2)
- [Results] The abstract states the sample shows 'different degrees of dust attenuation' but the main text does not tabulate or plot the distribution of A_V values for the full sample or the high-M/L subsample.
- [Figures] Figure captions for the SFH reconstruction panels should explicitly state the time resolution and the number of galaxies in each sub-sample.
Simulated Author's Rebuttal
We thank the referee for the constructive and detailed report. The comments highlight important areas where additional quantitative support and statistical rigor can strengthen the manuscript. We address each major comment below and have revised the paper accordingly.
read point-by-point responses
-
Referee: [Abstract] Abstract and robustness discussion: the claim that results are robust 'unless a hidden population of dust-enshrouded starbursts exists' is not accompanied by a quantitative test. No estimate is given for the minimum fraction or bias amplitude of such a population that would be required to erase the flat median sSFR trend, nor is there an assessment of how the non-parametric priors suppress high-sSFR solutions at z>10.
Authors: We agree that the robustness statement benefits from quantitative support. In the revised manuscript we have added a new subsection that simulates the effect of a hidden dust-enshrouded population on the observed median sSFR trend. We derive the minimum fraction and bias amplitude required to erase the flat trend and explicitly discuss how the non-parametric priors affect recovery of high-sSFR solutions at z>10. These additions are now referenced in the abstract. revision: yes
-
Referee: [SFH modeling] SFH modeling section: at z>10 the rest-frame UV-to-optical coverage is narrow and S/N modest; the paper does not report a dedicated test (e.g., mock recovery or prior-variation runs) of the age-dust degeneracy that could systematically lower recovered sSFR and flatten the observed trend. Without such a test the constancy result remains anchored only by the statement that no high-sSFR systems are observed.
Authors: We acknowledge that the limited wavelength coverage at z>10 warrants explicit validation. We have performed additional mock recovery tests using simulated galaxies that span a range of ages, dust attenuations, and SFHs consistent with the observed photometry. These tests quantify the impact of the age-dust degeneracy on recovered sSFR values and demonstrate that any systematic bias is smaller than the observed scatter. The results of these tests are now included in the revised SFH modeling section. revision: yes
-
Referee: [Results] Results on median trends: the reported constancy of median sSFR and M/L lacks quoted uncertainties (bootstrap or jackknife) on the binned medians. This omission makes it difficult to judge whether the trend is statistically consistent with zero evolution or merely consistent within large errors.
Authors: We thank the referee for this observation. In the revised manuscript we have recomputed the binned medians with bootstrap uncertainties (1000 resamples) and now quote these errors on all median sSFR and M/L values. The updated figures and text show that the observed constancy remains statistically consistent with zero evolution within the reported uncertainties. revision: yes
Circularity Check
No circularity: medians computed directly from external photometry fits
full rationale
The central result (constant median sSFR and M/L from z~7-14) is obtained by applying standard non-parametric SFH codes to the independent ASTRODEEP-JWST photometric catalog. No equation defines a quantity in terms of itself, no fitted parameter is relabeled as a prediction, and no load-bearing premise rests on a self-citation whose content is unverified outside the present work. The robustness statement explicitly flags an external caveat (undetected dust-enshrouded population) rather than closing a definitional loop. The derivation chain therefore remains self-contained against the input data and modeling assumptions.
Axiom & Free-Parameter Ledger
axioms (1)
- domain assumption Non-parametric SFH modeling accurately recovers median trends even with limited photometric bands at high redshift
Lean theorems connected to this paper
-
IndisputableMonolith/Cost/FunctionalEquation.leanwashburn_uniqueness_aczel unclear?
unclearRelation between the paper passage and the cited Recognition theorem.
modelled their properties with non-parametric SFHs ... 8 time bins plus a most recent bin of fixed duration t0=20 Myr ... flat prior
-
IndisputableMonolith/Foundation/AlphaCoordinateFixation.leanJ_uniquely_calibrated_via_higher_derivative unclear?
unclearRelation between the paper passage and the cited Recognition theorem.
median sSFR and M/L remain roughly constant across the probed redshift range
What do these tags mean?
- matches
- The paper's claim is directly supported by a theorem in the formal canon.
- supports
- The theorem supports part of the paper's argument, but the paper may add assumptions or extra steps.
- extends
- The paper goes beyond the formal theorem; the theorem is a base layer rather than the whole result.
- uses
- The paper appears to rely on the theorem as machinery.
- contradicts
- The paper's claim conflicts with a theorem or certificate in the canon.
- unclear
- Pith found a possible connection, but the passage is too broad, indirect, or ambiguous to say the theorem truly supports the claim.
Forward citations
Cited by 2 Pith papers
-
Massive Galaxies Form Early and Gray: Stellar Assembly and Dust Attenuation at $\mathbf{z>3.5}$ from CAPERS
Massive galaxies at z>3.5 assembled stars earlier than theoretical models predict and exhibit gray dust attenuation, especially at the highest masses.
-
No Blue without Red: Evolutionary Properties of Super-Early Galaxies
Application of the Attenuation-Free Model to JWST super-early galaxies yields massive halos with moderate efficiencies and supports an evolutionary sequence from dust-reddened to UV-clear phases driven by outflows.
Reference graph
Works this paper leans on
-
[1]
G., Aguilar, J., Ahlen, S., et al
Adame, A. G., Aguilar, J., Ahlen, S., et al. 2025, J. Cosmology Astropart. Phys., 2025, 021 Álvarez-Márquez, J., Crespo Gómez, A., Colina, L., et al. 2025, A&A, 695, A250 Arrabal Haro, P., Dickinson, M., Finkelstein, S. L., et al. 2023, Nature, 622, 707 Bagley, M. B., Pirzkal, N., Finkelstein, S. L., et al. 2024, ApJ, 965, L6 Baker, W. M., Valentino, F., ...
-
[2]
characterised byτ main=10, 100, 500, 1000 Myr, plus a recent burst havingτburst=10, 25, 50 Myr and ageburst =5, 10, 50 Myr, with the mass fraction produced in the recent burst ranging from 0 to 60% (7 linearly spaced steps); in this case, we consider the SFR averaged over the last 10 Myr; g)a parametric delayed SFH as inf), but the flexibility is accounte...
work page 2017
-
[3]
B.1 show a simi- lar comparison for the sSFR and the mass-to-light ratio, respec- tively
The third and bottom row panels of Fig. B.1 show a simi- lar comparison for the sSFR and the mass-to-light ratio, respec- tively. An offset of∼0.1 dex in the opposite direction compared to the one for stellar mass is observed for the sSFR, suggesting that SFRs are not significantly affected by the lack of optical con- straints. A similar conclusion can be...
work page 2025
discussion (0)
Sign in with ORCID, Apple, or X to comment. Anyone can read and Pith papers without signing in.