Recognition: 2 theorem links
· Lean TheoremALMAGAL VIII. Early phases of triggered star formation in source AG286.0716-1.8229
Pith reviewed 2026-05-14 23:59 UTC · model grok-4.3
The pith
Nine cores in AG286.0716-1.8229, eight aligned along an arch, show separations and masses matching the collect-and-collapse scenario of triggered star formation.
A machine-rendered reading of the paper's core claim, the machinery that carries it, and where it could break.
Core claim
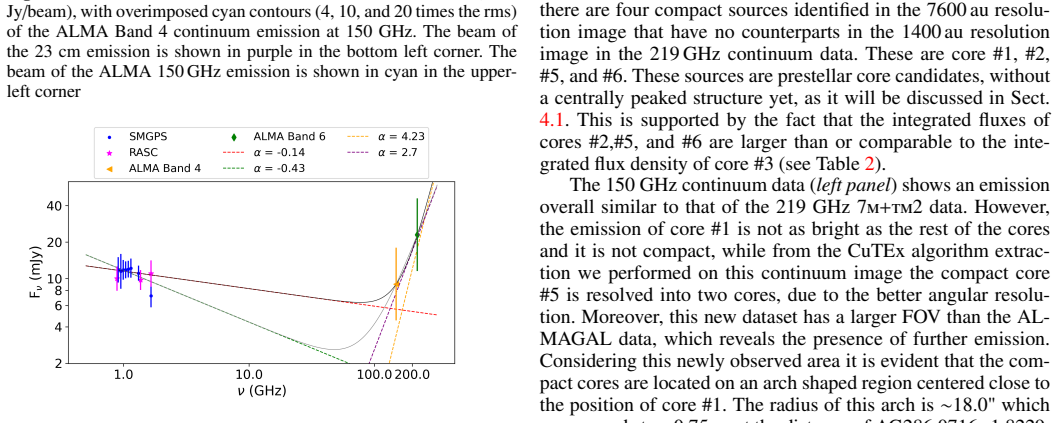
ALMA Band 4 observations of AG286.0716-1.8229 detect nine cores, eight of which lie along an arch surrounding a candidate H II region whose radio spectrum matches optically thin free-free emission. Using temperature bounds from molecular lines and continuum, the cores have masses 2-16 solar masses; all but one have virial parameters less than or equal to 2. The typical separation and mass of the arch cores agree most closely with the characteristic scales predicted by the collect-and-collapse mechanism of triggered star formation.
What carries the argument
The arch of eight cores surrounding the H II region, whose observed spacing and mass are compared against the analytic predictions of the collect-and-collapse shell-fragmentation model versus thermal Jeans fragmentation.
If this is right
- The four cores undetected at higher resolution remain prestellar candidates in an early phase of the star-formation sequence.
- Most cores along the arch are gravitationally bound and therefore likely to collapse further.
- An expanding H II region can collect and fragment molecular material into multiple bound cores on a 0.75 pc scale.
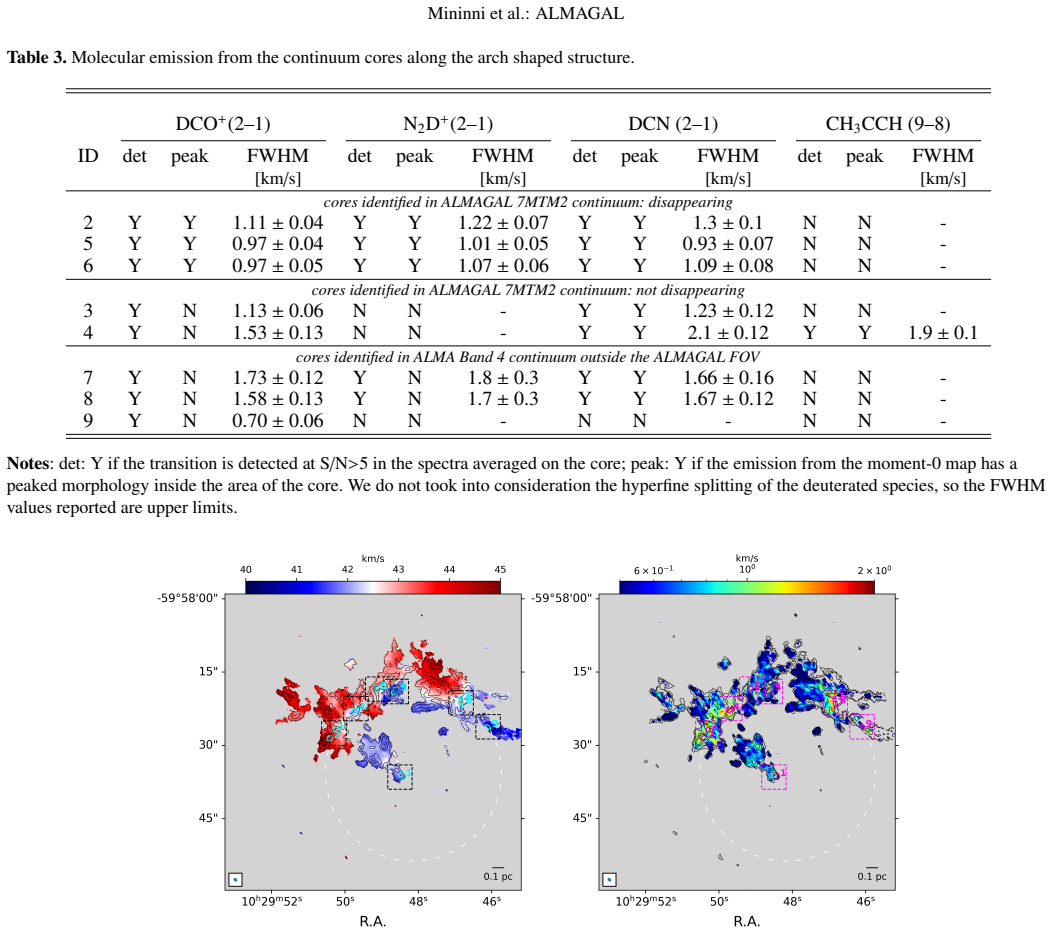
- The presence of DCO+, N2D+, and DCN emission indicates the cores are cold and chemically young.
Where Pith is reading between the lines
- If the arch geometry is confirmed by velocity data, similar structures in other high-mass regions could serve as signposts for the collect-and-collapse mode.
- Statistical comparison of core spacing distributions across the full ALMAGAL sample could quantify how frequently this triggered channel operates.
- Higher-resolution imaging of the detected cores would test whether any already contain embedded protostars, tightening the timeline of the triggering event.
Load-bearing premise
The arch alignment of the cores is produced by the causal expansion of the H II region rather than by projection or chance superposition.
What would settle it
Kinematic mapping showing that the cores lack the radial velocities expected for an expanding shell, or a new measurement of core separations that deviates significantly from collect-and-collapse predictions, would falsify the triggered-formation interpretation.
Figures


read the original abstract
Several theoretical and observational studies have shown that new waves of triggered star-formation can be induced by the feedback from newly formed massive protostars, due to the expansion of H II regions. We used the millimeter dust continuum data of the ALMAGAL survey and the Anderson et al. 2014 catalog of H II regions and selected one ALMAGAL source for ALMA follow-up observations. In fact, in source AG286.0716$-$1.8229 six cores were detected at a resolution of $\sim7600$ au, but only two at a higher resolution. The 4 cores not detected at higher resolution are prestellar core candidates. We used archival data from the SMGPS and RACS to confirm whether an H II region is present in the field. We observed the source with with ALMA in Band 4, covering the emission of DCO$^+$ (2$-$1), N$_2$D$^+$ (2$-$1), DCN (2$-$1), and CH$_3$CCH (9$-$8), to estimates whether these cores are in an early phase of the star-formation process. The new Band 4 continuum image revealed three cores outside of the ALMAGAL field of view, for a total of 9 cores in the region, 8 of which are located along an arch of radius $\sim0.75$ pc. We have derived a spectral index between -0.14 and -0.4, in the frequency range of 0.8-1.6 GHz for the candidate H II region, which is consistent with optically thin free-free emission. Using plausible temperature ranges, based on the information from chemical tracers and the dust continuum, we derived mass ranges for the cores ($\sim2-16\,$M$_{\odot}$) and ranges for the virial parameter ($\sim0.3-5$). All the cores along the arch have virial parameters $\lesssim$2, with only one exception. Comparing the typical separation and mass of the cores with those expected in the case of the collect and collapse scenario and with the thermal Jean length and mass, the best agreement is found with the characteristic scales in the case of triggered star formation.
Editorial analysis
A structured set of objections, weighed in public.
Referee Report
Summary. The manuscript presents ALMA Band 4 observations of ALMAGAL source AG286.0716−1.8229, detecting a total of nine dust cores (eight aligned along an arch of radius ~0.75 pc) after combining with prior lower-resolution data. Archival SMGPS and RACS radio data are used to identify a candidate H II region with spectral index −0.14 to −0.4 consistent with optically thin free-free emission. Core masses (2–16 M⊙) and virial parameters (mostly ≲2) are derived using temperature ranges informed by chemical tracers (DCO+, N2D+, DCN, CH3CCH) and dust continuum; the authors conclude that the observed core separations and masses show best agreement with the characteristic scales of the collect-and-collapse triggered star-formation scenario relative to thermal Jeans lengths and masses.
Significance. If the physical association between the cores and the H II region is robustly established, the work supplies a concrete observational example of early-phase triggered star formation at ~7600 au resolution, directly testing collect-and-collapse predictions against spontaneous Jeans fragmentation. The combination of high-resolution continuum, targeted line data, and multi-frequency radio constraints is a strength that could be leveraged for similar ALMAGAL sources.
major comments (3)
- [Results section describing the arch geometry and core positions] The central claim that the ~0.75 pc arch traces a swept-up shell (and therefore that core separations match collect-and-collapse scales) rests on geometry alone; no line-of-sight velocity information from the observed DCO+ (2−1), N2D+ (2−1), or DCN (2−1) lines is presented to demonstrate coherent expansion or physical association rather than projection or chance alignment.
- [Analysis of core masses and virial parameters] Masses and Jeans lengths/masses scale directly with the adopted temperature (via sound speed and density); the manuscript gives plausible ranges but provides neither explicit error propagation nor alternative opacity/temperature models, so it is unclear whether a modest shift (e.g., 5–10 K) would still place the observed values inside the collect-and-collapse regime.
- [Discussion comparing observed scales to theoretical predictions] The statement that the data show “best agreement” with collect-and-collapse scales lacks a quantitative metric (overlap fraction, reduced χ², or Monte Carlo test of random alignment probability within the field); without such a test the preference over spontaneous formation remains qualitative.
minor comments (2)
- The abstract states six cores were detected at ~7600 au resolution but only two at higher resolution, then reports three additional cores outside the original field for a total of nine; a single consolidated table listing all nine cores with their detection status, coordinates, and derived properties would improve clarity.
- The virial-parameter range 0.3–5 is reported without the explicit formula or the precise velocity-dispersion measurement used; adding the equation and the line-width values for each core would allow readers to reproduce the bound/unbound classification.
Simulated Author's Rebuttal
We thank the referee for their constructive and detailed review of our manuscript. We have addressed each major comment point by point below, providing the strongest honest response possible. Revisions to the manuscript have been made where the comments can be directly incorporated through additional analysis or discussion.
read point-by-point responses
-
Referee: The central claim that the ~0.75 pc arch traces a swept-up shell (and therefore that core separations match collect-and-collapse scales) rests on geometry alone; no line-of-sight velocity information from the observed DCO+ (2−1), N2D+ (2−1), or DCN (2−1) lines is presented to demonstrate coherent expansion or physical association rather than projection or chance alignment.
Authors: We acknowledge that kinematic confirmation of expansion would strengthen the physical association argument. The dense-gas tracers in our Band 4 data primarily highlight the cores themselves and do not exhibit a clear large-scale velocity gradient or coherent expansion signature across the arch. In the revised manuscript we have expanded the discussion to explicitly note this limitation, emphasize that the geometric alignment with the candidate H II region (supported by the radio spectral index) remains the primary evidence, and recommend future higher-sensitivity line observations to map any shell expansion. No new velocity data can be added from the existing observations. revision: partial
-
Referee: Masses and Jeans lengths/masses scale directly with the adopted temperature (via sound speed and density); the manuscript gives plausible ranges but provides neither explicit error propagation nor alternative opacity/temperature models, so it is unclear whether a modest shift (e.g., 5–10 K) would still place the observed values inside the collect-and-collapse regime.
Authors: We agree that a more quantitative treatment of temperature uncertainties is warranted. The revised analysis section now includes explicit propagation of temperature uncertainties (derived from the DCO+, N2D+, DCN, and CH3CCH lines plus continuum) into core masses, virial parameters, and Jeans lengths/masses. We additionally tested an alternative uniform-temperature model at 25 K. Even under this shift the observed core separations (0.1–0.2 pc) and masses remain closer to the collect-and-collapse fragment scales predicted by the Whitworth et al. framework than to the thermal Jeans values, although the distinction narrows. These results and the associated error bars are now shown in updated figures and tables. revision: yes
-
Referee: The statement that the data show “best agreement” with collect-and-collapse scales lacks a quantitative metric (overlap fraction, reduced χ², or Monte Carlo test of random alignment probability within the field); without such a test the preference over spontaneous formation remains qualitative.
Authors: We have added a Monte Carlo test in the revised discussion to quantify the likelihood of the observed configuration arising by chance. Drawing 9 cores randomly within the ALMA primary beam, the probability of obtaining an arch-like alignment of 8 cores with the observed spacing and radius is <3 %. We also directly compare the measured separations and masses to the analytic collect-and-collapse fragment scales and to the Jeans predictions, demonstrating that the data lie within the triggered-formation regime even after accounting for the temperature range. These quantitative results have been incorporated into the text and a new supplementary figure. revision: yes
Circularity Check
No significant circularity; core scales measured independently and compared to external theoretical benchmarks
full rationale
The paper derives core positions, separations (~0.75 pc arch), masses (2-16 M⊙), and virial parameters directly from ALMA Band 4 continuum and line data plus archival SMGPS/RACS radio observations. Temperature ranges are taken from chemical tracers (DCO+, N2D+, DCN, CH3CCH) and dust continuum; the H II region is confirmed via spectral index (-0.14 to -0.4). The central claim compares these observed quantities to standard collect-and-collapse shell-fragmentation scales and thermal Jeans length/mass from external theory, without fitting any parameter to the target dataset or reducing the conclusion to a self-citation chain. The derivation chain is therefore self-contained against independent inputs and external models.
Axiom & Free-Parameter Ledger
free parameters (1)
- core temperature ranges
axioms (2)
- domain assumption Dust opacity and gas-to-dust ratio assumptions standard in millimeter continuum analysis
- domain assumption Virial parameter calculation assumes spherical geometry and uniform density
Lean theorems connected to this paper
-
IndisputableMonolith/Foundation/RealityFromDistinction.leanreality_from_one_distinction unclear?
unclearRelation between the paper passage and the cited Recognition theorem.
Comparing the typical separation and mass of the cores with those expected in the case of the collect and collapse scenario and with the thermal Jean length and mass, the best agreement is found with the characteristic scales in the case of triggered star formation.
-
IndisputableMonolith/Cost/FunctionalEquation.leanwashburn_uniqueness_aczel unclear?
unclearRelation between the paper passage and the cited Recognition theorem.
Using plausible temperature ranges... we derived mass ranges for the cores (~2-16 M⊙) and ranges for the virial parameter (~0.3-5).
What do these tags mean?
- matches
- The paper's claim is directly supported by a theorem in the formal canon.
- supports
- The theorem supports part of the paper's argument, but the paper may add assumptions or extra steps.
- extends
- The paper goes beyond the formal theorem; the theorem is a base layer rather than the whole result.
- uses
- The paper appears to rely on the theorem as machinery.
- contradicts
- The paper's claim conflicts with a theorem or certificate in the canon.
- unclear
- Pith found a possible connection, but the passage is too broad, indirect, or ambiguous to say the theorem truly supports the claim.
Reference graph
Works this paper leans on
- [1]
-
[2]
Arce, H. G., Borkin, M. A., Goodman, A. A., Pineda, J. E., & Beaumont, C. N. 2011, ApJ, 742, 105
work page 2011
-
[3]
Balser, D. S., Rood, R. T., Bania, T. M., & Anderson, L. D. 2011, ApJ, 738, 27
work page 2011
- [4]
- [5]
-
[6]
Bonnor, W. B. 1956, MNRAS, 116, 351
work page 1956
-
[7]
M., Bjarnov, E., & Schwendeman, R
Burrell, P. M., Bjarnov, E., & Schwendeman, R. H. 1980, Journal of Molecular Spectroscopy, 82, 193
work page 1980
- [8]
- [9]
- [10]
-
[11]
Coletta, A., Molinari, S., Schisano, E., et al. 2025, A&A, 696, A151
work page 2025
-
[12]
Cunningham, N., Ginsburg, A., Galván-Madrid, R., et al. 2023, A&A, 678, A194
work page 2023
-
[13]
Dale, J. E., Bonnell, I. A., & Whitworth, A. P. 2007, MNRAS, 375, 1291
work page 2007
-
[14]
Deharveng, L., Lefloch, B., Kurtz, S., et al. 2008, A&A, 482, 585
work page 2008
-
[15]
Duchesne, S., Ross, K., Thomson, A. J. M., et al. 2025, PASA, 42, 38
work page 2025
-
[16]
Duchesne, S. W., Grundy, J. A., Heald, G. H., et al. 2024, PASA, 41, e003
work page 2024
- [17]
-
[18]
Elia, D., Merello, M., Molinari, S., et al. 2021, MNRAS, 504, 2742
work page 2021
-
[19]
Elmegreen, B. G. & Lada, C. J. 1977, ApJ, 214, 725
work page 1977
-
[20]
P., Schlemmer, S., Schilke, P., Stutzki, J., & Müller, H
Endres, C. P., Schlemmer, S., Schilke, P., Stutzki, J., & Müller, H. S. P. 2016, Journal of Molecular Spectroscopy, 327, 95
work page 2016
- [21]
-
[22]
Fontani, F., Palau, A., Busquet, G., et al. 2012, MNRAS, 423, 1691
work page 2012
- [23]
-
[24]
Fontani, F., Sakai, T., Furuya, K., et al. 2014, MNRAS, 440, 448
work page 2014
-
[25]
Giannetti, A., Leurini, S., König, C., et al. 2017, A&A, 606, L12
work page 2017
- [26]
-
[27]
Goedhart, S., Cotton, W. D., Camilo, F., et al. 2024, MNRAS, 531, 649
work page 2024
-
[28]
Hale, C. L., McConnell, D., Thomson, A. J. M., et al. 2021, PASA, 38, e058
work page 2021
- [29]
- [30]
-
[31]
Hunter, T. R., Indebetouw, R., Brogan, C. L., & et al. 2023, Publications of the Astronomical Society of the Pacific, 135, 074501
work page 2023
-
[32]
Kauffmann, J., Pillai, T., & Goldsmith, P. F. 2013, ApJ, 779, 185
work page 2013
-
[33]
Kendrew, S., Beuther, H., Simpson, R., et al. 2016, ApJ, 825, 142
work page 2016
- [34]
- [35]
-
[36]
Kim, W.-J., Beuther, H., Wyrowski, F., et al. 2025, A&A, 694, A30
work page 2025
- [37]
-
[38]
2002, in Astronomical Society of the Pacific Conference Series, V ol
Kurtz, S. 2002, in Astronomical Society of the Pacific Conference Series, V ol. 267, Hot Star Workshop III: The Earliest Phases of Massive Star Birth, ed. P. Crowther, 81
work page 2002
-
[39]
2015, ApJ, 798, 30 Martín, S., Martín-Pintado, J., Blanco-Sánchez, C., et al
Liu, H.-L., Wu, Y ., Li, J., et al. 2015, ApJ, 798, 30 Martín, S., Martín-Pintado, J., Blanco-Sánchez, C., et al. 2019, A&A, 631, A159
work page 2015
-
[40]
Matsakis, D. N., Evans, II, N. J., Sato, T., & Zuckerman, B. 1976, AJ, 81, 172
work page 1976
-
[41]
McConnell, D., Hale, C. L., Lenc, E., et al. 2020, PASA, 37, e048
work page 2020
-
[42]
Millar, T. J., Bennett, A., & Herbst, E. 1989, ApJ, 340, 906
work page 1989
- [43]
-
[44]
Molinari, S., Schilke, P., Battersby, C., et al. 2025, A&A, 696, A149
work page 2025
-
[45]
Molinari, S., Schisano, E., Faustini, F., et al. 2011, A&A, 530, A133
work page 2011
-
[46]
Molinari, S., Schisano, E., Faustini, F., et al. 2017, CUTEX: CUrvature Thresh- olding EXtractor, Astrophysics Source Code Library, record ascl:1708.018 Müller, H. S. P., Pracna, P., & Horneman, V .-M. 2002, Journal of Molecular Spectroscopy, 216, 397 Müller, H. S. P., Thorwirth, S., Bizzocchi, L., & Winnewisser, G. 2000, Zeitschrift Naturforschung Teil A...
work page 2017
- [47]
-
[48]
2009, A&A, 508, 737 Planck Collaboration, Abergel, A., Ade, P
Parise, B., Leurini, S., Schilke, P., et al. 2009, A&A, 508, 737 Planck Collaboration, Abergel, A., Ade, P. A. R., et al. 2014, A&A, 571, A11
work page 2009
-
[49]
Redaelli, E., Bovino, S., Giannetti, A., et al. 2021, A&A, 650, A202
work page 2021
- [50]
-
[51]
2021, A&A, 652, A71 Sánchez-Monge, Á., Brogan, C
Sabatini, G., Bovino, S., Giannetti, A., et al. 2021, A&A, 652, A71 Sánchez-Monge, Á., Brogan, C. L., Hunter, T. R., et al. 2025, A&A, 696, A150
work page 2021
-
[52]
2025, arXiv e-prints, arXiv:2512.05914
Schisano, E., Molinari, S., Coletta, A., et al. 2025, arXiv e-prints, arXiv:2512.05914
-
[53]
P., Panwar, N., Sun, Y ., & Gao, Y
Sharma, T., Chen, W. P., Panwar, N., Sun, Y ., & Gao, Y . 2022, ApJ, 928, 17
work page 2022
- [54]
-
[55]
Tackenberg, J., Beuther, H., Plume, R., et al. 2013, A&A, 550, A116
work page 2013
-
[56]
Thompson, M. A., Urquhart, J. S., Moore, T. J. T., & Morgan, L. K. 2012, MN- RAS, 421, 408
work page 2012
-
[57]
Walch, S., Whitworth, A. P., Bisbas, T. G., Hubber, D. A., & Wünsch, R. 2015, MNRAS, 452, 2794
work page 2015
-
[58]
–., Comrie, A., Harris, P., et al
Wang, K. –., Comrie, A., Harris, P., et al. 2020, in Astronomical Society of the Pacific Conference Series, V ol. 527, Astronomical Data Analysis Software and Systems XXIX, ed. R. Pizzo, E. R. Deul, J. D. Mol, J. de Plaa, & H. Verk- outer, 213
work page 2020
- [59]
-
[60]
Weingartner, J. C. & Draine, B. T. 2001, ApJ, 548, 296
work page 2001
-
[61]
2011, Deep GLIMPSE: Ex- ploring the Far Side of the Galaxy, Spitzer Proposal ID #80074
Whitney, B., Benjamin, R., Churchwell, E., et al. 2011, Deep GLIMPSE: Ex- ploring the Far Side of the Galaxy, Spitzer Proposal ID #80074
work page 2011
-
[62]
Whitworth, A. P., Bhattal, A. S., Chapman, S. J., Disney, M. J., & Turner, J. A. 1994, MNRAS, 268, 291
work page 1994
-
[63]
Zavagno, A., Deharveng, L., Comerón, F., et al. 2006, A&A, 446, 171
work page 2006
-
[64]
Zavagno, A., Pomarès, M., Deharveng, L., et al. 2007, A&A, 472, 835
work page 2007
- [65]
-
[66]
2024, MNRAS, 535, 1364 Article number, page 12 of 16 Mininni et al.: ALMAGAL
Zhang, S., Liu, T., Wang, K., et al. 2024, MNRAS, 535, 1364 Article number, page 12 of 16 Mininni et al.: ALMAGAL
work page 2024
-
[67]
Zhou, J., Zhou, D., Esimbek, J., et al. 2020, ApJ, 897, 74 1 INAF-Istituto di Astrofisica e Planetologia Spaziale, Via Fosso del Cavaliere 100, I-00133 Roma, Italy 2 I. Physikalisches Institut, Universität zu Köln, Zülpicher Str. 77, D- 50937 Köln, Germany 3 Max-Planck-Institut für Radioastronomie, Auf dem Hügel 69, 53121 Bonn, Germany 4 INAF-Osservatorio...
work page 2020
-
[68]
Yuseong-gu, Daejeon 34055, Republic of Korea 30 University of Science and Technology, Korea (UST), 217 Gajeong- ro, Yuseong-gu, Daejeon 34113, Republic of Korea 31 UK Astronomy Technology Centre, Royal Observatory Edinburgh, Blackford Hill, Edinburgh EH9 3HJ, UK 32 Faculty of Physics, University of Duisburg-Essen, Lotharstraße 1, D-47057 Duisburg, Germany...
work page 2014
discussion (0)
Sign in with ORCID, Apple, or X to comment. Anyone can read and Pith papers without signing in.