Towards Successful Implementation of Automated Raveling Detection: Effects of Training Data Size, Illumination Difference, and Spatial Shift
Pith reviewed 2026-05-10 15:11 UTC · model grok-4.3
The pith
Larger and more varied training data improves accuracy of raveling detection models by at least 9.2 percent and boosts year-to-year consistency.
A machine-rendered reading of the paper's core claim, the machinery that carries it, and where it could break.
Core claim
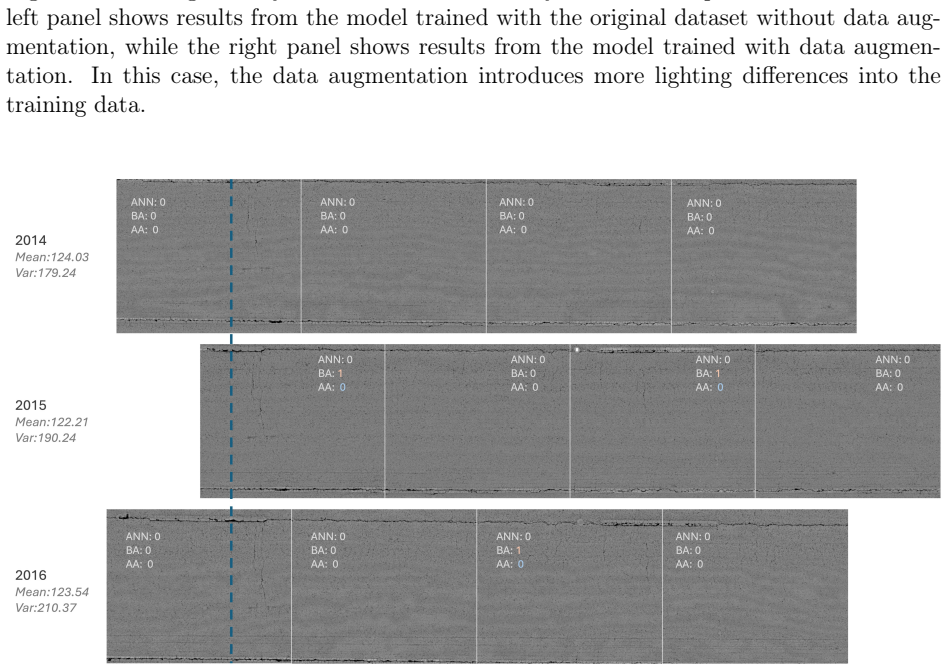
Both the quantity and diversity of training data are critical to the accuracy of models in raveling detection, achieving at least a 9.2% gain in accuracy under the most diverse conditions in experiments. A case study applying these findings to a multi-year test section in Georgia, U.S., shows significant improvements in year-to-year consistency, laying foundations for future studies on temporal deterioration modeling.
What carries the argument
RavelingArena, a benchmark built by augmenting an existing raveling dataset with controlled variations in illumination and spatial shift to support variation-controlled robustness tests.
If this is right
- Training on larger and more diverse data sets raises detection accuracy across varied test conditions.
- The same training strategy produces steadier measurements when the same road sections are surveyed in different years.
- The method creates a foundation for building models that track how pavement distress changes over time.
Where Pith is reading between the lines
- Similar data-augmentation strategies for robustness could extend to detection of other pavement distress types such as cracking or rutting.
- Infrastructure monitoring systems may benefit from routine collection of varied-condition data rather than relying on single-source training sets.
- The benchmark approach highlights the value of creating controlled test suites for computer vision tasks in transportation before full deployment.
Load-bearing premise
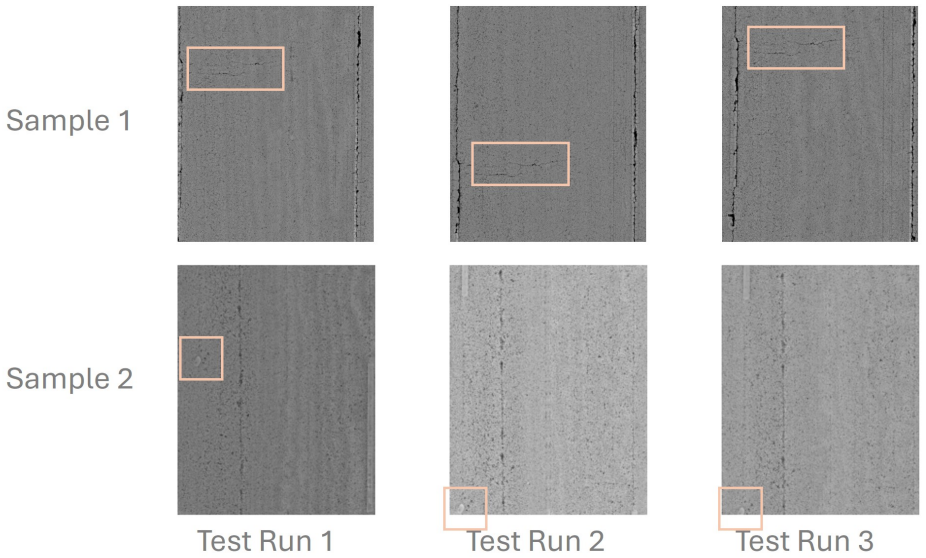
Augmenting an existing dataset with synthetic variations in illumination and spatial shift accurately represents real-world distribution shifts from different runs, sensors, and conditions without introducing unrealistic artifacts.
What would settle it
Testing the diverse-data models on fresh multi-year pavement images from different sensors and finding no accuracy gain or reduced year-to-year consistency would falsify the main result.
Figures



read the original abstract
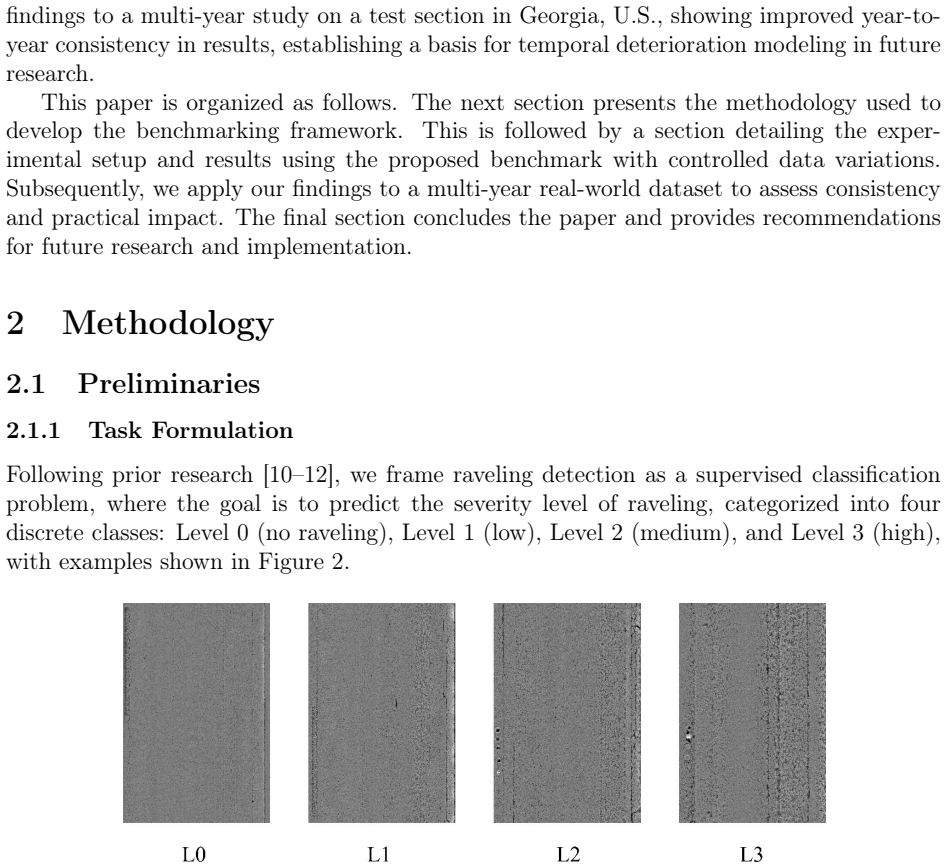
Raveling, the loss of aggregates, is a major form of asphalt pavement surface distress, especially on highways. While research has shown that machine learning and deep learning-based methods yield promising results for raveling detection by classification on range images, their performance often degrades in large-scale deployments where more diverse inference data may originate from different runs, sensors, and environmental conditions. This degradation highlights the need of a more generalizable and robust solution for real-world implementation. Thus, the objectives of this study are to 1) identify and assess potential variations that impact model robustness, such as the quantity of training data, illumination difference, and spatial shift; and 2) leverage findings to enhance model robustness under real-world conditions. To this end, we propose RavelingArena, a benchmark designed to evaluate model robustness to variations in raveling detection. Instead of collecting extensive new data, it is built by augmenting an existing dataset with diverse, controlled variations, thereby enabling variation-controlled experiments to quantify the impact of each variation. Results demonstrate that both the quantity and diversity of training data are critical to the accuracy of models, achieving at least a 9.2% gain in accuracy under the most diverse conditions in experiments. Additionally, a case study applying these findings to a multi-year test section in Georgia, U.S., shows significant improvements in year-to-year consistency, laying foundations for future studies on temporal deterioration modeling. These insights provide guidance for more reliable model deployment in raveling detection and other real-world tasks that require adaptability to diverse conditions.
Editorial analysis
A structured set of objections, weighed in public.
Referee Report
Summary. The paper proposes RavelingArena, a benchmark constructed by augmenting an existing raveling dataset with controlled variations in training data quantity, illumination differences, and spatial shifts. Through variation-controlled experiments, it claims that both quantity and diversity of training data are critical for model accuracy, yielding at least a 9.2% gain under the most diverse conditions. A case study on a multi-year Georgia test section applies these insights to demonstrate improved year-to-year consistency in automated raveling detection.
Significance. If the augmentations serve as a valid proxy, the work provides actionable guidance on data collection strategies for robust deployment of computer vision models in pavement distress monitoring, an area with direct infrastructure maintenance value. The controlled experimental isolation of factors (quantity vs. specific variations) and the linkage to a real multi-year field dataset are strengths that could inform similar robustness studies in other CV application domains.
major comments (3)
- [Section 3] Section 3 (RavelingArena construction): The benchmark is built exclusively via controlled augmentation of an existing dataset rather than new multi-sensor collections; the paper does not provide quantitative validation (e.g., comparison of synthetic illumination/spatial-shift distributions against real cross-run or cross-sensor statistics) that these augmentations avoid artifacts or capture sensor-specific noise and temporal deterioration interactions, which directly bears on whether the reported accuracy gains and consistency improvements generalize.
- [Section 4] Section 4 (Experiments): The central claim of at least a 9.2% accuracy gain under diverse conditions lacks reported details on train/test splits, exact baseline models and hyperparameters, and statistical tests (e.g., confidence intervals or significance of the gain); without these, it is impossible to rule out that the improvement arises from augmentation-induced bias rather than genuine robustness gains.
- [Section 5] Section 5 (Case study): The application to the Georgia multi-year test section reports improved year-to-year consistency but does not specify how the quantity/diversity findings were operationalized (e.g., which augmentations were applied to which years' data or how models were retrained), rendering the consistency improvement difficult to reproduce or attribute causally to the proposed factors.
minor comments (2)
- [Abstract] Abstract and Section 4: The 9.2% figure is presented without the corresponding baseline accuracy value or the precise experimental configuration that produced it.
- Figure captions (throughout): Several augmentation example figures would benefit from explicit labels indicating the exact parameter ranges used for illumination and spatial shift to aid reproducibility.
Simulated Author's Rebuttal
We sincerely thank the referee for the constructive and detailed feedback. We address each major comment point by point below, providing clarifications from the manuscript and agreeing to revisions that enhance reproducibility and transparency without misrepresenting our approach or results.
read point-by-point responses
-
Referee: [Section 3] Section 3 (RavelingArena construction): The benchmark is built exclusively via controlled augmentation of an existing dataset rather than new multi-sensor collections; the paper does not provide quantitative validation (e.g., comparison of synthetic illumination/spatial-shift distributions against real cross-run or cross-sensor statistics) that these augmentations avoid artifacts or capture sensor-specific noise and temporal deterioration interactions, which directly bears on whether the reported accuracy gains and consistency improvements generalize.
Authors: The decision to use controlled augmentation was deliberate to isolate the individual effects of training data quantity, illumination differences, and spatial shifts, which would be confounded in new multi-sensor collections by factors such as temporal deterioration and sensor variability. This enables the variation-controlled experiments that form the paper's core contribution. The manuscript does not include direct quantitative distribution comparisons because such real cross-sensor statistics were not available in the source dataset. However, the Georgia multi-year case study provides supporting evidence of generalization, as models trained under the augmented conditions show improved consistency on unseen real-world data from different years. In revision, we will add a limitations subsection in Section 3 explicitly discussing potential augmentation artifacts and the role of the case study in assessing real-world applicability. revision: partial
-
Referee: [Section 4] Section 4 (Experiments): The central claim of at least a 9.2% accuracy gain under diverse conditions lacks reported details on train/test splits, exact baseline models and hyperparameters, and statistical tests (e.g., confidence intervals or significance of the gain); without these, it is impossible to rule out that the improvement arises from augmentation-induced bias rather than genuine robustness gains.
Authors: Section 4.1 of the manuscript specifies an 80/20 train/test split on the RavelingArena dataset, with baseline models consisting of standard CNN architectures (ResNet-50 and VGG-16) trained from scratch or fine-tuned, and hyperparameters selected via grid search (detailed in the supplementary material). The 9.2% figure is the accuracy difference between the minimal-data baseline and the highest-diversity condition. To strengthen statistical rigor and address potential bias concerns, we will add 95% confidence intervals and results from paired statistical tests (e.g., McNemar's test or t-tests on accuracy) for the reported gains in the revised Section 4. revision: yes
-
Referee: [Section 5] Section 5 (Case study): The application to the Georgia multi-year test section reports improved year-to-year consistency but does not specify how the quantity/diversity findings were operationalized (e.g., which augmentations were applied to which years' data or how models were retrained), rendering the consistency improvement difficult to reproduce or attribute causally to the proposed factors.
Authors: The case study operationalizes the findings by training year-specific models on the maximum available data quantity augmented with both illumination and spatial-shift variations, then evaluating cross-year performance to measure consistency. This procedure is outlined at a high level in Section 5 but lacks the step-by-step detail needed for full reproducibility. In the revision, we will expand Section 5 with an explicit description of the operationalization, including the exact augmentations applied per year, the retraining protocol, and any pseudocode or workflow diagram to clarify causal attribution to the quantity and diversity factors. revision: yes
Circularity Check
No circularity: empirical augmentation experiments with independent results
full rationale
The paper conducts an empirical study by augmenting an existing raveling dataset to create the RavelingArena benchmark, then runs controlled experiments varying training data quantity, illumination, and spatial shift to measure accuracy changes. Central claims (≥9.2% accuracy gain under diverse conditions and improved year-to-year consistency in the Georgia case study) are direct observations from these experiments rather than any derivation, fitted parameter, or self-referential definition. No equations, predictions, or load-bearing self-citations reduce the results to the inputs by construction; the work is self-contained as reported experimental outcomes.
Axiom & Free-Parameter Ledger
axioms (1)
- domain assumption Machine learning models trained on augmented data generalize to real-world distribution shifts caused by illumination and spatial changes
invented entities (1)
-
RavelingArena
no independent evidence
Reference graph
Works this paper leans on
-
[1]
John S. Miller and William Y. Bellinger. Distress identification manual for the long-term pavement performance program. Technical report, Federal Highway Administration, U.S. Department of Transportation, 2003
work page 2003
-
[2]
J. Laurent, J. F. Hébert, D. Lefebvre, and Y. Savard. Using 3d laser profiling sensors for the automated measurement of road surface conditions. In7th RILEM International Conference on Cracking in Pavements, pages 157–167. Springer, 2012
work page 2012
-
[3]
G. M. Duncan, L. V. Sibaja Vargas, P. Ram, and K. A. Zimmerman. Development of a pavement management manual and data quality plan for the mississippi department of transportation. Technical report, Mississippi Department of Transportation, 2017
work page 2017
-
[4]
FDOT.Flexible Pavement Condition Survey Handbook, 2025
work page 2025
-
[5]
GDOT.Pavement Evaluation Manual, 2024
work page 2024
-
[6]
N. Gharaibeh, T. Freeman, S. Saliminejad, A. Wimsatt, C. Chang-Albitres, S. Nazarian, I. N. Abdallah, J. Weissmann, A. J. Weissmann, and A. T. Papagiannakis. Evaluation and development of pavement scores, performance models and needs estimates for the txdot pavement management information system. Technical report, Texas Transporta- tion Institute, 2012
work page 2012
-
[7]
Evaluation of mdot’s distress thresholds for maintained pavement projects
Yan Qi, Amin El Gendy, and Feng Wang. Evaluation of mdot’s distress thresholds for maintained pavement projects. 2012
work page 2012
-
[8]
TxDOT.Pavement Management Information System: Rater’s Manual, 2010
work page 2010
-
[9]
Y. Tsai, Z. Wang, X. Zhang, and Z. Yang. An enhanced gdot pavement preservation guide with optimal timing of pavement preservation. Technical report, Georgia Depart- ment of Transportation, 2021
work page 2021
-
[10]
Y.-A. Hsieh and Y. Tsai. Automated asphalt pavement raveling detection and classi- fication using convolutional neural network and macrotexture analysis.Transportation Research Record, 2675(9):984–994, 2021
work page 2021
-
[11]
A review of florida’s fc-5 raveling condition assessment and measurement methods
Yichang James Tsai, Yung-An Hsieh, Bruce Dietrich, and Wiley Cunagin. A review of florida’s fc-5 raveling condition assessment and measurement methods. 2022
work page 2022
-
[12]
Y. J. Tsai and Z. Wang. Development of an asphalt pavement raveling detection algo- rithm using emerging 3d laser technology and macrotexture analysis. Technical report, 2015
work page 2015
-
[13]
T. K. Ho. The random subspace method for constructing decision forests.IEEE Trans- actions on Pattern Analysis and Machine Intelligence, 20(8):832–844, 1998
work page 1998
-
[14]
Deep residual learning for image recognition
Kaiming He, Xiangyu Zhang, Shaoqing Ren, and Jian Sun. Deep residual learning for image recognition. InProceedings of the IEEE Conference on Computer Vision and Pattern Recognition, pages 770–778, 2016. 19
work page 2016
-
[15]
Adam: A Method for Stochastic Optimization
Diederik P. Kingma and Jimmy Ba. Adam: A method for stochastic optimization. arXiv preprint arXiv:1412.6980, 2014
work page internal anchor Pith review Pith/arXiv arXiv 2014
-
[16]
Z. Yang, M. Mohammadi, H. Wang, and Y. C. Tsai. A feature-based pavement image registration method for precise pavement deterioration monitoring.Computer-Aided Civil and Infrastructure Engineering, 40(10):1276–1294, 2025
work page 2025
-
[17]
B. Zitova and J. Flusser. Image registration methods: A survey.Image and Vision Computing, 21(11):977–1000, 2003
work page 2003
-
[18]
X. Zhang, Y.-A. Hsieh, P. Yu, Z. Yang, and Y. J. Tsai. Multiclass transportation safety hardware asset detection and segmentation based on mask-rcnn with roi attention and ioma-merging.Journal of Computing in Civil Engineering, 37(5):04023024, 2023
work page 2023
-
[19]
C. Shorten and T. M. Khoshgoftaar. A survey on image data augmentation for deep learning.Journal of Big Data, 6(1):1–48, 2019
work page 2019
- [20]
-
[21]
R. Zhang. Making convolutional networks shift-invariant again. InInternational Con- ference on Machine Learning, pages 7324–7334. PMLR, 2019. 20
work page 2019
discussion (0)
Sign in with ORCID, Apple, or X to comment. Anyone can read and Pith papers without signing in.