Conservative neural posterior estimation via distributionally robust training
Pith reviewed 2026-06-29 09:40 UTC · model grok-4.3
The pith
Distributionally robust training yields more conservative neural posteriors with better calibration under limited simulations.
A machine-rendered reading of the paper's core claim, the machinery that carries it, and where it could break.
Core claim
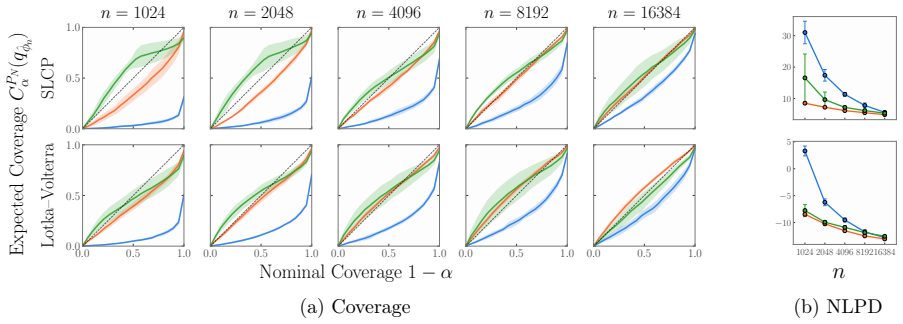
DRO-NPE minimizes the supremum of the negative log-likelihood loss over all probability measures whose Wasserstein distance to the empirical simulation distribution is at most a fixed radius. This distributionally robust objective is shown to shrink the gap between the empirical training loss and the population loss, which in turn improves the coverage of credible intervals and reduces posterior overconfidence as quantified by the introduced KL metrics.
What carries the argument
The DRO-NPE objective, defined as the worst-case expected loss inside a Wasserstein ball centered at the empirical distribution of simulations, which replaces the ordinary expectation in standard NPE training.
If this is right
- Posterior credible intervals achieve higher empirical coverage of the true parameters on held-out data.
- KL-based miscalibration and miscoverage scores decrease compared with standard NPE training.
- The difference between finite-sample NPE loss and the ideal population loss is reduced.
- These gains appear across multiple benchmark tasks without any increase in the simulation budget.
Where Pith is reading between the lines
- The same worst-case formulation could be applied to other neural density estimators used in likelihood-free inference.
- The radius of the ambiguity set might be selected automatically by monitoring performance on a small validation set of additional simulations.
- Analogous robustness penalties could address distribution mismatch in other scientific machine-learning pipelines that rely on simulated training data.
Load-bearing premise
The Wasserstein ball of chosen radius around the empirical simulation distribution accurately reflects the distribution shift that arises from using only a finite number of simulations.
What would settle it
A controlled experiment on a standard SBI benchmark in which DRO-NPE produces no measurable improvement in coverage or calibration relative to ordinary NPE when the number of simulations is held fixed and small.
Figures


read the original abstract
Simulation-based inference with neural posterior estimation (NPE) often yields overconfident and unreliable posteriors under limited simulation budgets. To address this, we propose DRO-NPE, a distributionally robust approach that replaces the standard NPE objective with a worst-case loss over a Wasserstein ambiguity set. We introduce KL-based metrics for miscoverage and miscalibration, and use these to show that the DRO-NPE objective controls overfitting and reduces posterior overconfidence. Our method is tractable, parallelisable, and readily integrates with standard normalising flows. Across benchmark SBI tasks, DRO-NPE consistently improves coverage and calibration, while narrowing the gap between empirical and population NPE loss, leading to more reliable inference in low-simulation regimes.
Editorial analysis
A structured set of objections, weighed in public.
Referee Report
Summary. The manuscript proposes DRO-NPE, which replaces the standard neural posterior estimation (NPE) objective with a worst-case loss over a Wasserstein ambiguity set. It introduces new KL-based metrics for miscoverage and miscalibration, and claims that these demonstrate that DRO-NPE controls overfitting, reduces posterior overconfidence, narrows the gap between empirical and population loss, and yields improved coverage and calibration on benchmark SBI tasks under limited simulation budgets. The method is presented as tractable and compatible with normalizing flows.
Significance. If the robustness claim holds with a radius choice that is demonstrably tied to finite-simulation shift, the work would address a practical limitation of NPE in low-budget regimes and supply a conservative training objective that integrates readily with existing flows. The introduction of explicit KL miscoverage and miscalibration metrics is a constructive contribution provided they are shown to be non-circular.
major comments (2)
- [Abstract] Abstract: the central claim that the DRO-NPE objective 'controls overfitting' is demonstrated solely via the newly introduced KL miscoverage and miscalibration metrics; if these metrics are constructed from quantities directly optimized by the Wasserstein worst-case loss, the reported improvement risks circularity rather than independent validation.
- [Abstract] Abstract and method description: the Wasserstein radius is not linked to the magnitude of distribution shift induced by finite simulation budgets, nor is a selection rule or validation procedure provided; without this link the robustness guarantee does not demonstrably address the motivating low-budget regime.
minor comments (1)
- [Abstract] The abstract states that results are shown 'across benchmark SBI tasks' but provides no dataset names, simulation counts, or error bars; these details are required to assess robustness of the reported improvements.
Simulated Author's Rebuttal
Thank you for the constructive review. We address each major comment below, providing clarifications where the metrics are independent and agreeing to add explicit radius selection guidance.
read point-by-point responses
-
Referee: [Abstract] Abstract: the central claim that the DRO-NPE objective 'controls overfitting' is demonstrated solely via the newly introduced KL miscoverage and miscalibration metrics; if these metrics are constructed from quantities directly optimized by the Wasserstein worst-case loss, the reported improvement risks circularity rather than independent validation.
Authors: The KL-based miscoverage and miscalibration metrics are defined post hoc as the KL divergence between the estimated posterior's coverage probabilities/calibration curves and those of the true posterior (computed on benchmark tasks with ground-truth access or extra simulations). The training objective is instead the worst-case expected NPE loss (negative log-likelihood) over the Wasserstein ball and does not include these KL terms. The metrics therefore provide independent validation of reduced overfitting. We will revise the abstract and add an explicit paragraph in Section 3 distinguishing the objective from the evaluation metrics. revision: yes
-
Referee: [Abstract] Abstract and method description: the Wasserstein radius is not linked to the magnitude of distribution shift induced by finite simulation budgets, nor is a selection rule or validation procedure provided; without this link the robustness guarantee does not demonstrably address the motivating low-budget regime.
Authors: We agree the manuscript does not currently provide an explicit link or selection rule tying the radius to finite-simulation shift. In the revision we will add a subsection describing a practical validation procedure: a small held-out simulation budget is used to estimate the shift and select the radius minimizing the empirical-to-population loss gap; we will also include a short discussion relating the radius to finite-sample concentration bounds on the simulation-induced distribution shift. revision: yes
Circularity Check
No significant circularity detected
full rationale
The abstract introduces KL-based metrics for miscoverage and miscalibration as new quantities and applies them to evaluate the DRO-NPE objective on benchmark tasks. No equations, self-citations, or definitional steps are visible that would reduce the claimed control of overfitting to a tautology or fitted input renamed as prediction. The central claim rests on empirical improvement across SBI tasks rather than internal self-reference, satisfying the requirement for independent content.
Axiom & Free-Parameter Ledger
Reference graph
Works this paper leans on
-
[1]
Therefore, θi −µ i σi 2 ≤ θi −µ i σi,min 2 ≤ 2θ2 i + 2µ2 i σ2 i,min ≤ 2θ2 i + 2C2 µ,i σ2 i,min
there existsC µ,i <∞such that|µ i(θ<i,x)| ≤C µ,i for allz; 30 2.s i(θ<i,x )is uniformly bounded, and therefore0 < σ i,min ≤σ i(θ<i,x ) ≤σ i,max <∞ for all z. Therefore, θi −µ i σi 2 ≤ θi −µ i σi,min 2 ≤ 2θ2 i + 2µ2 i σ2 i,min ≤ 2θ2 i + 2C2 µ,i σ2 i,min . Substituting this bound and using|logσ i| ≤max{|logσ i,min|,|logσ i,max|} := Clogσ, we get that |logq ...
2026
-
[2]
First, the Actnorm layer, which is an invertible adaptation of batch normalisation for stable training, is applied to θ
implemented in BayesFlow package (Kühmichel et al., 2026) forqϕ(θ|x ). First, the Actnorm layer, which is an invertible adaptation of batch normalisation for stable training, is applied to θ. It is followed by a permutation, multiplying by the permutation matrix 34 P∈ { 0, 1}dΘ×dΘ: ˜θ = P (α⊙θ + β)where α, β∈R dΘ are trainable parameters, and⊙ denotes ele...
2026
discussion (0)
Sign in with ORCID, Apple, or X to comment. Anyone can read and Pith papers without signing in.