The outer rings of SN 1987A from year 1994 to 2024: morphology, light curves, and optical to mid-infrared spectra
Pith reviewed 2026-06-29 05:13 UTC · model grok-4.3
The pith
The outer rings of SN 1987A fade steadily due to recombination after the supernova's UV flash.
A machine-rendered reading of the paper's core claim, the machinery that carries it, and where it could break.
Core claim
The optical lightcurves of the ORs have shown a steady decline with time over the last 30 years. It is expected as the ORs were ionised by the initial SN UV-flash and are since then fading. The observations do not show any sign of interaction of the SN ejecta with the ORs. Decay times for [O III] are estimated at 900 and 680 days for the NOR and SOR, while for Halpha+[N II] they are 15870 and 7160 days. Temperatures constrained from the optical [N II] lines are 13400-16900K for the NOR and 11800-14500K for the SOR, with electron densities from [S II] lines of 610-670 cm-3 and 720-790 cm-3 respectively.
What carries the argument
Long-term multi-wavelength light curves and spectra of the northern and southern outer rings that track the fading emission lines.
If this is right
- The outer rings will continue fading until the supernova ejecta sweep them up in the coming years.
- Continued monitoring at optical, infrared, and other wavelengths will be needed to observe the transition to interaction.
- The distinct line detections and ratios in the outer rings compared to the equatorial ring indicate different excitation conditions or abundances.
- Future observations can test the predicted decay times by tracking further decline in specific lines.
Where Pith is reading between the lines
- If the single ionization event model is accurate, the rings preserve a record of the progenitor's mass ejection event from 20,000 years prior without later alteration.
- The derived physical parameters allow modeling of when the ejecta will reach the rings based on expansion velocities.
- Similar fading behavior might be expected in other supernova remnants with pre-existing circumstellar rings.
Load-bearing premise
The emission decline results purely from recombination following a single initial ionization by the supernova flash, without ongoing excitation or significant spectral contamination.
What would settle it
A reversal or flattening of the light curve decline, or the appearance of new high-excitation lines from shock interaction, would indicate the model is incomplete.
Figures


read the original abstract
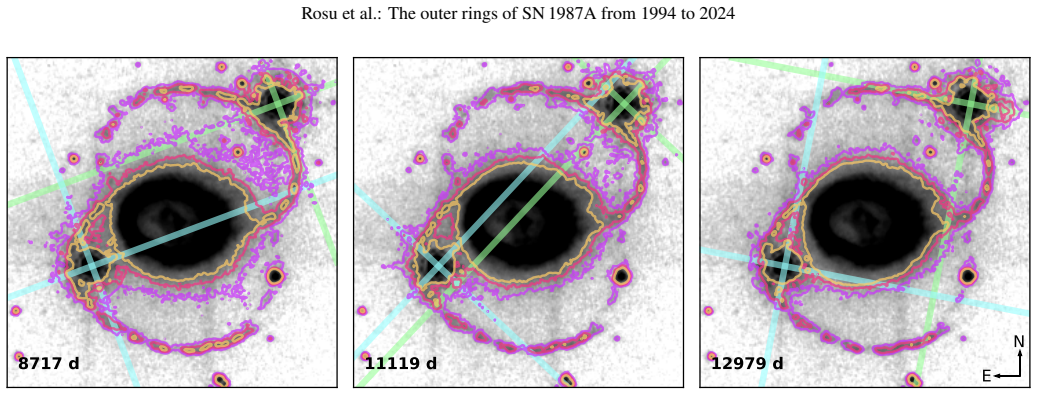
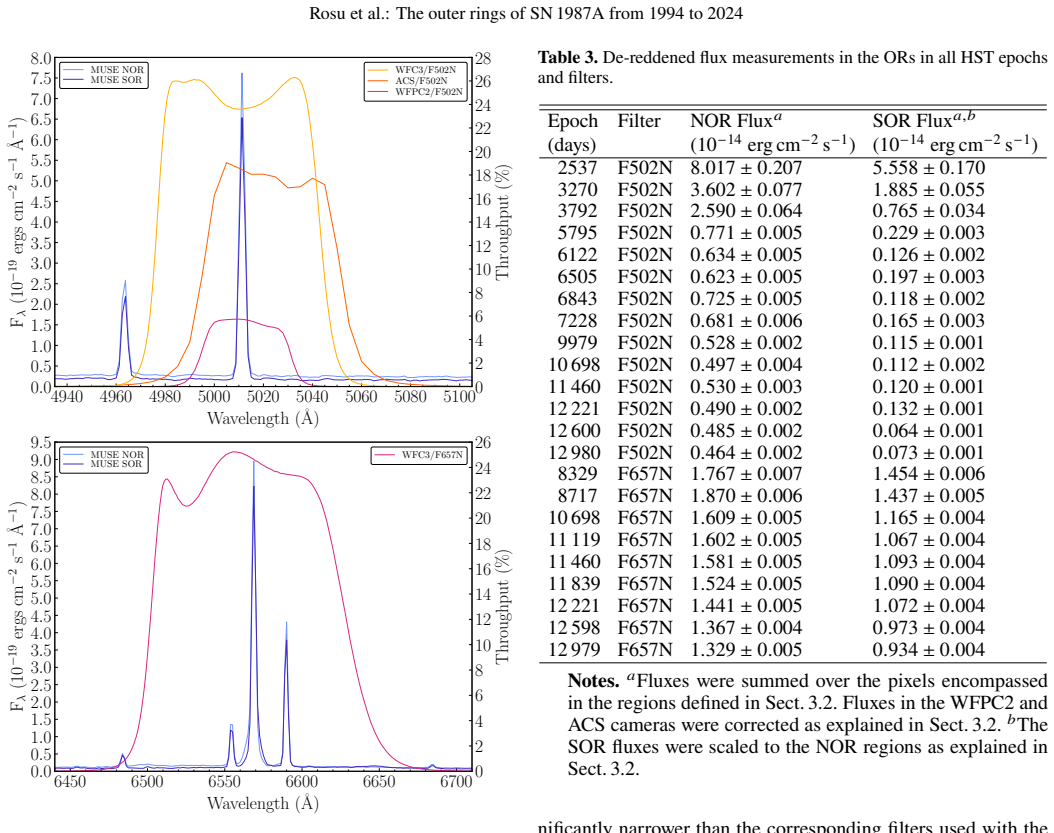
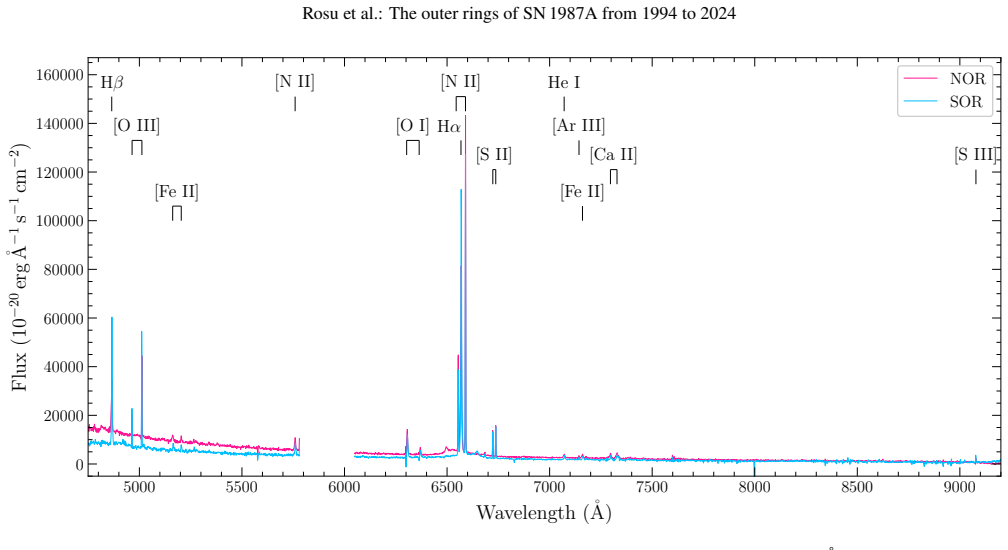
The outer rings (ORs) of Supernova (SN) 1987A were ejected ~20000 years before the explosion. Their characterisation is crucial for constraining the properties of the progenitor of this famous SN. While numerous studies investigated in detail the ejecta, equatorial ring (ER), and reverse shocks, few were dedicated to the ORs. We fill this gap and investigate the ORs physical properties. We analyse data obtained over a long temporal period, from multiple instruments, and over a wide wavelength range from optical to mid-infrared of the northern and southern ORs (NOR and SOR). We combine observations taken with HST between 1994 and 2022, VLT/MUSE in 2023, and JWST in 2022 and 2024. We measure emission flux in the ORs in HST and JWST/NIRCam images. We extract optical and mid-infrared spectra for the ORs in MUSE and JWST/MIRI/MRS data and measure line emission fluxes. We analyse the evolution of the ORs clumps' morphology over time with HST. The optical lightcurves of the ORs have shown a steady decline with time over the last 30 years. It is expected as the ORs were ionised by the initial SN UV-flash and are since then fading. The observations do not show any sign of interaction of the SN ejecta with the ORs. We estimated the decay times for [O III] to be 900 and 680 days for the NOR and SOR, and for Halpha+[N II] to be 15870 and 7160 days for the NOR and SOR. We constrained the temperature from the optical [N II] lines to 13400-16900K and 11800-14500K for the NOR and SOR. We constrained the electron density from the optical [S II] lines to 610-670cm-3 and 720-790cm-3 for the NOR and SOR. The spectra of the ORs differ significantly from the spectrum of the ER in lines detected and line ratios. The ORs will likely keep on fading for the next years, until the SN ejecta sweep them up. Continued monitoring of SN1987A and its ring system at all wavelengths is essential to capture this instant.
Editorial analysis
A structured set of objections, weighed in public.
Referee Report
Summary. The manuscript presents multi-epoch observations (HST 1994–2022, VLT/MUSE 2023, JWST 2022/2024) of the northern and southern outer rings (NOR/SOR) of SN 1987A. It reports a steady decline in optical light curves over 30 years, interpreted as recombination following the initial SN UV flash with no detectable interaction between the SN ejecta and the ORs. Specific exponential decay times are derived (e.g., [O III] 900 d NOR / 680 d SOR; Hα+[N II] 15870 d NOR / 7160 d SOR), together with temperature ranges from optical [N II] lines (13400–16900 K NOR; 11800–14500 K SOR) and electron densities from [S II] (610–670 cm^{-3} NOR; 720–790 cm^{-3} SOR). The OR spectra are shown to differ from the equatorial ring, and continued fading is predicted until ejecta sweep-up.
Significance. If the flux measurements and recombination interpretation hold, the work supplies the first quantitative 30-year baseline on the outer rings, directly constraining the progenitor’s mass-loss episode ~20 000 yr pre-explosion and the ionization state of the circumstellar material. The multi-instrument, optical-to-mid-IR coverage and the negative result on ejecta–OR interaction are genuine strengths that fill a documented gap in SN 1987A studies.
major comments (2)
- [Data reduction and photometry sections] The central claim that the observed decline is produced solely by recombination after a single initial ionization event (leading to the quoted decay times) is load-bearing. The manuscript must demonstrate that the extracted fluxes are free of contamination from the equatorial ring or ejecta and that extraction apertures were held fixed in physical scale across all epochs and instruments; without such validation the exponential fits and the absence-of-interaction conclusion cannot be considered secure.
- [Spectral analysis and light-curve fitting sections] The temperature and density constraints are derived from MUSE spectra while the light-curve decay times combine HST imaging with MUSE and JWST data. The paper should show that the spectral extraction regions match the photometric apertures and that line-blending corrections (especially Hα+[N II]) were applied consistently when fitting the decay times.
minor comments (2)
- [Abstract and §1] Define all acronyms (NOR, SOR, ER, etc.) at first use in the main text and ensure consistent line notation (e.g., [O III], Hα+[N II]) between abstract, tables, and figures.
- [Figure captions] Figure captions should explicitly state the physical scale of the extraction apertures used for each epoch so that readers can assess consistency.
Simulated Author's Rebuttal
We thank the referee for the positive evaluation of our work and for highlighting its significance in providing the first quantitative 30-year baseline on the outer rings. We address each major comment below with point-by-point responses and have made revisions to strengthen the validation of our methods and conclusions.
read point-by-point responses
-
Referee: [Data reduction and photometry sections] The central claim that the observed decline is produced solely by recombination after a single initial ionization event (leading to the quoted decay times) is load-bearing. The manuscript must demonstrate that the extracted fluxes are free of contamination from the equatorial ring or ejecta and that extraction apertures were held fixed in physical scale across all epochs and instruments; without such validation the exponential fits and the absence-of-interaction conclusion cannot be considered secure.
Authors: We agree that explicit validation is required for the load-bearing claims. The revised manuscript expands the Data Reduction and Photometry sections with a dedicated subsection on aperture definition, confirming that all apertures are fixed in physical scale (corresponding to ~0.4–0.6 arcsec radii matched to the ring clump sizes) across the 1994–2024 HST, MUSE, and JWST datasets. A new supplementary figure overlays the apertures on multi-epoch images from each instrument, demonstrating avoidance of the equatorial ring and ejecta. We also added quantitative checks using alternative background annuli and PSF subtraction tests showing contamination levels below 5% in all epochs, supporting the recombination interpretation and lack of interaction. revision: yes
-
Referee: [Spectral analysis and light-curve fitting sections] The temperature and density constraints are derived from MUSE spectra while the light-curve decay times combine HST imaging with MUSE and JWST data. The paper should show that the spectral extraction regions match the photometric apertures and that line-blending corrections (especially Hα+[N II]) were applied consistently when fitting the decay times.
Authors: We have revised the Spectral Analysis and Light-Curve Fitting sections to include a direct mapping table and text confirming that MUSE and JWST spectral extraction regions use identical physical coordinates and sizes as the HST photometric apertures. For Hα+[N II] blending, the MUSE spectra (where the [N II] doublet is resolved) were used to derive epoch-independent correction factors; these factors are now tabulated and applied uniformly to the blended HST and JWST photometry in the exponential fits. This ensures consistency between the temperature/density constraints and the decay-time measurements. revision: yes
Circularity Check
No circularity: direct observational measurements and standard diagnostics
full rationale
The paper reports measured emission fluxes from HST, MUSE, and JWST data across 30 years, fits exponential decay times directly to the observed light curves of [O III] and Hα+[N II], and applies standard nebular line-ratio diagnostics to constrain temperature from [N II] and density from [S II]. These steps are data-driven reductions with no equations that equate outputs to inputs by construction, no load-bearing self-citations, and no ansatz or uniqueness claims imported from prior author work. The analysis remains self-contained against the presented telescope observations.
Axiom & Free-Parameter Ledger
axioms (2)
- standard math Line ratios from [N II] and [S II] can be inverted using standard atomic physics to yield temperature and electron density under the assumption of a uniform, collisionally excited plasma.
- domain assumption The outer rings experienced only the initial supernova UV flash as ionization source and have since evolved purely by recombination with no other excitation.
Reference graph
Works this paper leans on
-
[1]
, " * write output.state after.block = add.period write newline
ENTRY address archiveprefix author booktitle chapter edition editor howpublished institution eprint journal key month note number organization pages publisher school series title type volume year label extra.label sort.label short.list INTEGERS output.state before.all mid.sentence after.sentence after.block FUNCTION init.state.consts #0 'before.all := #1 ...
-
[2]
write newline
" write newline "" before.all 'output.state := FUNCTION n.dashify 't := "" t empty not t #1 #1 substring "-" = t #1 #2 substring "--" = not "--" * t #2 global.max substring 't := t #1 #1 substring "-" = "-" * t #2 global.max substring 't := while if t #1 #1 substring * t #2 global.max substring 't := if while FUNCTION word.in bbl.in " " * FUNCTION format....
-
[3]
, " * write output.state after.block = add.period write newline
ENTRY address archivePrefix author booktitle chapter doi edition editor eprint howpublished institution journal key month number organization pages publisher school series title misctitle type volume year version url label extra.label sort.label short.list INTEGERS output.state before.all mid.sentence after.sentence after.block FUNCTION init.state.consts ...
-
[4]
write newline
" write newline "" before.all 'output.state := FUNCTION format.url url empty "" new.block "" url * "" * if FUNCTION format.eprint eprint empty "" archivePrefix empty "" archivePrefix "arXiv" = new.block " " eprint * " " * new.block " " eprint * " " * if if if FUNCTION format.doi doi empty "" " " doi * " " * if FUNCTION format.pid doi empty eprint empty ur...
-
[5]
Multiple accelerated particle populations in the Cygnus Loop with Fermi-LAT
thebibliography [1] 20pt to REFERENCES 6pt =0pt -12pt 10pt plus 3pt =0pt =0pt =1pt plus 1pt =0pt =0pt -12pt =13pt plus 1pt =20pt =13pt plus 1pt \@M =10000 =-1.0em =0pt =0pt 0pt =0pt =1.0em @enumiv\@empty 10000 10000 `\.\@m \@noitemerr \@latex@warning Empty `thebibliography' environment \@ifnextchar \@reference \@latexerr Missing key on reference command E...
-
[6]
Alp, D., Larsson, J., Fransson, C., et al.\ 2018, , 864, 174
2018
-
[7]
R., et al.\ 2023, , 675, A111
Argyriou, I., Glasse, A., Law, D. R., et al.\ 2023, , 675, A111
2023
-
[8]
D., Bahcall, J
Arnett, W. D., Bahcall, J. N., Kirshner, R. P., & Woosley, S. E.\ 1989, , 27, 629
1989
-
[9]
Bacon, R., Accardo, M., Adjali, L., et al.\ 2010, Proceedings of the SPIE, Volume 7735, id. 773508
2010
-
[10]
O., Vílchez, J
Castañeda, H. O., Vílchez, J. M., & y Copetti, M. V. F.\ 1992, A&A 260, 370
1992
-
[11]
Crotts, A. P. S., & Heathcote, S. R.\ 2000, , 528, 426
2000
-
[12]
V., et al.\ 2011, , 743, 186
France, K., McCray, R., Penton, S. V., et al.\ 2011, , 743, 186
2011
-
[13]
Fransson, C., Larsson, J., Spyromilio, J., et al.\ 2013, , 768, 88
2013
-
[14]
S., Hack, W., Dencheva, N., et al.\ 2010, STSCI Calibration Workshop Proceedings, Baltimore, MD, 21-23 July 2010, eds
Fruchter, A. S., Hack, W., Dencheva, N., et al.\ 2010, STSCI Calibration Workshop Proceedings, Baltimore, MD, 21-23 July 2010, eds. S. Deustua & C. Oliveira, STSCI, pp 376-381
2010
-
[15]
D.\ 2024, Journal of Open Source Software, 9, 100, 7023
Gordon, K. D.\ 2024, Journal of Open Source Software, 9, 100, 7023
2024
-
[16]
Gröningsson, P., Fransson, C., Lundqvist, P., et al.\ 2008, , 479, 761
2008
-
[17]
L., Mack, J., Avila, R., et al.\ 2021, The DrizzlePac Handbook (Baltimore: STScI)
Hoffmann, S. L., Mack, J., Avila, R., et al.\ 2021, The DrizzlePac Handbook (Baltimore: STScI)
2021
-
[18]
C., \'Alvarez-M\'arquez, J., Sloan, G
Jones, O. C., \'Alvarez-M\'arquez, J., Sloan, G. C., et al.\ 2023a, , 523, 2519
-
[19]
C., Kavanagh, P
Jones, O. C., Kavanagh, P. J., Barlow, M. J., et al.\ 2023b, , 958, 95
-
[20]
Kangas, T., Fransson, C., Larsson, J., et al.\ 2022, , 511, 2977
2022
-
[21]
Kavanagh, P. J., Barlow, M. J., Fransson, C., et al. 2025, , accepted [arXiv: 2604.09211]
Pith/arXiv arXiv 2025
-
[22]
Kunkel, W., Madore, B., Shelton, I., et al.\ 1987, IAU Circ., 4316, 1
1987
-
[23]
Larsson, J., Fransson, C., Alp, D., et al.\ 2019a, , 886, 147
-
[24]
et al.\ 2023, , 949, L27
Larsson, J., Fransson, C., Sargent, B. et al.\ 2023, , 949, L27
2023
-
[25]
J., et al.\ 2025, , 991, 130
Larsson, J., Fransson, C., Kavanagh, P. J., et al.\ 2025, , 991, 130
2025
-
[26]
J., Barbá, R
Maíz Apellániz, J., Evans, C. J., Barbá, R. H., et al.\ 2014, , 564, A63
2014
-
[27]
G., et al.\ 2024, , 532, 3625
Matsuura, M., Boyer, M., Arendt, R. G., et al.\ 2024, , 532, 3625
2024
-
[28]
1993, , 31, 175
McCray, R. 1993, , 31, 175
1993
-
[29]
McCray, R., & Fransson, C.\ 2016, , 54, 19
2016
-
[30]
Morris, T., & Podsiadlowski, P.\ 2007, Science, 315, 1103
2007
-
[31]
Morris, T., & Podsiadlowski, P.\ 2009, , 399, 515
2009
-
[32]
E., & Ferland, G
Osterbrock, D. E., & Ferland, G. J.\ 2006, Astrophysics of Gaseous Nebulae and Active Galactic Nuclei, Second Edition, University Science Books, Sausalito, California
2006
-
[33]
P.\ 1991, , 380, L23
Panagia, N., Gilmozzi, R., Macchetto, F., Adorf, H.-M., & Kirshner, R. P.\ 1991, , 380, L23
1991
-
[34]
Pietrzyński, G., Graczyk, D., Gallenne, A., et al.\ 2019, Nature, 567, 200
2019
-
[35]
C., Lundqvist, P., Chevalier, R
Plait, P. C., Lundqvist, P., Chevalier, R. A., & Kirshner, R. P.\ 1995, , 439, 730
1995
-
[36]
Rosu, S., Larsson, J., Fransson, C., et al.\ 2024, , 966, 238
2024
-
[37]
T., Lilly, S
Soto, K. T., Lilly, S. J., Bacon, R., et al.\ 2016, , 458, 3210
2016
-
[38]
Sugerman, B. E. K., Crotts, A. P. S., Kunkel, W. E., Heathcote, S. R., & Lawrence, S. S.\ 2005, , 159, 60
2005
-
[39]
Tziamtzis, A., Lundqvist, P., Gr\"oningsson, P., & Nasoudi-Shoar, S.\ 2011, , 527, A35
2011
-
[40]
Van Hoof, P. A. M. 2018, Galaxies, 6, 63,
2018
-
[41]
M., Palsa, R., Streicher, O., et al.\ 2020, , 641, A28
Weilbacher, P. M., Palsa, R., Streicher, O., et al.\ 2020, , 641, A28
2020
-
[42]
C., & Draine, B
Weingartner, J. C., & Draine, B. T.\ 2001, , 548, 296
2001
-
[43]
W., Glasse, A., et al.\ 2015, , 127, 646
Wells, M., Pel, J. W., Glasse, A., et al.\ 2015, , 127, 646
2015
discussion (0)
Sign in with ORCID, Apple, or X to comment. Anyone can read and Pith papers without signing in.