Beyond Direct Retweets: Multi-Step Pathways in Italian COVID-19 Twitter
Pith reviewed 2026-06-28 23:42 UTC · model grok-4.3
The pith
Retweet attention in Italian COVID-19 Twitter starts concentrated inside communities but spreads unevenly to other groups over longer paths.
A machine-rendered reading of the paper's core claim, the machinery that carries it, and where it could break.
Core claim
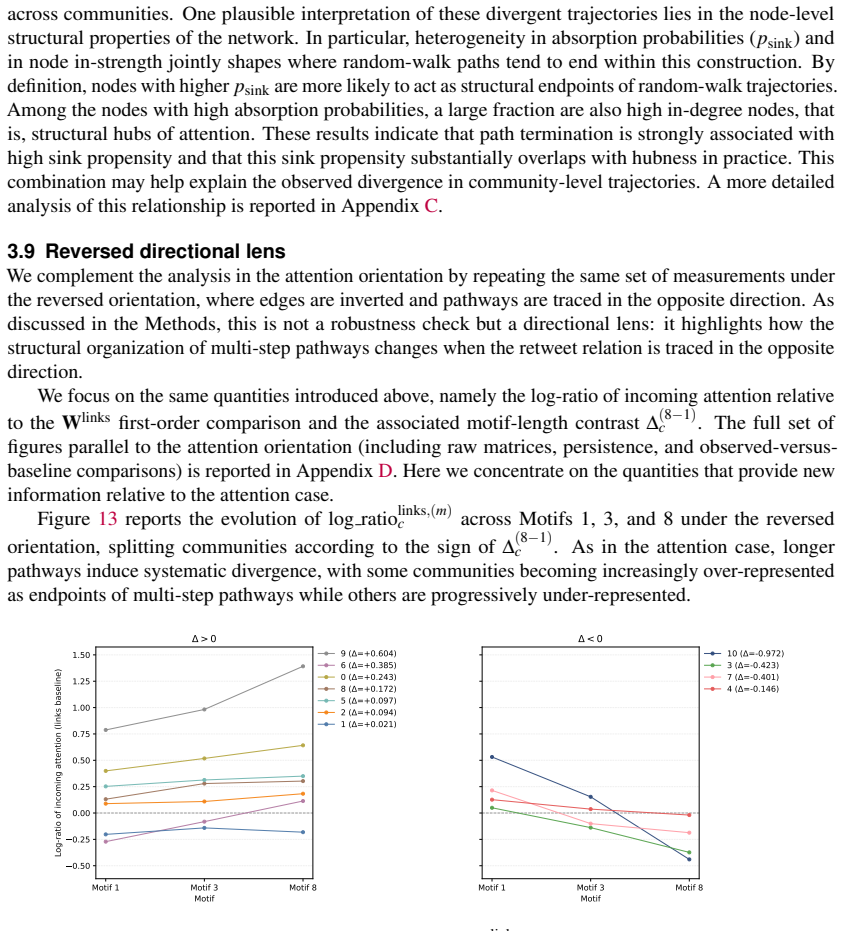
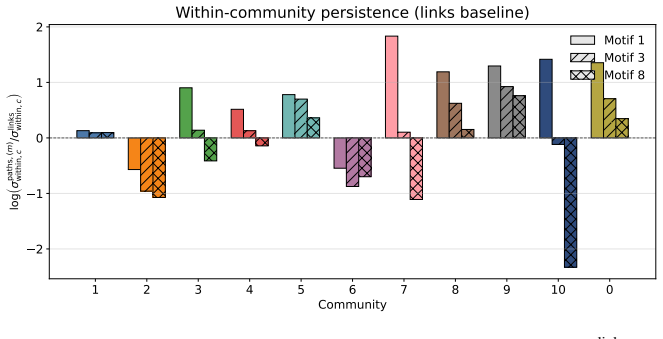
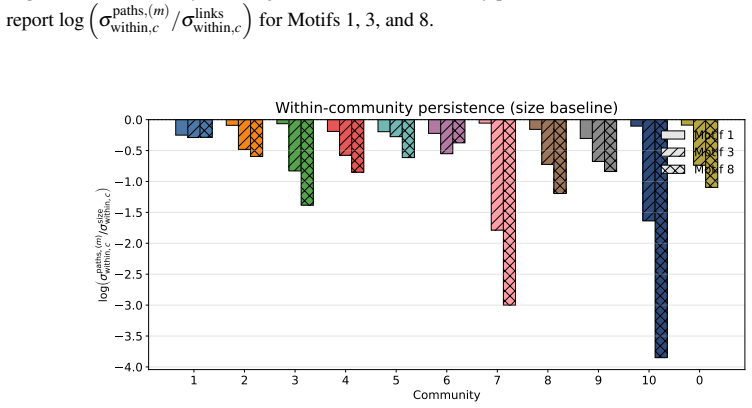
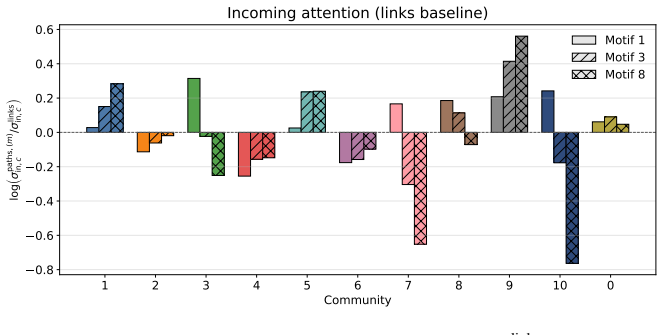
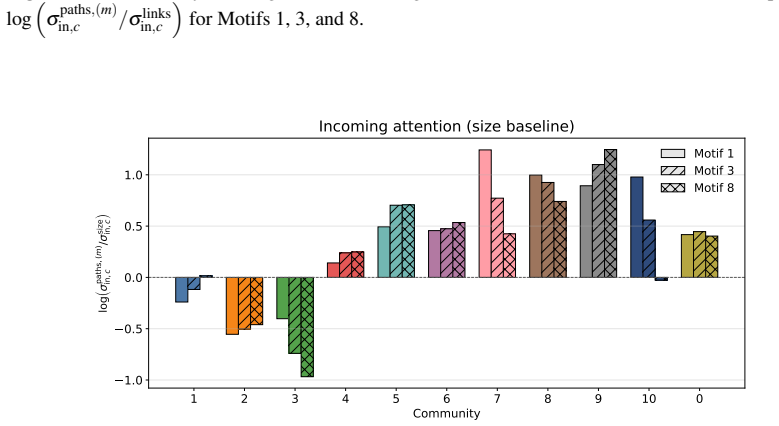
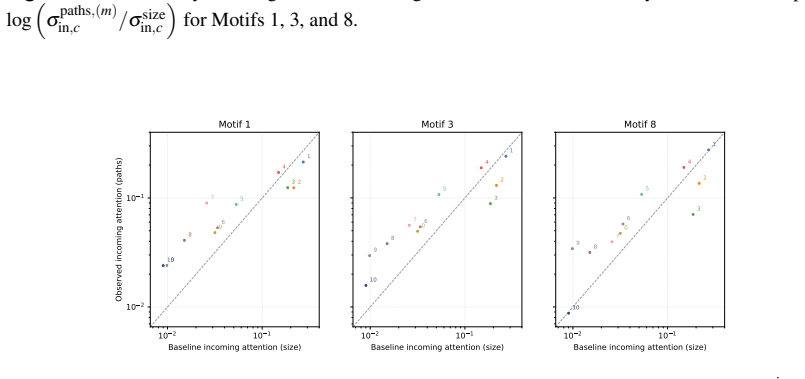
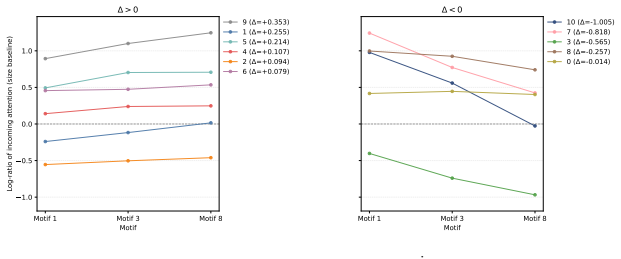
Motif-based random-walk paths show that attention concentration inside communities declines with path length while the resulting cross-community endpoint distribution is non-uniform, produces community prominence shifts not captured by size or first-order connectivity, and exhibits directional asymmetries under network reversal.
What carries the argument
Motif-based random-walk paths on the retweet network, used as a structural device to compare direct community-to-community connectivity against the distribution of multi-step endpoints.
If this is right
- Moving from one-step to multi-step analysis changes which communities appear most prominent in the debate.
- Community size and direct retweet volume do not fully predict longer-path attention sinks.
- Reversing the network direction produces different endpoint prominence rankings.
- First-order retweet graphs understate the higher-order mixing present in actual attention flows.
Where Pith is reading between the lines
- The same path-length approach could be tested on other national or topic-specific Twitter datasets to check whether uneven redistribution is general.
- Models of information diffusion might need to incorporate path-dependent community effects rather than assuming uniform mixing.
- Monitoring tools for public discourse could add multi-step flow measures to detect emerging community prominence shifts earlier.
Load-bearing premise
Motif-based random-walk paths serve as a valid structural device to compare direct community-to-community connectivity with the distribution of multi-step endpoints and thereby measure attention redistribution.
What would settle it
If the observed distribution of endpoints after k-step paths exactly matches the direct (one-step) connectivity matrix for every k, or if community endpoint shares remain constant across increasing path lengths.
Figures


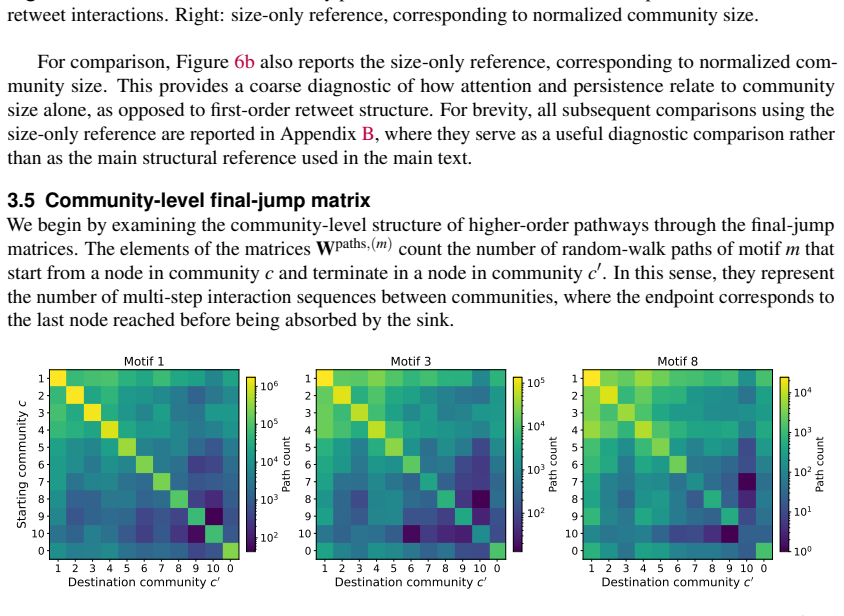
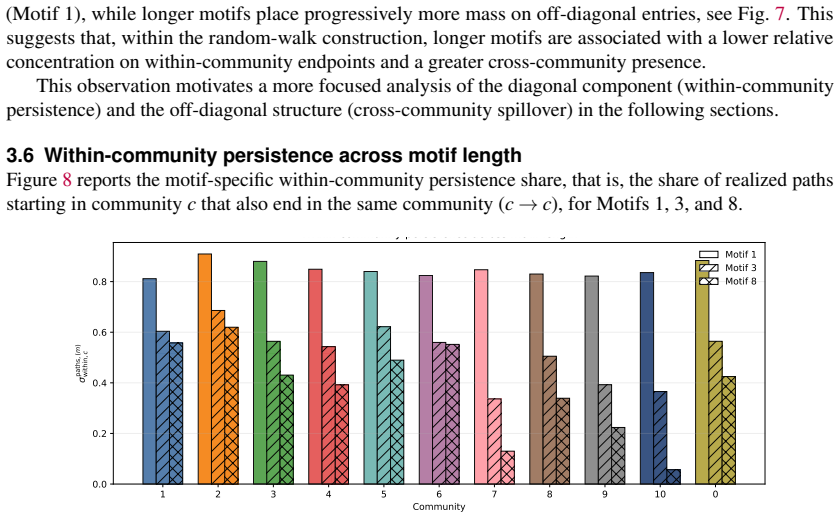
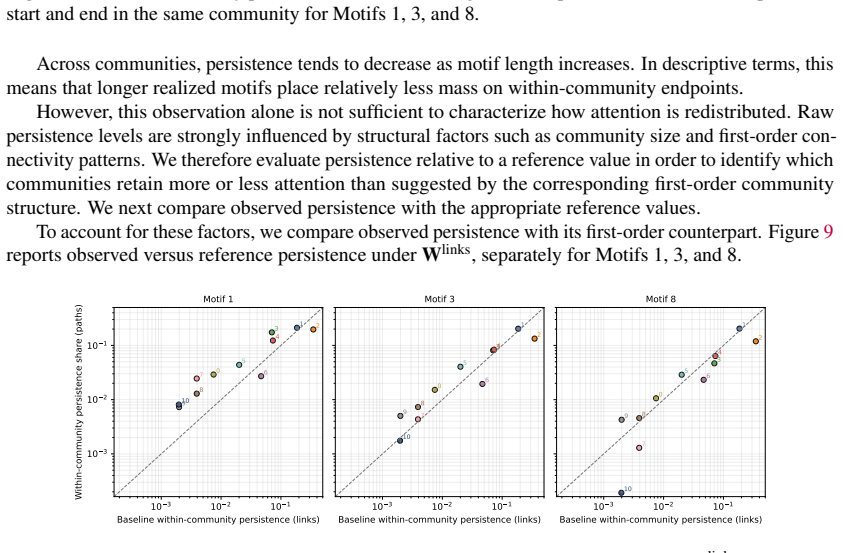


read the original abstract
We study how retweet interactions in large-scale Twitter debates are organized beyond direct links alone. Focusing on Twitter debate in Italy during the first phase of the COVID-19 pandemic, we combine a validated community-reconstruction pipeline with a higher-order random-walk framework to examine how short multi-step pathways redistribute attention across discursive communities. Rather than reconstructing observed cascades of individual tweets, we use motif-based random-walk paths as a structural device to compare direct community-to-community connectivity with the distribution of multi-step endpoints. We find that attention is initially concentrated within communities, but that this concentration weakens as path length increases. At the same time, the resulting cross-community redistribution is not uniform: some communities become increasingly prominent as endpoints of longer pathways, while others lose relative prominence. These differences are not fully captured by community size or by first-order retweet connectivity alone, and they also display important directional asymmetries when the network is analyzed under the reversed orientation. Taken together, the results show that moving beyond direct retweets changes the community-level representation of online debate and reveals higher-order structural patterns that remain invisible in first-order analyses.
Editorial analysis
A structured set of objections, weighed in public.
Referee Report
Summary. The paper analyzes retweet networks from Italian COVID-19 Twitter discussions using community detection followed by motif-based random walks on the community graph. It claims that intra-community attention concentration weakens with increasing path length, while cross-community redistribution is non-uniform (some communities gain endpoint prominence, others lose it), independent of community size or first-order connectivity, and exhibits directional asymmetries under network reversal. The analysis relies on random-walk paths as a structural proxy rather than reconstructed cascades.
Significance. If the random-walk proxy is shown to faithfully capture multi-step attention flow, the work would demonstrate that higher-order network structure produces community-level representation shifts invisible in direct-retweet analyses, with potential implications for modeling information diffusion and polarization in crisis-related online debates.
major comments (2)
- [Abstract / Methods] The central claim that multi-step pathways produce non-uniform, size-independent redistribution with directional asymmetries rests on motif-based random walks serving as a faithful proxy for attention flow. The abstract states this choice is made instead of reconstructing observed cascades, yet no comparison (e.g., community-transition matrices, endpoint distributions, or Kolmogorov-Smirnov statistics) between walk-generated paths and any measured multi-step retweet chains is reported; without such grounding the reported weakening of intra-community concentration and prominence shifts risk being method artifacts.
- [Abstract / Results] No quantitative results, error bars, dataset sizes, or validation metrics appear in the abstract or are referenced in the provided description, making it impossible to assess whether the data support the stated patterns of non-uniform redistribution; the soundness assessment is therefore limited to 3.0 pending explicit reporting of these quantities in the full manuscript.
minor comments (1)
- [Methods] Clarify the precise definition of 'motif-based random-walk paths' (e.g., which motifs, how walks are sampled, and the stopping criterion for path length) to allow reproducibility.
Simulated Author's Rebuttal
We thank the referee for the constructive feedback on our manuscript. We respond to each major comment below, focusing on the methodological rationale and reporting.
read point-by-point responses
-
Referee: [Abstract / Methods] The central claim that multi-step pathways produce non-uniform, size-independent redistribution with directional asymmetries rests on motif-based random walks serving as a faithful proxy for attention flow. The abstract states this choice is made instead of reconstructing observed cascades, yet no comparison (e.g., community-transition matrices, endpoint distributions, or Kolmogorov-Smirnov statistics) between walk-generated paths and any measured multi-step retweet chains is reported; without such grounding the reported weakening of intra-community concentration and prominence shifts risk being method artifacts.
Authors: The abstract explicitly frames the motif-based random walks as a 'structural device' for comparing direct connectivity with multi-step endpoint distributions on the community graph, rather than as a model intended to reconstruct or faithfully replicate observed attention flows or cascades. This is a deliberate choice to isolate higher-order topological effects without depending on incomplete cascade data. No empirical comparison to measured multi-step chains is reported because the analysis targets structural patterns, not validated diffusion paths; we therefore do not view the results as method artifacts within the stated scope. revision: no
-
Referee: [Abstract / Results] No quantitative results, error bars, dataset sizes, or validation metrics appear in the abstract or are referenced in the provided description, making it impossible to assess whether the data support the stated patterns of non-uniform redistribution; the soundness assessment is therefore limited to 3.0 pending explicit reporting of these quantities in the full manuscript.
Authors: The full manuscript reports dataset sizes, community counts, transition statistics, and related metrics in the Results and Methods sections. To address the concern, we will revise the abstract to include key quantitative indicators such as the number of tweets analyzed and main effect sizes. revision: yes
Circularity Check
No circularity: results derived from direct application to observed data
full rationale
The paper applies a community-reconstruction pipeline followed by motif-based random-walk paths to retweet interaction data from the Italian COVID-19 Twitter debate. No equations or steps reduce by construction to fitted parameters that are then renamed as predictions, nor do any load-bearing claims rest on self-citations whose content is unverified within the paper. The central findings on weakening intra-community concentration and non-uniform redistribution with path length are obtained by computing endpoint distributions on the empirical network; the method is a structural proxy applied once to the data rather than a self-referential loop. This matches the default expectation of a self-contained empirical analysis.
Axiom & Free-Parameter Ledger
axioms (2)
- domain assumption The community-reconstruction pipeline is validated
- domain assumption Motif-based random-walk paths accurately represent multi-step retweet interactions for attention redistribution
Reference graph
Works this paper leans on
-
[1]
Badawy, A., Ferrara, E., and Lerman, K. (2018). Analyzing the digital traces of political manipulation: The 2016 russian interference twitter campaign. In 2018 IEEE/ACM international conference on advances in social networks analysis and mining (ASONAM) , pages 258--265. IEEE
2018
-
[2]
A., Borge-Holthoefer, J., and Moreno, Y
Baños, R. A., Borge-Holthoefer, J., and Moreno, Y. (2013). The role of hidden influentials in the diffusion of online information cascades. EPJ Data Science , 2(1)
2013
-
[3]
Becatti, C., Caldarelli, G., Lambiotte, R., and Saracco, F. (2019). Extracting significant signal of news consumption from social networks: the case of twitter in italian political elections. Palgrave Communications , 5(1)
2019
-
[4]
Bennett, W. L. and Manheim, J. B. (2006). The one-step flow of communication. The ANNALS of the American Academy of Political and Social Science , 608(1):213--232
2006
-
[5]
R., Gleich, D
Benson, A. R., Gleich, D. F., and Leskovec, J. (2016). Higher-order organization of complex networks. Science , 353(6295):163--166
2016
-
[6]
D., Guillaume, J.-L., Lambiotte, R., and Lefebvre, E
Blondel, V. D., Guillaume, J.-L., Lambiotte, R., and Lefebvre, E. (2008). Fast unfolding of communities in large networks. Journal of statistical mechanics: theory and experiment , 2008(10):P10008
2008
-
[7]
Bracciale, R., Martella, A., and Visentin, C. (2018). From super-participants to super-echoed. participation in the 2018 italian electoral twittersphere. PaCO Vol. 11, No. 2 (2018). Special Issue: From Big Data in Politics to the Politics of Big Data , 11:361--393
2018
- [8]
-
[9]
Caldarelli, G., De Nicola, R., Petrocchi, M., Pratelli, M., and Saracco, F. (2021). Flow of online misinformation during the peak of the covid-19 pandemic in italy. EPJ data science , 10(1):34
2021
-
[10]
Chang, X., Cai, C.-R., Zhang, J.-Q., and Wang, C.-Y. (2021). Analytical solution of epidemic threshold for coupled information-epidemic dynamics on multiplex networks with alterable heterogeneity. Physical Review E , 104(4):044303
2021
-
[11]
Cimini, G., Squartini, T., Saracco, F., Garlaschelli, D., Gabrielli, A., and Caldarelli, G. (2019). The statistical physics of real-world networks. Nature Reviews Physics , 1(1):58--71
2019
-
[12]
Cinelli, M., De Francisci Morales, G., Galeazzi, A., Quattrociocchi, W., and Starnini, M. (2021). The echo chamber effect on social media. Proceedings of the national academy of sciences , 118(9):e2023301118
2021
-
[13]
Conover, M., Ratkiewicz, J., Francisco, M., Gon c alves, B., Menczer, F., and Flammini, A. (2011). Political polarization on twitter. In Proceedings of the international aaai conference on web and social media , volume 5, pages 89--96
2011
-
[14]
D., Gon c alves, B., Flammini, A., and Menczer, F
Conover, M. D., Gon c alves, B., Flammini, A., and Menczer, F. (2012). Partisan asymmetries in online political activity. EPJ Data science , 1(1):6
2012
-
[15]
E., and Quattrociocchi, W
Del Vicario, M., Bessi, A., Zollo, F., Petroni, F., Scala, A., Caldarelli, G., Stanley, H. E., and Quattrociocchi, W. (2016). The spreading of misinformation online. Proceedings of the national academy of Sciences , 113(3):554--559
2016
-
[16]
Dubois, E., Minaeian, S., Paquet-Labelle, A., and Beaudry, S. (2020). Who to trust on social media: How opinion leaders and seekers avoid disinformation and echo chambers. Social Media + Society , 6(2):2056305120913993
2020
-
[17]
C., Peixoto, T
Fischer, R., Leit\ ao, J. C., Peixoto, T. P., and Altmann, E. G. (2015). Sampling motif-constrained ensembles of networks. Phys. Rev. Lett. , 115:188701
2015
-
[18]
W., Cross, B., Zhou, Z., Serafino, M., Bovet, A., Makse, H
Flamino, J., Galeazzi, A., Feldman, S., Macy, M. W., Cross, B., Zhou, Z., Serafino, M., Bovet, A., Makse, H. A., and Szymanski, B. K. (2023). Political polarization of news media and influencers on Twitter in the 2016 and 2020 US presidential elections . Nature Human Behaviour , 7(6):904--916
2023
-
[19]
Fortunato, S. (2010). Community detection in graphs. Physics reports , 486(3-5):75--174
2010
-
[20]
and Loffredo, M
Garlaschelli, D. and Loffredo, M. I. (2008). Maximum likelihood: Extracting unbiased information from complex networks. Phys. Rev. E , 78:015101
2008
-
[21]
Garrett, R. K. (2009). Echo chambers online?: Politically motivated selective exposure among internet news users. Journal of computer-mediated communication , 14(2):265--285
2009
-
[22]
Goel, S., Anderson, A., Hofman, J., and Watts, D. J. (2016). The structural virality of online diffusion. Management science , 62(1):180--196
2016
-
[23]
Gomez Rodriguez, M., Leskovec, J., and Krause, A. (2010). Inferring networks of diffusion and influence. In Proceedings of the 16th ACM SIGKDD International Conference on Knowledge Discovery and Data Mining , KDD '10, page 1019–1028, New York, NY, USA. Association for Computing Machinery
2010
-
[24]
Gong, X., Huskey, R., Xue, H., Shen, C., and Frey, S. (2023). Broadcast information diffusion processes on social media networks: Exogenous events lead to more integrated public discourse. Journal of Communication , 73(3):247--259
2023
-
[25]
González-Bailón, S., Borge-Holthoefer, J., and Moreno, Y. (2013). Broadcasters and hidden influentials in online protest diffusion. American Behavioral Scientist
2013
-
[26]
Guarino, S., Mounim, A., Caldarelli, G., and Saracco, F. (2026). Leveraging content producer networks and user perception to detect online discursive communities. Scientific Reports
2026
-
[27]
Guarino, S., Pierri, F., Di Giovanni, M., and Celestini, A. (2021). Information disorders during the covid-19 infodemic: The case of italian facebook. Online Social Networks and Media , 22:100124
2021
-
[28]
Hanna, A., Wells, C., Maurer, P., Friedland, L., Shah, D., and Matthes, J. (2013). Partisan alignments and political polarization online: A computational approach to understanding the french and us presidential elections. In Proceedings of the 2nd Workshop on Politics, Elections and Data , pages 15--22
2013
-
[29]
Hilbert, M., Vásquez, J., Halpern, D., Valenzuela, S., and Arriagada, E. (2017). One step, two step, network step? complementary perspectives on communication flows in twittered citizen protests. Social Science Computer Review , 35(4):444--461
2017
-
[30]
and Lazarsfeld, P
Katz, E. and Lazarsfeld, P. F. (1955). Personal influence: the part played by people in the flow of mass communications. Free Press
1955
-
[31]
Lambiotte, R., Rosvall, M., and Scholtes, I. (2019). From networks to optimal higher-order models of complex systems. Nature physics , 15(4):313--320
2019
-
[32]
and Fortunato, S
Lancichinetti, A. and Fortunato, S. (2009). Community detection algorithms: a comparative analysis. Physical review E , 80(5):056117
2009
-
[33]
LaRock, T., Scholtes, I., and Eliassi-Rad, T. (2022). Sequential motifs in observed walks. Journal of Complex Networks , 10(5):cnac036
2022
-
[34]
Mastrandrea, R., Squartini, T., Fagiolo, G., and Garlaschelli, D. (2014). Enhanced reconstruction of weighted networks from strengths and degrees. New Journal of Physics , 16(4):043022
2014
-
[35]
Mattei, M., Pratelli, M., Caldarelli, G., Petrocchi, M., and Saracco, F. (2022). Bow-tie structures of twitter discursive communities. sci rep 12 (1): 12944
2022
-
[36]
Newman, M. (2018). Networks . Oxford university press
2018
-
[37]
O'Sullivan, D. J. P., O'Keeffe, G. J., Fennell, P. G., and Gleeson, J. P. (2015). Mathematical modeling of complex contagion on clustered networks. Frontiers in Physics , Volume 3 - 2015
2015
-
[38]
Parisi, F., Squartini, T., and Garlaschelli, D. (2020). A faster horse on a safer trail: generalized inference for the efficient reconstruction of weighted networks. New Journal of Physics , 22(5):053053
2020
-
[39]
Paul, I., Khattar, A., Kumaraguru, P., Gupta, M., and Chopra, S. (2019). Elites tweet? characterizing the twitter verified user network. In 2019 IEEE 35th International Conference on Data Engineering Workshops (ICDEW) , pages 278--285
2019
-
[40]
P., Peel , L., Gross , T., and De Domenico , M
Peixoto , T. P., Peel , L., Gross , T., and De Domenico , M. (2026). Graphs are maximally expressive for higher-order interactions . arXiv e-prints , page arXiv:2602.16937
-
[41]
Peixoto, T. P. and Rosvall, M. (2017). Modelling sequences and temporal networks with dynamic community structures. Nature communications , 8(1):582
2017
-
[42]
Picciolo, F., Ruzzenenti, F., Holme, P., and Mastrandrea, R. (2022). Weighted network motifs as random walk patterns. New journal of physics , 24(5):053056
2022
-
[43]
Pratelli, M., Saracco, F., and Petrocchi, M. (2024). Entropy-based detection of twitter echo chambers. PNAS nexus , 3(5):pgae177
2024
-
[44]
Radicioni, T., Saracco, F., Pavan, E., and Squartini, T. (2021). Analysing twitter semantic networks: the case of 2018 italian elections. Scientific Reports , 11(1):13207
2021
-
[45]
N., Albert, R., and Kumara, S
Raghavan, U. N., Albert, R., and Kumara, S. (2007). Near linear time algorithm to detect community structures in large-scale networks. Physical Review E—Statistical, Nonlinear, and Soft Matter Physics , 76(3):036106
2007
-
[46]
Riascos, A. P. and Mateos, J. L. (2021). Random walks on weighted networks: a survey of local and non-local dynamics. Journal of Complex Networks , 9(5):cnab032
2021
-
[47]
T., and Lambiotte, R
Salnikov, V., Schaub, M. T., and Lambiotte, R. (2016). Using higher-order markov models to reveal flow-based communities in networks. Scientific reports , 6(1):23194
2016
-
[48]
Saracco, F., Di Clemente, R., Gabrielli, A., and Squartini, T. (2015). Randomizing bipartite networks: the case of the world trade web. Scientific reports , 5(1):10595
2015
-
[49]
J., Clemente, R
Saracco, F., Straka, M. J., Clemente, R. D., Gabrielli, A., Caldarelli, G., and Squartini, T. (2017). Inferring monopartite projections of bipartite networks: an entropy-based approach. New Journal of Physics , 19(5):053022
2017
-
[50]
Scholtes, I. (2017). When is a network a network? multi-order graphical model selection in pathways and temporal networks. In Proceedings of the 23rd ACM SIGKDD international conference on knowledge discovery and data mining , pages 1037--1046
2017
-
[51]
Scholtes, I., Wider, N., and Garas, A. (2016). Higher-order aggregate networks in the analysis of temporal networks: path structures and centralities. The European Physical Journal B , 89(3):61
2016
-
[52]
K., Lizardo, O., and Makse, H
Serafino, M., Virginio Clemente, G., Flamino, J., Szymanski, B. K., Lizardo, O., and Makse, H. A. (2024). Analysis of flows in social media uncovers a new multi-step model of information spread. Journal of Statistical Mechanics: Theory and Experiment , 2024(11):113402
2024
-
[53]
S., Srivastava, D., Verma, M., and Muhuri, S
Singh, S. S., Srivastava, D., Verma, M., and Muhuri, S. (2025). Information diffusion analysis: process, model, deployment, and application. The Knowledge Engineering Review , 39:e11
2025
-
[54]
Sobkowicz, P. (2018). Opinion dynamics model based on cognitive biases of complex agents. Journal of Artificial Societies and Social Simulation (JASSS) , 21(4):8
2018
-
[55]
A., Waltman, L., and Van Eck, N
Traag, V. A., Waltman, L., and Van Eck, N. J. (2019). From louvain to leiden: guaranteeing well-connected communities. Scientific reports , 9(1):5233
2019
-
[56]
Vallarano, N., Bruno, M., Marchese, E., Trapani, G., Saracco, F., Cimini, G., Zanon, M., and Squartini, T. (2021). Fast and scalable likelihood maximization for exponential random graph models with local constraints. Scientific Reports 2021 11:1 , 11:1--33
2021
-
[57]
Vosoughi, S., Roy, D., and Aral, S. (2018). The spread of true and false news online. science , 359(6380):1146--1151
2018
-
[58]
Watts, D. J. and Dodds, P. S. (2007). Influentials, networks, and public opinion formation . Journal of Consumer Research , 34(4):441--458
2007
-
[59]
M., Mason, W
Wu, S., Hofman, J. M., Mason, W. A., and Watts, D. J. (2011). Who says what to whom on twitter. In Proceedings of the 20th International Conference on World Wide Web , WWW '11, page 705–714, New York, NY, USA. Association for Computing Machinery
2011
-
[60]
Zhao, Y., Bai, W., Qiao, T., and Wang, W. (2025). Modularity of online social networks acts as a reliable predictor of both whole-network and ego-network characteristics over time. Humanities and Social Sciences Communications , 12(1):1--10
2025
discussion (0)
Sign in with ORCID, Apple, or X to comment. Anyone can read and Pith papers without signing in.