On the asymptotic average diameter of blocks of uniformly distributed sequences and related results
Pith reviewed 2026-06-28 20:49 UTC · model grok-4.3
The pith
Optimization over d-stochastic measures yields sharp upper bounds on asymptotic average pairwise distances in blocks of uniformly distributed sequences.
A machine-rendered reading of the paper's core claim, the machinery that carries it, and where it could break.
Core claim
The supremum of the asymptotic average of each of the three distance aggregations, taken over all uniformly distributed sequences, equals the maximum value of the corresponding functional on the compact family of d-stochastic measures, and explicit sharp bounds are obtained by solving that optimization problem.
What carries the argument
The family of d-stochastic measures, which enlarges the problem to a compact optimization whose solutions are then shown to be attainable as limsups for actual uniformly distributed sequences.
If this is right
- The same sharp bounds apply simultaneously to maximal pairwise distance, minimal pairwise distance, and total pairwise distance within each block.
- Explicit numerical values for the bounds follow directly from the solution of the measure optimization problem.
- The bounds remain valid when the sequence is restricted to any interval of the unit interval.
- The method recovers and generalizes prior bounds for the special case of consecutive points (d=2).
Where Pith is reading between the lines
- The relaxation step may be reusable for other additive functionals defined on finite blocks of sequences.
- The explicit bounds could be used to test candidate low-discrepancy sequences for local clustering violations.
- Similar measure-theoretic enlargements might handle blocks in higher-dimensional or non-Euclidean spaces.
Load-bearing premise
The supremum attained by the relaxed optimization over d-stochastic measures equals the limsup of the corresponding quantity for uniformly distributed sequences.
What would settle it
A uniformly distributed sequence whose limsup of one of the three average distance quantities strictly exceeds the value obtained from the d-stochastic measure optimization.
Figures


read the original abstract
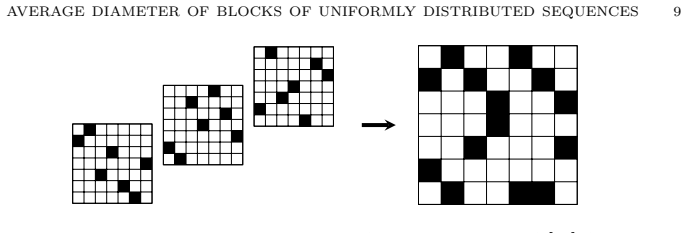
This paper was triggered by recent results on the maximal `average distance between consecutive points' of uniformly distributed sequences (u.f.d.s.). Here we address a generalized version of this question, consider pairwise maximal/minimal/total distances in blocks/segments of $ d \geq 2 $ consecutive points of u.f.d.s., and derive sharp upper bounds for all three aggregations. Our main idea of proof consists in, firstly, adding degrees of freedom, secondly, translating the resulting problem to a solvable optimization problem over the compact family of $ d $-stochastic measures, and, thirdly, showing that the obtained bounds are also sharp bounds for the original problem.
Editorial analysis
A structured set of objections, weighed in public.
Referee Report
Summary. The paper claims to derive sharp upper bounds on the asymptotic average maximal, minimal, and total pairwise distances within blocks of d consecutive points drawn from uniformly distributed sequences, for d ≥ 2. The proof proceeds by relaxing the problem (adding degrees of freedom), solving the resulting optimization over the compact family of d-stochastic measures, and then verifying that the obtained bounds remain sharp when restricted back to blocks arising from actual uniformly distributed sequences.
Significance. If the sharpness verification holds, the results would furnish explicit, sharp constants for these three aggregation functionals on blocks of u.d.s., extending recent work on consecutive-point distances. The relaxation technique to a compact optimization problem over d-stochastic measures supplies a reusable framework that could apply to other extremal questions in uniform distribution theory.
major comments (1)
- [Abstract] Abstract (three-step method): the load-bearing claim that the supremum attained over d-stochastic measures equals the limsup of the corresponding quantity over blocks of uniformly distributed sequences is asserted but not substantiated in the provided description; without an explicit construction showing that the optimizing measure arises as a weak-* limit of empirical measures from consecutive blocks of some u.d.s., the numerical value obtained in step (2) may strictly exceed what is attainable in the original setting.
Simulated Author's Rebuttal
We thank the referee for their careful reading of the manuscript and for highlighting the need to ensure the sharpness claim is clearly supported. We address the major comment below.
read point-by-point responses
-
Referee: [Abstract] Abstract (three-step method): the load-bearing claim that the supremum attained over d-stochastic measures equals the limsup of the corresponding quantity over blocks of uniformly distributed sequences is asserted but not substantiated in the provided description; without an explicit construction showing that the optimizing measure arises as a weak-* limit of empirical measures from consecutive blocks of some u.d.s., the numerical value obtained in step (2) may strictly exceed what is attainable in the original setting.
Authors: We agree the abstract is concise and provides only an outline of the three-step argument. The full manuscript substantiates the equality in the section following the solution of the relaxed optimization problem: an explicit construction is given of a uniformly distributed sequence (via a suitable low-discrepancy sequence whose d-block empirical measures converge in the weak-* topology to the identified optimizer) such that the limsup of the original aggregation functional equals the value attained over d-stochastic measures. This construction ensures the bound obtained in step (2) is attainable in the original setting and is therefore sharp. We are prepared to add a brief sentence to the abstract summarizing the existence of this construction if the referee considers it helpful for clarity. revision: partial
Circularity Check
No circularity: relaxation solved independently then sharpness proved separately
full rationale
The derivation relaxes the block-diameter problem by enlarging the feasible set to d-stochastic measures, obtains the optimum over that compact set, and then supplies an independent argument establishing that the same numerical value is attained as a limsup for actual blocks of uniformly distributed sequences. No equation equates the target quantity to a fitted parameter drawn from the same data, no self-citation is invoked as a uniqueness theorem that forces the result, and the sharpness step is not defined circularly in terms of the relaxed optimum itself. The method therefore remains self-contained against external benchmarks.
Axiom & Free-Parameter Ledger
Reference graph
Works this paper leans on
-
[1]
Bauer Wahrscheinlichkeitstheorie, de Gruyter, Berlin, New York, 2002
H. Bauer Wahrscheinlichkeitstheorie, de Gruyter, Berlin, New York, 2002
2002
-
[2]
Billingley Convergence of probability measures, Wiley Series in Probability and Statistics: Probability and Statistics John Wiley & Sons Inc., New York, Second edition
P. Billingley Convergence of probability measures, Wiley Series in Probability and Statistics: Probability and Statistics John Wiley & Sons Inc., New York, Second edition. 1999
1999
-
[3]
Bhattacharya, E
R. Bhattacharya, E. C. Waymire A Basic Course in Probability Theory, Springer-Verlag, New York, 2007
2007
-
[4]
Drmota, R
M. Drmota, R. F. Tichy Sequences, Discrepancies and Applications, In: Lecture Notes in Mathematics 1651 , Springer-Verlag, Berlin, 1997
1997
-
[5]
Durante, C
F. Durante, C. Sempi Copula Theory: An Introduction, Springer, 2015
2015
-
[6]
Fern\'andez S\'anchez, W
J. Fern\'andez S\'anchez, W. Trutschnig Conditioning based metrics on the space of multivariate copulas and their interrelation with uniform and levelwise convergence and Iterated Function Systems, Journal of Theoretical Probability 28 (2015), 1311--1336
2015
-
[7]
Griessenberger, R.R
F. Griessenberger, R.R. Junker, W. Trutschnig On a multivariate copula-based dependence measure and its estimation, Electronic Journal of Statistics 16 (2022), 2206--2251
2022
-
[8]
Janssen, J
P. Janssen, J. Swanepoel, N. Veraverbeke Large sample behavior of the Bernstein copula estimator, Journal of Statistical Planning and Inference 142(5) (2012), 1189--1197
2012
-
[9]
Kallenberg Foundations of modern probability, Springer-Verlag, New York, Berlin, Heidelberg, 1997
O. Kallenberg Foundations of modern probability, Springer-Verlag, New York, Berlin, Heidelberg, 1997
1997
-
[10]
Klenke Probability Theory - A Comprehensive Course, Springer-Verlag, Berlin, Heidelberg, 2007
A. Klenke Probability Theory - A Comprehensive Course, Springer-Verlag, Berlin, Heidelberg, 2007
2007
-
[11]
Kuipers, H
L. Kuipers, H. Niederreiter Uniform Distribution of Sequences, Wiley, New York, 1974; reprint, Dover Publications, Mineola, NY, 2006
1974
-
[12]
Kunze, D
H. Kunze, D. La Torre, F. Mendivil, E. R. Vrscay Fractal-Based Methods in Analysis, Springer Science & Business Media, 2011
2011
-
[13]
Pillichshammer, S
F. Pillichshammer, S. Steinerberger Average distance between consecutive points of uniformly distributed sequences, Unif. Distrib. Theory 4(1) (2009), 51--67
2009
-
[14]
van der Vaart, J.A
A. van der Vaart, J.A. Wellner Weak Convergence and Empirical Processes, Springer Series in Statistics, 1996
1996
discussion (0)
Sign in with ORCID, Apple, or X to comment. Anyone can read and Pith papers without signing in.