On the Relationship between Solar Spicules and Propagating Coronal Disturbances: The Role of Shocks
Pith reviewed 2026-06-28 12:23 UTC · model grok-4.3
The pith
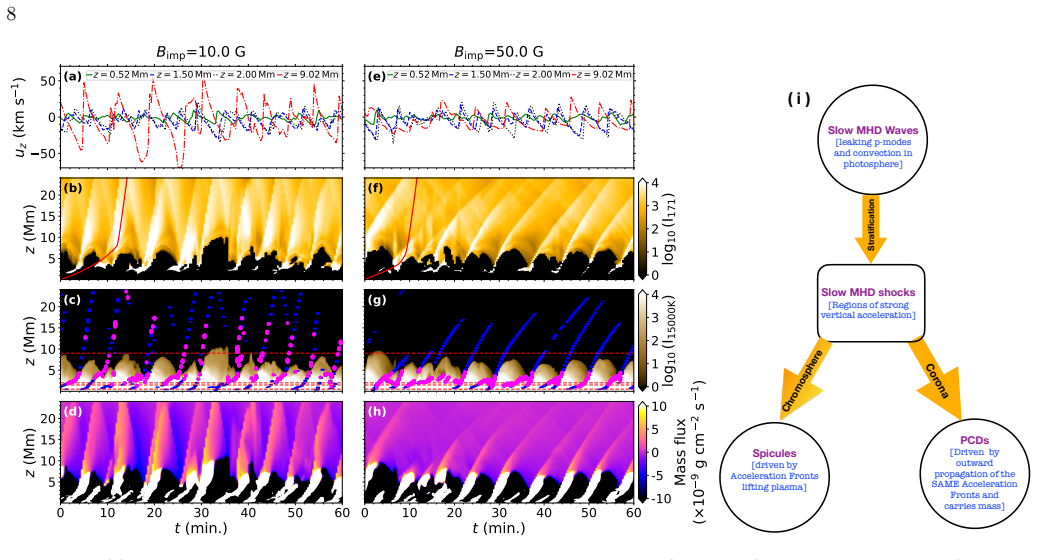
Shock waves from nonlinear steepening in the chromosphere drive some spicules and evolve into compressive MHD waves that produce propagating coronal disturbances.
A machine-rendered reading of the paper's core claim, the machinery that carries it, and where it could break.
Core claim
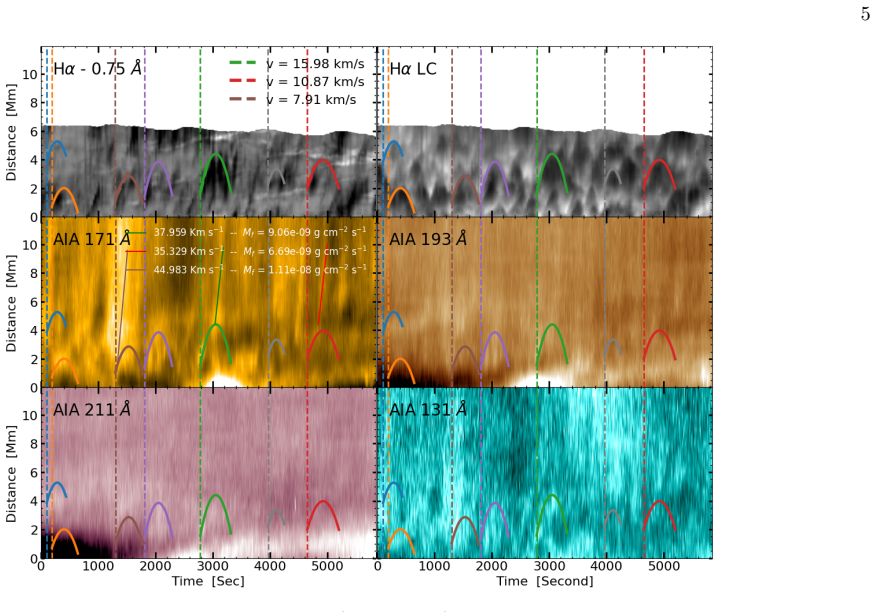
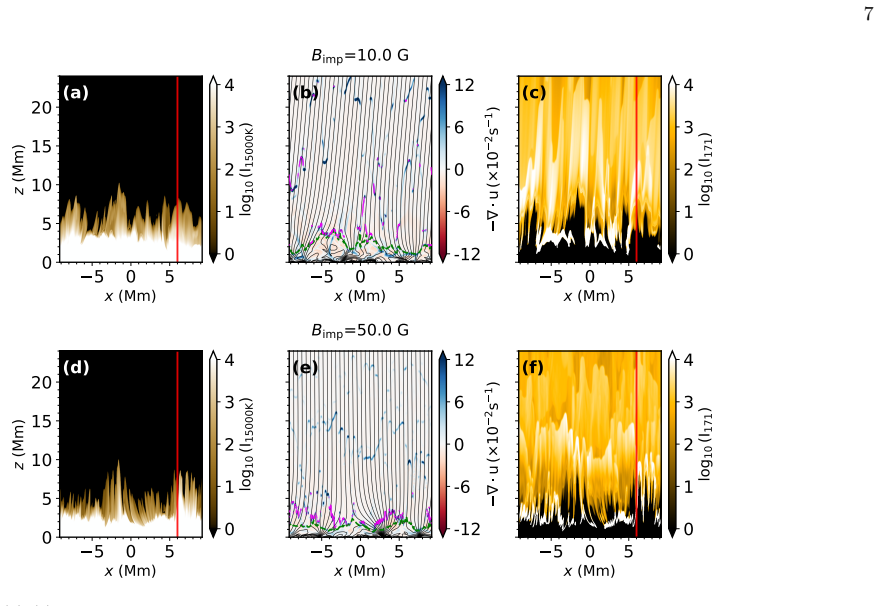
Using concurrent multiwavelength high-resolution observations from the Swedish 1-m Solar Telescope and the Solar Dynamics Observatory, supported with two-dimensional radiative magnetohydrodynamic simulations, the authors find that shock waves in the chromosphere generated from non-linear wave steepening drive some spicules. In the corona, these shock waves may transition into large amplitude non-linear compressive MHD waves depending on the magnetic field strength and the ambient coronal conditions. In either case, the shocks or the large-amplitude compressive waves in the corona transport upward mass flux and produce intensity variations in the form of PCDs in coronal passbands. Multi-heigh
What carries the argument
The shock-driven MHD mechanism in which chromospheric shocks from nonlinear wave steepening form spicules and transition to large-amplitude compressive waves that generate propagating coronal disturbances.
If this is right
- Shock waves drive some spicules via nonlinear wave steepening in the chromosphere.
- These shocks transition into large-amplitude compressive MHD waves in the corona based on magnetic field and conditions.
- The resulting waves or shocks produce intensity variations observed as propagating coronal disturbances.
- These features transport upward mass flux that may contribute to the solar wind.
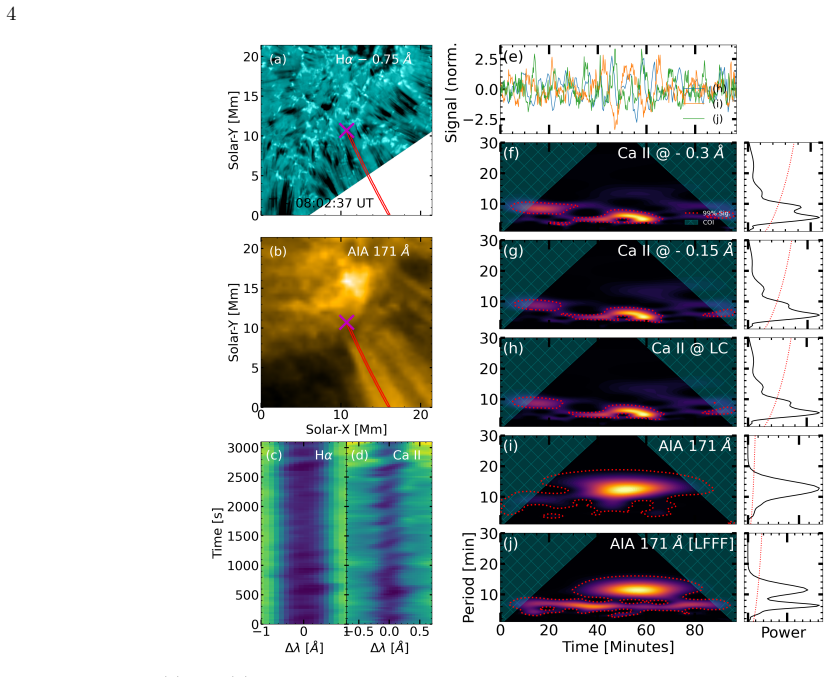
- Wave periods evolve from ~5 minutes to >=10 minutes with height due to dispersive propagation.
Where Pith is reading between the lines
- If the mass flux estimates are accurate, this mechanism could account for a measurable portion of solar wind mass supply.
- Similar shock-driven processes might occur in other regions of the solar atmosphere or in stars with analogous magnetic configurations.
- Testing the dependence on magnetic field strength could be done with observations in regions of varying field strength.
- The period evolution implies that wave energy might dissipate differently at different heights.
Load-bearing premise
The observed multiwavelength intensity variations and features in the simulations can be identified as shock waves or large-amplitude compressive MHD waves without major contamination from other processes or line-of-sight effects.
What would settle it
If simultaneous high-resolution observations at multiple heights show no correlation between chromospheric shock signatures at spicule bases and coronal intensity variations, or if the simulated wave amplitudes do not match observed ones, the proposed mechanism would be challenged.
Figures


read the original abstract
Spicules and propagating coronal disturbances (PCDs) are ubiquitous dynamic features of the solar atmosphere, yet their physical connection remains an open question of paramount importance to the mass and energy transport in the solar atmosphere. Using concurrent multiwavelength high-resolution observations from the Swedish 1-m Solar Telescope and the Solar Dynamics Observatory, supported with two-dimensional radiative magnetohydrodynamic (MHD) simulations, we find that i) shock waves in the chromosphere generated from non-linear wave steepening drive some spicules, ii) in the corona, these shock waves may transition into large amplitude non-linear compressive MHD waves depending on the magnetic field strength and the ambient coronal conditions. In either case, the shocks or the large-amplitude compressive waves in the corona, also transport upward mass flux and produce intensity variations in the form of PCDs in coronal passbands. Further a multi-height wavelet analysis shows dominant $\sim$5 minute periods in the lower chromosphere that evolve into longer periods ($\ge$10 minutes) at higher atmospheric layers, consistent with dispersive propagation in a stratified medium. The observational characteristics together with the numerical simulations, demonstrate that a shock-driven MHD mechanism links spicule formation to coronal disturbances. Finally, mass flux estimates from both the observations and the simulations indicate that these PCDs can also aid in supplying mass to the solar wind.
Editorial analysis
A structured set of objections, weighed in public.
Referee Report
Summary. The paper claims that chromospheric shock waves driven by non-linear wave steepening produce some spicules; these shocks transition into large-amplitude compressive MHD waves in the corona (depending on field strength and ambient conditions), transporting upward mass flux and generating intensity variations observed as propagating coronal disturbances (PCDs). Multi-height wavelet analysis shows dominant ~5 min periods in the lower chromosphere evolving to ≥10 min periods higher up, consistent with dispersive propagation. Concurrent SST/SDO multiwavelength observations and 2D radiative MHD simulations are used to argue that a shock-driven MHD mechanism links spicule formation to PCDs, with mass-flux estimates suggesting a contribution to solar-wind supply.
Significance. If the shock identification and causal mapping hold, the work supplies a concrete physical link between ubiquitous chromospheric dynamics and coronal mass/energy transport, with direct implications for solar-wind mass loading. The combination of high-resolution multiwavelength observations with 2D radiative MHD simulations is a methodological strength that allows direct comparison of synthetic and observed intensity signatures.
major comments (2)
- [Abstract, §3] Abstract and §3 (observational analysis): the central claim that the observed intensity variations are produced by chromospheric shocks (or their coronal extensions) rests on visual and period-matching similarity; no quantitative exclusion of line-of-sight superposition, slow-mode vs. fast-mode confusion, or non-shock drivers (e.g., reconnection jets) is described. This identification is load-bearing for the shock-driven MHD mechanism.
- [§4] §4 (simulations): the transition from shocks to large-amplitude compressive waves is stated to depend on magnetic-field strength and coronal conditions, yet the manuscript does not report the specific B-range explored, the resulting Mach-number evolution, or sensitivity tests that would demonstrate robustness against parameter variation.
minor comments (2)
- [§3] The wavelet-analysis description should specify the exact height ranges sampled and the mother wavelet employed to allow reproduction of the reported period evolution.
- [§5] Mass-flux estimates in both observations and simulations would benefit from explicit error budgets and a clear statement of the filling factor or area assumptions used.
Simulated Author's Rebuttal
We thank the referee for their careful reading and constructive comments. We address the major comments point by point below, indicating planned revisions where the manuscript can be strengthened without misrepresenting the existing analysis.
read point-by-point responses
-
Referee: [Abstract, §3] Abstract and §3 (observational analysis): the central claim that the observed intensity variations are produced by chromospheric shocks (or their coronal extensions) rests on visual and period-matching similarity; no quantitative exclusion of line-of-sight superposition, slow-mode vs. fast-mode confusion, or non-shock drivers (e.g., reconnection jets) is described. This identification is load-bearing for the shock-driven MHD mechanism.
Authors: The identification combines multi-height wavelet analysis (period evolution from ~5 min to ≥10 min consistent with dispersive propagation in a stratified atmosphere) with direct comparison to 2D radiative MHD simulations that reproduce the observed spicule and PCD signatures from chromospheric shocks. We agree that explicit discussion of alternatives would strengthen the paper. In revision we will add a paragraph in §3 addressing line-of-sight superposition (via height-dependent phase relations), mode identification (compressive signatures and speeds matching the model), and why reconnection is disfavored (periodic behavior without associated energetic events). This clarifies the argument on the basis of existing data and simulations. revision: partial
-
Referee: [§4] §4 (simulations): the transition from shocks to large-amplitude compressive waves is stated to depend on magnetic-field strength and coronal conditions, yet the manuscript does not report the specific B-range explored, the resulting Mach-number evolution, or sensitivity tests that would demonstrate robustness against parameter variation.
Authors: We accept this criticism. The simulations used photospheric B-fields of 20–100 G with corresponding coronal extensions, but these ranges, Mach-number profiles, and sensitivity runs were not reported in detail. We will revise §4 to tabulate the explored B-range and ambient conditions, describe the Mach-number evolution across atmospheric layers, and present results from additional sensitivity tests varying B and coronal base parameters to confirm robustness of the shock-to-wave transition. revision: yes
Circularity Check
No circularity; derivation self-contained via external observations and simulations
full rationale
The paper derives its central claim from concurrent multiwavelength observations (SST, SDO) and independent 2D radiative MHD simulations. The abstract states that observational characteristics and simulations demonstrate the shock-driven MHD mechanism linking spicules to PCDs, with period evolution and mass flux estimates. No self-definitional steps, fitted inputs renamed as predictions, load-bearing self-citations, or ansatzes smuggled via prior work are present. The identification of shocks relies on external data and simulation outputs rather than reducing to the paper's own inputs by construction. This is the most common honest finding for papers grounded in independent benchmarks.
Axiom & Free-Parameter Ledger
Forward citations
Cited by 1 Pith paper
-
Multi-thermal dynamics and transverse oscillations of solar spicules revealed by coordinated SST, IRIS, and SDO observations
Multi-instrument solar observations find spicules exhibit opposite Doppler flows in Hα and Si IV, coherent extension into AIA 171 Å, dominant 3-minute periods, and transverse oscillations with 3.3–9.9 km s⁻¹ amplitude...
Reference graph
Works this paper leans on
-
[1]
Asplund, M., Grevesse, N., Sauval, A. J., & Scott, P. 2009, ARA&A, 47, 481, doi: 10.1146/annurev.astro.46.060407.145222
-
[2]
2021, SSRv, 217, 76, doi: 10.1007/s11214-021-00849-0 15
Banerjee, D., Krishna Prasad, S., Pant, V., et al. 2021, SSRv, 217, 76, doi: 10.1007/s11214-021-00849-0 15
-
[3]
Beckers, J. M. 1972, ARA&A, 10, 73, doi: 10.1146/annurev.aa.10.090172.000445
-
[4]
2025, ApJL, 983, L7, doi: 10.3847/2041-8213/adc30d
Bose, S., Joshi, J., Testa, P., & De Pontieu, B. 2025, ApJL, 983, L7, doi: 10.3847/2041-8213/adc30d
-
[5]
W., De Moortel, I., & De Pontieu, B
Bryans, P., McIntosh, S. W., De Moortel, I., & De Pontieu, B. 2016, ApJL, 829, L18, doi: 10.3847/2041-8205/829/1/L18
-
[6]
Carlsson, M., De Pontieu, B., & Hansteen, V. H. 2019, ARA&A, 57, 189, doi: 10.1146/annurev-astro-081817-052044
-
[7]
Carlsson, M., & Stein, R. F. 1997, ApJ, 481, 500, doi: 10.1086/304043
-
[8]
2015, ApJL, 805, L21, doi: 10.1088/2041-8205/805/2/L21
Chae, J., Song, D., Seo, M., et al. 2015, ApJL, 805, L21, doi: 10.1088/2041-8205/805/2/L21
-
[9]
Chaurasiya, R., & Bayanna, A. R. 2025, MNRAS, 537, 2243, doi: 10.1093/mnras/staf045
-
[10]
Chaurasiya, R., Bayanna, A. R., & Erd´ elyi, R. 2025, MNRAS, 543, 3791, doi: 10.1093/mnras/staf1696
-
[11]
Chaurasiya, R., Bayanna, A. R., Louis, R. E., Pereira, T. M. D., & Mathew, S. K. 2024, ApJ, 970, 179, doi: 10.3847/1538-4357/ad50d5
-
[12]
Cheung, M. C. M., Boerner, P., Schrijver, C. J., et al. 2015, ApJ, 807, 143, doi: 10.1088/0004-637X/807/2/143 de la Cruz Rodr´ ıguez, J. 2019, A&A, 631, A153, doi: 10.1051/0004-6361/201936635 de la Cruz Rodr´ ıguez, J., L¨ ofdahl, M. G., S¨ utterlin, P.,
-
[13]
2015, A&A, 573, A40, doi: 10.1051/0004-6361/201424319 De Pontieu, B., Erd´ elyi, R., & James, S
Hillberg, T., & Rouppe van der Voort, L. 2015, A&A, 573, A40, doi: 10.1051/0004-6361/201424319 De Pontieu, B., Erd´ elyi, R., & James, S. P. 2004, Nature, 430, 536, doi: 10.1038/nature02749 Del Zanna, G. 2025, MNRAS, 543, 390, doi: 10.1093/mnras/staf1401
-
[14]
Dey, S., Chatterjee, P., O. V. S. N., Murthyand Kors´ os, M. B., et al. 2022, Nature Physics, 18, 595, doi: 10.1038/s41567-022-01522-1
-
[15]
Ding, J. Y., Madjarska, M. S., Doyle, J. G., et al. 2011, A&A, 535, A95, doi: 10.1051/0004-6361/201117515 Gonz´ alez-Avil´ es, J. J., Guzm´ an, F. S., Fedun, V., & Verth, G. 2020, ApJ, 897, 153, doi: 10.3847/1538-4357/ab97b8 Gopalan Priya, T., Su, J.-T., Chen, J., Deng, Y.-Y., & Prasad Choudhury, D. 2018, Research in Astronomy and Astrophysics, 18, 017, d...
-
[16]
H., De Pontieu, B., Rouppe van der Voort, L., van Noort, M., & Carlsson, M
Hansteen, V. H., De Pontieu, B., Rouppe van der Voort, L., van Noort, M., & Carlsson, M. 2006, ApJL, 647, L73, doi: 10.1086/507452
-
[17]
Harris, C. R., Millman, K. J., van der Walt, S. J., et al. 2020, Nature, 585, 357, doi: 10.1038/s41586-020-2649-2
-
[18]
H., De Pontieu, B., & Carlsson, M
Heggland, L., Hansteen, V. H., De Pontieu, B., & Carlsson, M. 2011, ApJ, 743, 142, doi: 10.1088/0004-637X/743/2/142
-
[19]
Hollweg, J. V. 1982, ApJ, 257, 345, doi: 10.1086/159993
-
[20]
Hunter, J. D. 2007, Computing in Science & Engineering, 9, 90, doi: 10.1109/MCSE.2007.55
-
[21]
2017, ApJ, 848, 38, doi: 10.3847/1538-4357/aa8ad1
Iijima, H., & Yokoyama, T. 2017, ApJ, 848, 38, doi: 10.3847/1538-4357/aa8ad1
-
[22]
Jafarzadeh, S., Jess, D. B., Stangalini, M., et al. 2025, Nature Reviews Methods Primers, 5, 21, doi: 10.1038/s43586-025-00392-0
-
[23]
2015, ApJL, 809, L17, doi: 10.1088/2041-8205/809/1/L17
Jiao, F., Xia, L., Li, B., et al. 2015, ApJL, 809, L17, doi: 10.1088/2041-8205/809/1/L17
-
[24]
2024, ApJ, 973, 49, doi: 10.3847/1538-4357/ad67d8
Kesri, K., Dey, S., Chatterjee, P., & Erdelyi, R. 2024, ApJ, 973, 49, doi: 10.3847/1538-4357/ad67d8
-
[25]
Lemen, J. R., Title, A. M., Akin, D. J., et al. 2012, SoPh, 275, 17, doi: 10.1007/s11207-011-9776-8
-
[26]
J., Snow, B., Wang, Y., & Erd´ elyi, R
Liu, J., Nelson, C. J., Snow, B., Wang, Y., & Erd´ elyi, R. 2019, Nature Communications, 10, 3504, doi: 10.1038/s41467-019-11495-0 L¨ ofdahl, M. G., Hillberg, T., de la Cruz Rodr´ ıguez, J., et al. 2021, A&A, 653, A68, doi: 10.1051/0004-6361/202141326 Mart´ ınez-Sykora, J., De Pontieu, B., De Moortel, I.,
-
[27]
Hansteen, V. H., & Carlsson, M. 2018, ApJ, 860, 116, doi: 10.3847/1538-4357/aac2ca Mart´ ınez-Sykora, J., De Pontieu, B., Hansteen, V. H., et al. 2017, Science, 356, 1269, doi: 10.1126/science.aah5412
-
[28]
Murawski, K., & Zaqarashvili, T. V. 2010, A&A, 519, A8, doi: 10.1051/0004-6361/201014128
-
[29]
2026, arXiv e-prints, arXiv:2602.19953, doi: 10.48550/arXiv.2602.19953
Ni, L., Lin, J., Samanta, T., et al. 2026, arXiv e-prints, arXiv:2602.19953, doi: 10.48550/arXiv.2602.19953
-
[30]
2026, A&A, 705, A86, doi: 10.1051/0004-6361/202556375
Noraz, Q., Carlsson, M., & Aulanier, G. 2026, A&A, 705, A86, doi: 10.1051/0004-6361/202556375
-
[31]
Oxley, W., Scalisi, J., Ruderman, M. S., & Erd´ elyi, R. 2020, ApJ, 905, 168, doi: 10.3847/1538-4357/abcafe Pencil Code Collaboration, Brandenburg, A., Johansen, A., et al. 2021, The Journal of Open Source Software, 6, 2807, doi: 10.21105/joss.02807
-
[32]
Pereira, T. M. D., De Pontieu, B., Carlsson, M., et al. 2014, ApJL, 792, L15, doi: 10.1088/2041-8205/792/1/L15
-
[33]
Pesnell, W. D., Thompson, B. J., & Chamberlin, P. C. 2012, SoPh, 275, 3, doi: 10.1007/s11207-011-9841-3
-
[34]
1979, SoPh, 61, 23, doi: 10.1007/BF00155443 Rouppe van der Voort, L., De Pontieu, B., Pereira, T
Roberts, B. 1979, SoPh, 61, 23, doi: 10.1007/BF00155443 Rouppe van der Voort, L., De Pontieu, B., Pereira, T. M. D., Carlsson, M., & Hansteen, V. 2015, ApJL, 799, L3, doi: 10.1088/2041-8205/799/1/L3 Rouppe van der Voort, L. H. M., Rutten, R. J., S¨ utterlin, P., Sloover, P. J., & Krijger, J. M. 2003, A&A, 403, 277, doi: 10.1051/0004-6361:20030237
-
[35]
2020, ApJ, 900, 120, doi: 10.3847/1538-4357/ababa0
Sakaue, T., & Shibata, K. 2020, ApJ, 900, 120, doi: 10.3847/1538-4357/ababa0
-
[36]
2019, Science, 366, 890, doi: 10.1126/science.aaw2796 16
Samanta, T., Tian, H., Yurchyshyn, V., et al. 2019, Science, 366, 890, doi: 10.1126/science.aaw2796 16
-
[37]
Sand, M. O., Rouppe van der Voort, L. H. M., Joshi, J., et al. 2025, A&A, 697, A180, doi: 10.1051/0004-6361/202453032
-
[38]
Scharmer, G. B., Bjelksjo, K., Korhonen, T. K., Lindberg, B., & Petterson, B. 2003, in Society of Photo-Optical Instrumentation Engineers (SPIE) Conference Series, Vol. 4853, Innovative Telescopes and Instrumentation for Solar Astrophysics, ed. S. L. Keil & S. V. Avakyan, 341–350, doi: 10.1117/12.460377
-
[39]
B., Narayan, G., Hillberg, T., et al
Scharmer, G. B., Narayan, G., Hillberg, T., et al. 2008, The Astrophysical Journal, 689, L69
2008
-
[40]
Scherrer, P. H., Schou, J., Bush, R. I., et al. 2012, SoPh, 275, 207, doi: 10.1007/s11207-011-9834-2
-
[41]
J., Samanta, T., & Van Doorsselaere, T
Skirvin, S. J., Samanta, T., & Van Doorsselaere, T. 2024, A&A, 689, A135, doi: 10.1051/0004-6361/202450186
-
[42]
Snow, B., Hillier, A., Murtas, G., & Botha, G. J. J. 2021, Experimental Results, 2, e35, doi: 10.1017/exp.2021.28 Sow Mondal, S., Klimchuk, J. A., & Sarkar, A. 2022, ApJ, 937, 71, doi: 10.3847/1538-4357/ac879b
-
[43]
K., Singh, A., Singh, B., et al
Srivastava, A. K., Singh, A., Singh, B., et al. 2024, Philosophical Transactions of the Royal Society of London Series A, 382, 20230220, doi: 10.1098/rsta.2023.0220
-
[44]
2025, ApJ, 989, 39, doi: 10.3847/1538-4357/ade9b4
Srivastava, S., Chatterjee, P., Dey, S., & Erd´ elyi, R. 2025, ApJ, 989, 39, doi: 10.3847/1538-4357/ade9b4
-
[45]
Su, Y., Veronig, A. M., Hannah, I. G., et al. 2018, ApJL, 856, L17, doi: 10.3847/2041-8213/aab436
-
[46]
1995, ApJ, 450, 411, doi: 10.1086/176151 The SunPy Community, Barnes, W
Suematsu, Y., Wang, H., & Zirin, H. 1995, ApJ, 450, 411, doi: 10.1086/176151 The SunPy Community, Barnes, W. T., Bobra, M. G., et al. 2020, The Astrophysical Journal, 890, 68, doi: 10.3847/1538-4357/ab4f7a
-
[47]
E., & Schmieder, B
Tsiropoula, G., Alissandrakis, C. E., & Schmieder, B. 1994, A&A, 290, 285
1994
-
[48]
Tsiropoula, G., Tziotziou, K., Kontogiannis, I., et al. 2012, SSRv, 169, 181, doi: 10.1007/s11214-012-9920-2 Van Noort, M., Rouppe Van Der Voort, L., & L¨ ofdahl, M. G. 2005, SoPh, 228, 191, doi: 10.1007/s11207-005-5782-z
-
[49]
Virtanen, P., Gommers, R., Oliphant, T. E., et al. 2020, Nature Methods, 17, 261, doi: 10.1038/s41592-019-0686-2
-
[50]
Withbroe, G. L., & Noyes, R. W. 1977, ARA&A, 15, 363, doi: 10.1146/annurev.aa.15.090177.002051
-
[51]
2013, ApJ, 767, 17, doi: 10.1088/0004-637X/767/1/17
Yurchyshyn, V., Abramenko, V., & Goode, P. 2013, ApJ, 767, 17, doi: 10.1088/0004-637X/767/1/17
discussion (0)
Sign in with ORCID, Apple, or X to comment. Anyone can read and Pith papers without signing in.