StageFrontier: Synchronization-Aware Stage Accounting for Distributed ML Training
Pith reviewed 2026-06-27 23:17 UTC · model grok-4.3
The pith
StageFrontier builds an exact additive accounting of exposed time in distributed training by advancing a frontier to the furthest rank at each stage boundary.
A machine-rendered reading of the paper's core claim, the machinery that carries it, and where it could break.
Core claim
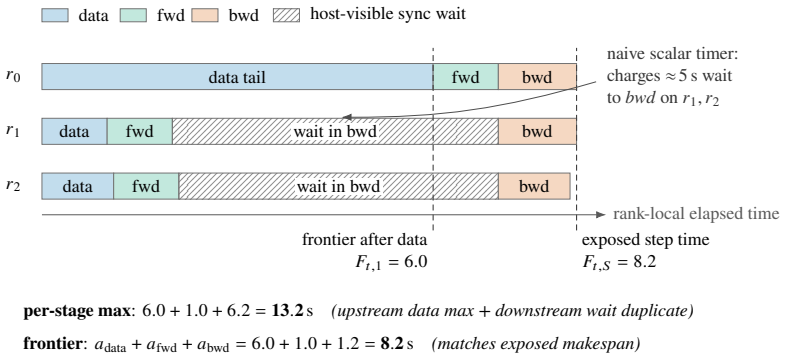
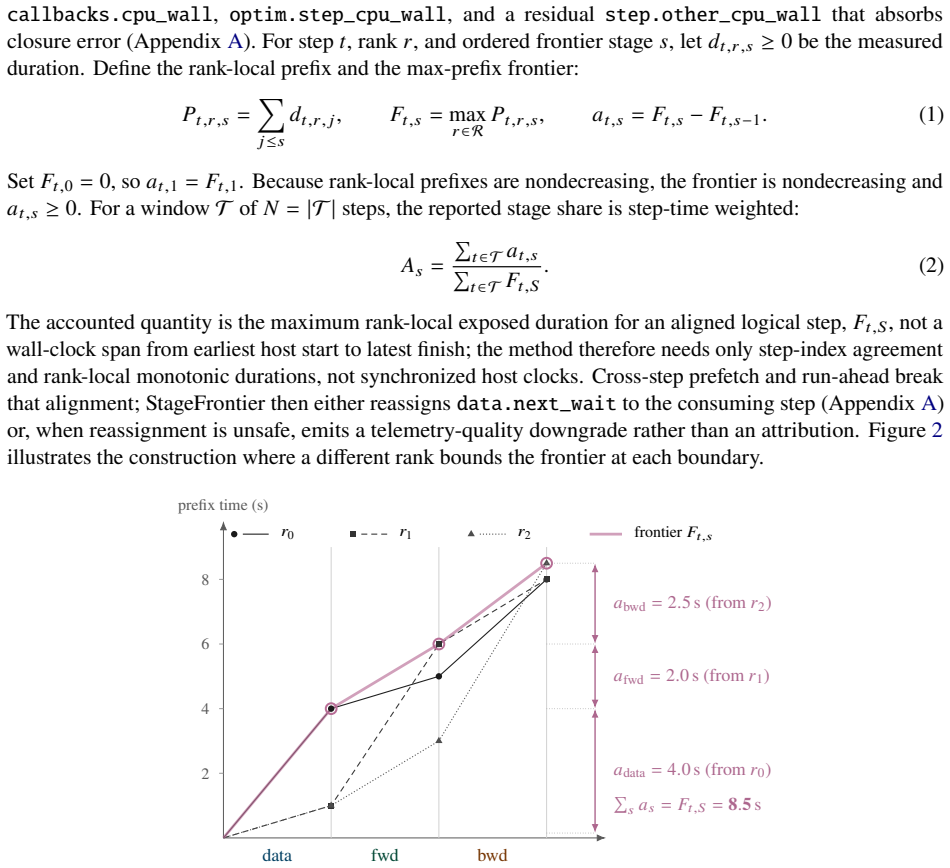
StageFrontier takes the cumulative time of whichever rank is furthest along at each stage boundary; the increments of this frontier form an exact, additive accounting of the step's exposed time and point to the stage and rank where group-visible delay first appears.
What carries the argument
The frontier, formed by selecting the maximum cumulative stage time across all ranks at each boundary, which aggregates exposed delays additively.
Load-bearing premise
Reporting only coarse stage durations timed with unsynchronized per-rank CPU wall clocks is sufficient to produce an exact exposed-time accounting without missing or misattributing delays caused by fine-grained synchronization or overlapping activity within a stage.
What would settle it
A concrete run in which a delay arises from fine-grained synchronization inside one reported stage yet the frontier attributes the exposed time to a different stage or rank.
Figures
read the original abstract
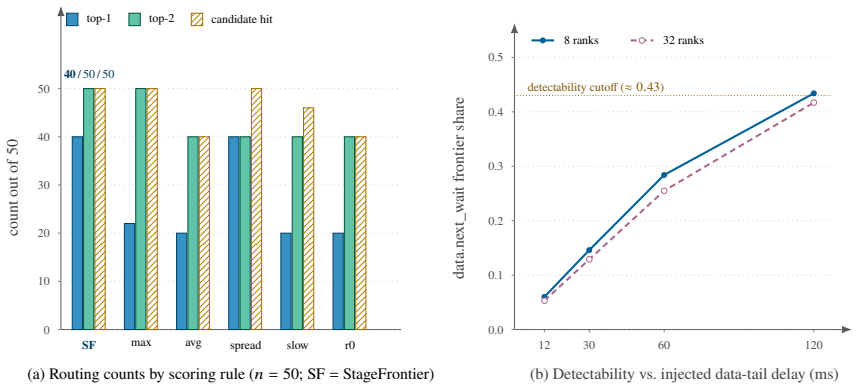
When a distributed training job slows down, the hard part is knowing where to look. Synchronization hides the cause: a stall on one rank shows up as a wait on the others, so a data delay on a single rank can surface as backward time across the group. The cheap dashboards that run all the time -- per-stage averages and maxima -- misread this, double-counting the same exposed delay or burying the slow rank in an average, while full profilers see it clearly but are far too heavy to leave on. StageFrontier is an always-on signal that closes this gap. Each rank reports only a short ordered vector of coarse stage durations -- data, forward, backward, and so on -- timed with CPU wall-clock, with no synchronized clocks and no kernel tracing. At each stage boundary, StageFrontier takes the cumulative time of whichever rank is furthest along; the increments of this frontier form an exact, additive accounting of the step's exposed time and point to the stage and rank where group-visible delay first appears, telling an operator where to aim a heavy profiler, not which fix to make. The accounting is exact, but the coarse signal alone cannot tell whether a leading stage truly caused the slowdown or merely ran alongside it; StageFrontier labels the windows where that distinction needs more evidence instead of guessing. A PyTorch implementation adds under 0.2% throughput overhead through 128 ranks on Gloo and NCCL, places injected faults among its top two suspects on all 50 rows of a hidden-rank DDP test, and recovers the same top-stage routing as PyTorch Profiler, HTA, and Nsight Systems once their traces are reduced to the same coarse stages -- from a 0.11 MB summary instead of a 15.81 GB trace.
Editorial analysis
A structured set of objections, weighed in public.
Referee Report
Summary. The paper introduces StageFrontier, a lightweight always-on accounting method for exposed time in distributed ML training. Each rank emits a short vector of coarse stage durations (data, forward, backward, etc.) timed with unsynchronized per-rank CPU wall clocks. At each stage boundary the method selects the maximum cumulative time across ranks to form a 'frontier'; the increments of this frontier are claimed to yield an exact, additive decomposition of the step's exposed time that identifies the originating stage and rank. The PyTorch implementation reports <0.2% overhead on 128 ranks, places injected faults among its top two suspects in all 50 hidden-rank DDP trials, and recovers the same top-stage routing as PyTorch Profiler, HTA, and Nsight Systems once their traces are reduced to the same coarse stages.
Significance. If the exactness claim holds after addressing clock synchronization, StageFrontier would supply a practical, low-overhead signal that narrows the search space for heavy profilers in production distributed training. The reproduction of profiler top-stage results from a 0.11 MB summary rather than multi-GB traces, together with the fault-injection validation, would constitute a concrete engineering contribution to observability in data-parallel workloads.
major comments (1)
- [Abstract] Abstract: the central claim that 'the increments of this frontier form an exact, additive accounting of the step's exposed time' is load-bearing yet rests on the max-across-ranks operation applied to unsynchronized per-rank CPU wall-clock cumulatives. A constant offset on any rank shifts all its cumulatives and can change which rank is selected as furthest at a boundary, altering both the magnitude and the attribution of the selected increments. The manuscript states 'no synchronized clocks' but supplies neither an invariance argument nor a skew-correction step, leaving the exactness assertion unsupported.
Simulated Author's Rebuttal
We thank the referee for the careful reading and for identifying the need for an explicit invariance argument supporting the exactness claim. We address the comment below.
read point-by-point responses
-
Referee: [Abstract] Abstract: the central claim that 'the increments of this frontier form an exact, additive accounting of the step's exposed time' is load-bearing yet rests on the max-across-ranks operation applied to unsynchronized per-rank CPU wall-clock cumulatives. A constant offset on any rank shifts all its cumulatives and can change which rank is selected as furthest at a boundary, altering both the magnitude and the attribution of the selected increments. The manuscript states 'no synchronized clocks' but supplies neither an invariance argument nor a skew-correction step, leaving the exactness assertion unsupported.
Authors: The referee correctly observes that the manuscript does not supply an explicit invariance argument. We clarify the measurement procedure here and will incorporate the argument into the revised manuscript. Stage durations are obtained locally on each rank as differences of CPU wall-clock readings (end minus start for that stage on that rank). Any constant clock offset therefore cancels within each duration, and the per-rank cumulative is the elapsed time on the local clock since the step began. Because every training step begins at the same physical instant (synchronized by the preceding collective), the local elapsed times are directly comparable across ranks. With negligible drift over a single step, the maximum cumulative at each boundary is the latest true elapsed time, and the successive increments of this frontier exactly partition the total exposed step time while attributing each increment to the stage and rank that extended the frontier. Consequently the construction requires neither synchronized clocks nor an explicit skew-correction step; invariance follows from the use of local duration differences. We will revise the abstract to reference the duration-based measurement and add a concise formal argument to Section 3. revision: yes
Circularity Check
No significant circularity; construction is definitional
full rationale
The paper defines StageFrontier directly as the per-boundary max cumulative wall-clock time across ranks, then states that the increments of this frontier constitute the exact additive accounting of exposed time. This is a self-contained definitional construction on the observed stage vectors rather than a derivation that reduces by construction to fitted parameters, self-citations, or imported uniqueness results. No load-bearing self-citation, ansatz smuggling, or renaming of known results appears in the central claim. The exactness assertion follows tautologically from the max operation itself and does not invoke external theorems or prior author work to force the result. The skeptic concern about unsynchronized clocks addresses potential correctness or invariance but does not identify a circular reduction in the derivation chain.
Axiom & Free-Parameter Ledger
axioms (1)
- domain assumption CPU wall-clock times recorded independently on each rank can be compared across ranks at stage boundaries without synchronized clocks
invented entities (1)
-
StageFrontier frontier
no independent evidence
Reference graph
Works this paper leans on
-
[1]
L. Adhianto, S. Banerjee, M. Fagan, M. Krentel, G. Marin, J. Mellor-Crummey, and N. R. Tallent. HPCTOOLKIT: Tools for performance analysis of optimized parallel programs.Concurrency and Computation: Practice and Experience, 22(6): 685–701, 2010. doi: 10.1002/cpe.1553
-
[2]
M. M. U. Alam, T. Liu, G. Zeng, and A. Muzahid. Syncperf: Categorizing, detecting, and diagnosing synchronization performance bugs. InProceedings of the Twelfth European Conference on Computer Systems, pages 298–313. ACM, 2017. doi: 10.1145/3064176.3064186
-
[3]
D. Böhme, M. Geimer, F. Wolf, and L. Arnold. Identifying the root causes of wait states in large-scale parallel applications. In Proceedings of the 39th International Conference on Parallel Processing, pages 90–100, 2010. doi: 10.1109/ICPP.2010.18
-
[4]
Böhme, B
D. Böhme, B. R. de Supinski, M. Geimer, M. Schulz, and F. Wolf. Scalable critical-path based performance analysis. In Proceedings of the 26th IEEE International Parallel and Distributed Processing Symposium, 2012
2012
-
[5]
C. Curtsinger and E. D. Berger. Coz: Finding code that counts with causal profiling. InProceedings of the 25th Symposium on Operating Systems Principles, pages 184–197, 2015. doi: 10.1145/2815400.2815409
-
[6]
Symbolic execution for software testing: Three decades later,
J. Dean and L. A. Barroso. The tail at scale.Communications of the ACM, 56(2):74–80, 2013. doi: 10.1145/2408776.2408794
-
[7]
DeepSpeed communication logging
DeepSpeed Contributors. DeepSpeed communication logging. https://www.deepspeed.ai/tutorials/comms-logging/, 2026. Accessed 2026-05-10
2026
-
[8]
DeepSpeedContributors.DeepSpeedflopsprofilerdocumentation.https://deepspeed.readthedocs.io/en/latest/flops-profiler.html,
-
[9]
M. Geimer, F. Wolf, B. J. N. Wylie, and B. Mohr. The scalasca performance toolset architecture. InInternational Workshop on Scalable Tools for High-End Computing, pages 51–65. Springer, 2008. doi: 10.1007/978-3-540-68564-7_5
-
[10]
M. Geimer, F. Wolf, B. J. N. Wylie, E. Ábrahám, D. Becker, and B. Mohr. The Scalasca performance toolset architecture. Concurrency and Computation: Practice and Experience, 22(6):702–719, 2010. doi: 10.1002/cpe.1556
-
[11]
Horovod Timeline: Analyze performance
Horovod Contributors. Horovod Timeline: Analyze performance. https://horovod.readthedocs.io/en/stable/timeline_include. html, 2026. Accessed 2026-05-10
2026
-
[12]
H. Hu, C. Jiang, Y. Zhong, Y. Peng, C. Wu, Y. Zhu, H. Lin, and C. Guo. dPRO: A generic performance diagnosis and optimization toolkit for expediting distributed DNN training. InProceedings of Machine Learning and Systems, volume 4,
-
[13]
URL https://proceedings.mlsys.org/paper_files/paper/2022/hash/b422680f3db0986ddd7f8f126baaf0fa-Abstract.html
2022
-
[14]
Jiang, H
Z. Jiang, H. Lin, Y. Zhong, Q. Huang, Y. Chen, Z. Zhang, Y. Peng, X. Li, C. Xie, S. Nong, Y. Jia, S. He, H. Chen, Z. Bai, 20 Q. Hou, S. Yan, D. Zhou, Y. Sheng, Z. Jiang, H. Xu, H. Wei, Z. Zhang, P. Nie, L. Zou, S. Zhao, L. Xiang, Z. Liu, Z. Li, X. Jia, J. Ye, X. Jin, and X. Liu. Megascale: Scaling large language model training to more than 10,000 gpus. In...
2024
-
[15]
Plumber: Diagnosingandremovingperformancebottlenecks in machine learning data pipelines
M.Kuchnik,A.Klimovic,J.Simsa,V.Smith,andG.Amvrosiadis. Plumber: Diagnosingandremovingperformancebottlenecks in machine learning data pipelines. InProceedings of Machine Learning and Systems, volume 4, pages 33–51, 2022. URL https://proceedings.mlsys.org/paper_files/paper/2022/hash/d0e90e9a9310570dfa643aa3b2da6e89-Abstract.html
2022
-
[16]
S.Li,Y.Zhao,R.Varma,O.Salpekar,P.Noordhuis,T.Li,A.Paszke,J.Smith,B.Vaughan,P.Damania,andS.Chintala. Pytorch distributed: Experiences on accelerating data parallel training.Proceedings of the VLDB Endowment, 13(12):3005–3018, 2020. doi: 10.14778/3415478.3415530. URL https://arxiv.org/abs/2006.15704
-
[17]
J. Lin, Z. Jiang, Z. Song, S. Zhao, M. Yu, Z. Wang, C. Wang, Z. Shi, X. Shi, W. Jia, Z. Liu, S. Wang, H. Lin, X. Liu, A. Panda, and J. Li. Understanding stragglers in large model training using what-if analysis. In19th USENIX Symposium on Operating Systems Design and Implementation (OSDI 25), pages 483–498. USENIX Association, 2025. URL https: //www.useni...
2025
-
[18]
P.Mattson,C.Cheng,C.Coleman,G.Diamos,P.Micikevicius,D.Patterson,H.Tang,G.-Y.Wei,P.Bailis,V.Bittorf,D.Brooks, D. Chen, D. Dutta, U. Gupta, K. Hazelwood, A. Hock, X. Huang, A. Ike, B. Jia, D. Kang, D. Kanter, N. Kumar, J. Liao, G. Ma, D. Narayanan, T. Oguntebi, G. Pekhimenko, L. Pentecost, V. J. Reddi, T. Robie, T. St. John, T. Tabaru, C.-J. Wu, L. Xu, M. Y...
arXiv 2020
-
[19]
HolisticTraceAnalysis/TraceInsightdocumentation
MetaPlatforms,Inc. HolisticTraceAnalysis/TraceInsightdocumentation. https://hta.readthedocs.io/en/latest/,2026. Accessed 2026-05-11
2026
-
[20]
NVIDIA Nsight Systems user guide
NVIDIA. NVIDIA Nsight Systems user guide. https://docs.nvidia.com/nsight-systems/UserGuide/index.html, 2026. Accessed 2026-05-10
2026
-
[21]
CUDA Semantics
PyTorch Contributors. CUDA Semantics. https://docs.pytorch.org/docs/2.6/notes/cuda.html, 2026. Accessed 2026-05-30
2026
-
[22]
torch.cuda.Event documentation
PyTorch Contributors. torch.cuda.Event documentation. https://docs.pytorch.org/docs/2.6/generated/torch.cuda.Event.html,
-
[23]
DistributedDataParallel documentation
PyTorch Contributors. DistributedDataParallel documentation. https://docs.pytorch.org/docs/2.6/generated/torch.nn.parallel. DistributedDataParallel.html, 2026. Accessed 2026-05-30
2026
-
[24]
torch.profilerdocumentation
PyTorchContributors. torch.profilerdocumentation. https://docs.pytorch.org/docs/2.6/profiler.html,2026. Accessed2026-05-30
2026
-
[25]
S. Rajbhandari, J. Rasley, O. Ruwase, and Y. He. ZeRO: Memory optimizations toward training trillion parameter models. arXiv preprint arXiv:1910.02054, 2020. URL https://arxiv.org/abs/1910.02054
Pith/arXiv arXiv 1910
-
[27]
URL https://arxiv.org/abs/1802.05799
-
[28]
S. S. Shende and A. D. Malony. The TAU parallel performance system.International Journal of High Performance Computing Applications, 20(2):287–331, 2006. doi: 10.1177/1094342006064482
-
[29]
S.Sridharan,T.Heo,L.Feng,Z.Wang,M.Bergeron,W.Fu,S.Zheng,B.Coutinho,S.Rashidi,C.Man,andT.Krishna. Chakra: Advancing performance benchmarking and co-design using standardized execution traces.arXiv preprint arXiv:2305.14516,
-
[30]
URL https://arxiv.org/abs/2305.14516
doi: 10.48550/arXiv.2305.14516. URL https://arxiv.org/abs/2305.14516
-
[31]
TensorFlow Profiler: Optimize tensorflow performance
TensorFlow Contributors. TensorFlow Profiler: Optimize tensorflow performance. https://www.tensorflow.org/guide/profiler,
-
[32]
T.Wu,W.Wang,Y.Yu,S.Yang,W.Wu,Q.Duan,G.Yang,J.Wang,L.Qu,andL.Zhang. FALCON:Pinpointingandmitigating stragglers for large-scale hybrid-parallel training.arXiv preprint arXiv:2410.12588, 2024. doi: 10.48550/arXiv.2410.12588. URL https://arxiv.org/abs/2410.12588
-
[33]
GREYHOUND:HuntingFail-Slows in Hybrid-Parallel training at scale
T.Wu,W.Wang,Y.Yu,S.Yang,W.Wu,Q.Duan,G.Yang,J.Wang,L.Qu,andL.Zhang. GREYHOUND:HuntingFail-Slows in Hybrid-Parallel training at scale. In2025 USENIX Annual Technical Conference (USENIX ATC 25), pages 731–747, Boston, MA, 2025. USENIX Association. URL https://www.usenix.org/conference/atc25/presentation/wu-tianyuan. 21
2025
discussion (0)
Sign in with ORCID, Apple, or X to comment. Anyone can read and Pith papers without signing in.