MS-COOT: Comparing Morse-Smale Complexes with Co-Optimal Transport
Pith reviewed 2026-06-27 18:46 UTC · model grok-4.3
The pith
MS-COOT computes distances between Morse-Smale complexes by matching both critical points and their induced regions via co-optimal transport.
A machine-rendered reading of the paper's core claim, the machinery that carries it, and where it could break.
Core claim
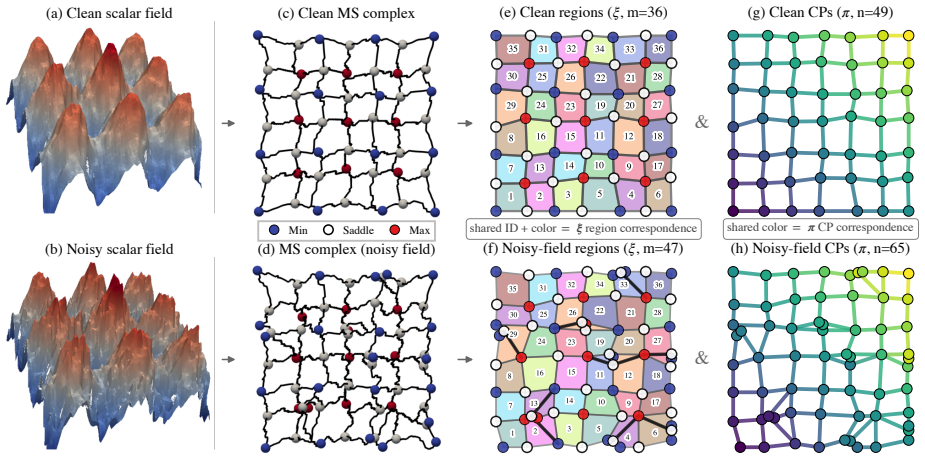
The central discovery is that by formulating the comparison of Morse-Smale complexes as a co-optimal transport problem on their hypergraph representations, one can jointly optimize correspondences for both critical points and regions, thereby obtaining a distance that reflects region-level structural changes such as splits and merges.
What carries the argument
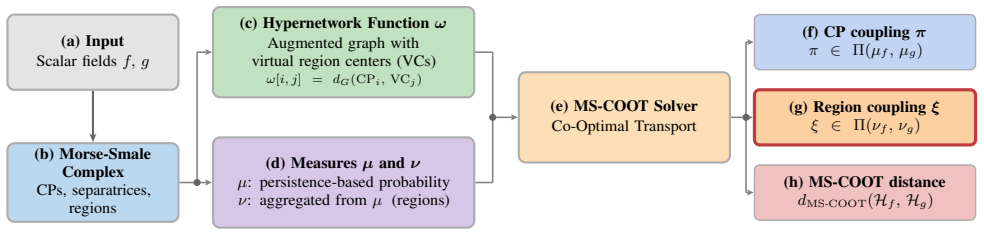
The co-optimal transport formulation on a hypergraph where nodes are critical points and hyperedges are regions, instantiated with a hypernetwork for relationships, persistence-based measures, and attribute-based sample costs.
If this is right
- It identifies region splitting and merging events during comparison.
- It achieves strong results in classifying different scalar field structures.
- It distinguishes data at different resolutions more effectively than graph-based methods.
- It works on 2D simulations, 3D meshes, and volumetric data.
Where Pith is reading between the lines
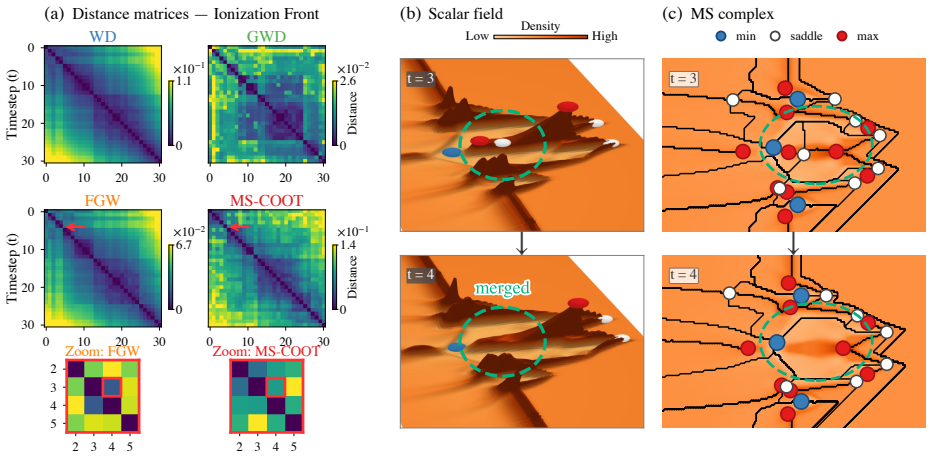
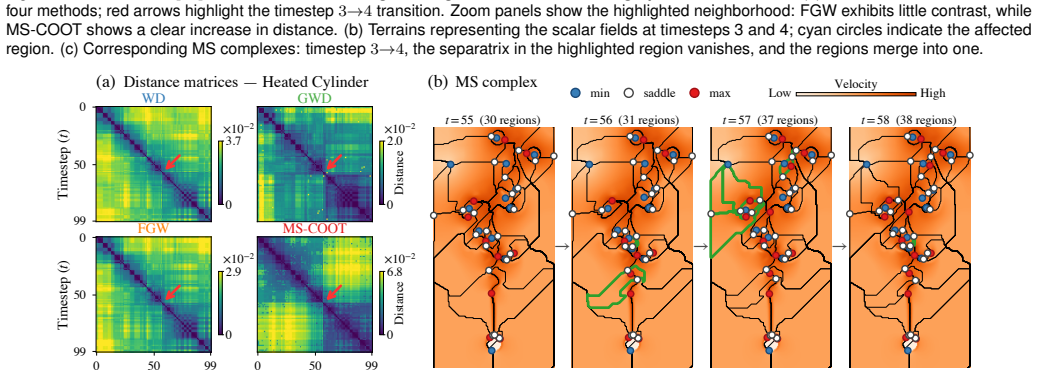
- This approach could be used to track topological changes in time-varying scalar fields.
- Similar techniques might improve comparisons in other areas of topological data analysis.
- The hypergraph transport could generalize to matching other types of topological structures.
Load-bearing premise
That the hypergraph representation of regions and the co-optimal transport with the specified components yields correspondences and distances that accurately capture the topological structure and events in the scalar field.
What would settle it
A test where two complexes differ only by a known region split or merge, but the computed distance does not increase accordingly or fails to outperform graph distances in detecting the change.
Figures


read the original abstract
Understanding and comparing structures in scalar fields is a central challenge in scientific visualization, with applications ranging from feature analysis to temporal and structural comparison. The Morse-Smale (MS) complex provides a natural representation by decomposing a scalar field into regions induced by gradient flow. However, existing approaches typically rely on graph-based representations, capturing relationships between critical points while discarding region-level structure. In this work, we represent the MS complex as a hypergraph, where critical points form nodes and regions define hyperedges. We introduce MS-COOT, a co-optimal transport distance that jointly computes correspondences between critical points and regions. This formulation enables explicit region-to-region matching within a distance-based framework, allowing identification of region-level events such as splitting and merging. We instantiate this framework with domain-specific components, including a hypernetwork function encoding critical point-region relationships, persistence-based probability measures that emphasize topologically significant features, and a sample cost term that incorporates critical point attributes. We evaluate MS-COOT on five datasets spanning 2D simulations, 3D surface meshes, and volumetric data. Our results show that MS-COOT captures region-level structural changes that are not reflected by graph-based distances, while achieving strong performance in downstream tasks such as classification and resolution discrimination.
Editorial analysis
A structured set of objections, weighed in public.
Referee Report
Summary. The manuscript introduces MS-COOT, a co-optimal transport distance for comparing Morse-Smale complexes represented as hypergraphs (critical points as nodes, regions as hyperedges). It jointly computes correspondences between critical points and regions via a hypernetwork encoding, persistence-based probability measures, and sample costs incorporating critical-point attributes. The central claim is that this enables explicit region-to-region matching to identify topological events such as splitting and merging, which graph-based distances miss; evaluation on five datasets (2D simulations, 3D meshes, volumetric data) shows improved capture of region-level changes and strong performance on classification and resolution discrimination tasks.
Significance. If the region correspondences are shown to align with actual topological events, the work would provide a meaningful advance in structural comparison for scientific visualization by moving beyond critical-point graphs to region-level hypergraph matching. The integration of co-optimal transport with persistence weighting and hypernetwork encoding is a technically interesting synthesis. The multi-dataset evaluation spanning dimensions is a positive aspect.
major comments (1)
- [Abstract] Abstract and evaluation description: the claim that MS-COOT 'captures region-level structural changes that are not reflected by graph-based distances' and enables identification of splitting/merging rests on the assumption that the hypergraph co-optimal transport produces correspondences that track these events. However, only downstream classification and resolution discrimination results are reported; no direct quantitative validation (e.g., precision/recall of detected split/merge events against ground-truth region correspondences or comparison to known topological changes) is described. This is load-bearing for the central contribution.
Simulated Author's Rebuttal
We thank the referee for the constructive feedback highlighting the need for stronger evidence supporting the central claims regarding region-level event detection. We respond to the major comment below.
read point-by-point responses
-
Referee: [Abstract] Abstract and evaluation description: the claim that MS-COOT 'captures region-level structural changes that are not reflected by graph-based distances' and enables identification of splitting/merging rests on the assumption that the hypergraph co-optimal transport produces correspondences that track these events. However, only downstream classification and resolution discrimination results are reported; no direct quantitative validation (e.g., precision/recall of detected split/merge events against ground-truth region correspondences or comparison to known topological changes) is described. This is load-bearing for the central contribution.
Authors: We agree that the manuscript's evidence for explicit region-to-region matching tracking split/merge events is indirect, relying on improved downstream task performance across the five datasets and qualitative visualizations of correspondences in the results. No direct quantitative validation (such as precision/recall against ground-truth event labels on controlled data) is presented. This is a substantive point. We will add a new evaluation subsection using synthetic scalar fields with programmatically induced split and merge events, reporting quantitative alignment metrics between computed region correspondences and the known topological changes. This will be incorporated in the revised manuscript. revision: yes
Circularity Check
No circularity: MS-COOT is a constructed distance with independent evaluation
full rationale
The paper defines MS-COOT as a co-optimal transport distance on a hypergraph representation of the Morse-Smale complex, with explicit components (hypernetwork encoding, persistence measures, sample costs) chosen by the authors. No equation or claim reduces a 'prediction' to a fitted parameter by construction, no self-citation chain supports a uniqueness theorem, and no ansatz is smuggled in. Downstream classification and resolution results on five datasets serve as external checks rather than tautological outputs. The central claim that region-level events are captured beyond graph distances is a methodological assertion, not a definitional identity.
Axiom & Free-Parameter Ledger
Reference graph
Works this paper leans on
-
[1]
Adams, T
H. Adams, T. Emerson, M. Kirby, R. Neville, C. Peterson, P. Shipman et al. Persistence images: A stable vector representation of persistent homology. Journal of Machine Learning Research, 18(8):1–35, 2017. 5
2017
-
[2]
J. P. Ahrens, B. Geveci, and C. C. Law. ParaView: An end-user tool for large-data visualization. In C. D. Hansen and C. R. Johnson, eds.,The Visualization Handbook, pp. 717–731. Elsevier, 2005. doi: 10.1016/B978 -012387582-2/50038-1 5
-
[3]
Beketayev, D
K. Beketayev, D. Yeliussizov, D. Morozov, G. H. Weber, and B. Hamann. Measuring the distance between merge trees. InTopological Methods in Data Analysis and Visualization III: Theory, Algorithms, and Applications, Mathematics and Visualization, pp. 151–166. Springer, 2014. doi: 10. 1007/978-3-319-04099-8_10 2
2014
-
[4]
Bremer, G
P.-T. Bremer, G. H. Weber, V . Pascucci, M. Day, and J. Bell. Analyzing and tracking burning structures in lean premixed hydrogen flames.IEEE Transactions on Visualization and Computer Graphics, 16(2):248–260,
-
[5]
doi: 10.1109/TVCG.2009.69 1
-
[6]
A. M. Bronstein, M. M. Bronstein, and R. Kimmel.Numerical Geometry of Non-Rigid Shapes. Springer Science & Business Media, 2008. doi: 10. 1007/978-0-387-73301-2 5, 8
2008
-
[7]
H. Carr, J. Snoeyink, and U. Axen. Computing contour trees in all dimen- sions.Computational Geometry, 24(2):75–94, 2003. doi: 10.1016/S0925 -7721(02)00093-7 2
-
[8]
M. J. Catanzaro, J. M. Curry, B. T. Fasy, J. Lazovskis, G. Malen, H. Riess et al. Moduli spaces of Morse functions for persistence.Journal of Applied and Computational Topology, 4(3):353–385, 2020. doi: 10.1007/s41468 -020-00055-x 4
-
[9]
E. W. Chambers and G. Meng. A stable and theoretically grounded Gromov-Wasserstein distance for Reeb graph comparison using persis- tence images.arXiv preprint arXiv:2507.01171, 2025. doi: 10.48550/ arXiv.2507.01171 5
arXiv 2025
-
[10]
Chowdhury, T
S. Chowdhury, T. Needham, E. Semrad, B. Wang, and Y . Zhou. Hyper- graph co-optimal transport: Metric and categorical properties.Journal of Applied and Computational Topology, 8(5):1171–1230, 2024. doi: 10. 1007/s41468-023-00142-9 2, 4
2024
-
[11]
Stability of Persistence Diagrams
D. Cohen-Steiner, H. Edelsbrunner, and J. Harer. Stability of persistence diagrams.Discrete & Computational Geometry, 37(1):103–120, 2007. doi: 10.1007/s00454-006-1276-5 2
-
[12]
Crane, C
K. Crane, C. Weischedel, and M. Wardetzky. The heat method for distance computation.Communications of the ACM, 60(11):90–99, 2017. doi: 10. 1145/3131280 8
2017
-
[13]
M. Cuturi. Sinkhorn distances: Lightspeed computation of optimal trans- port. In C. J. Burges, L. Bottou, M. Welling, Z. Ghahramani, and K. Q. Weinberger, eds.,Advances in Neural Information Processing Systems, vol. 26, pp. 2292–2300. Curran Associates, Inc., 2013. 5
2013
-
[14]
T. K. Dey and Y . Wang.Computational Topology for Data Analysis. Cambridge University Press, Feb. 2022. doi: 10.1017/9781009099950 2
-
[15]
Edelsbrunner, J
H. Edelsbrunner, J. Harer, V . Natarajan, and V . Pascucci. Morse-Smale complexes for piecewise linear 3-manifolds. InProceedings of the Nine- teenth Annual Symposium on Computational Geometry, pp. 361–370,
-
[16]
doi: 10.1145/777792.777846 2
-
[17]
H. Edelsbrunner, J. Harer, and A. K. Zomorodian. Hierarchical Morse- Smale complexes for piecewise linear 2-manifolds.Discrete & Computa- tional Geometry, 30(1):87–107, 2003. doi: 10.1007/s00454-003-2926-5 1, 2, 4
-
[18]
Edelsbrunner and J
H. Edelsbrunner and J. L. Harer.Computational Topology: An Introduc- tion. American Mathematical Society, 2010. 2
2010
-
[19]
Edelsbrunner, D
H. Edelsbrunner, D. Letscher, and A. Zomorodian. Topological persistence and simplification.Discrete & Computational Geometry, 28(4):511–533,
-
[20]
doi: 10.1007/s00454-002-2885-2 5
-
[21]
W. Feng, J. Huang, T. Ju, and H. Bao. Feature correspondences using Morse-Smale complex.The Visual Computer, 29(1):53–67, 2013. doi: 10. 1007/s00371-012-0674-3 2
2013
-
[22]
Flamary, N
R. Flamary, N. Courty, A. Gramfort, M. Z. Alaya, A. Boisbunon, S. Cham- bon et al. POT: Python optimal transport.Journal of Machine Learning Research, 22(78):1–8, 2021. 5
2021
-
[23]
R. Forman. Morse theory for cell complexes.Advances in Mathematics, 134(1):90–145, 1998. doi: 10.1006/aima.1997.1650 2
-
[24]
Gasparovic, E
E. Gasparovic, E. Munch, S. Oudot, K. Turner, B. Wang, and Y . Wang. Intrinsic interleaving distance for merge trees.La Matematica, 4(1):40–65,
-
[25]
doi: 10.1007/s44007-024-00143-9 2
-
[26]
Geveci and C
B. Geveci and C. Garth. The IEEE SciVis contest. https://cloud. sdsc.edu/v1/AUTH_sciviscontest/2016/README.html, 2016. 9
2016
-
[27]
T. Günther. Computer graphics laboratory, visualization data. https: //cgl.ethz.ch/research/visualization/data.php, 2024. 5, 7
2024
-
[28]
T. Günther, M. Gross, and H. Theisel. Generic objective vortices for flow visualization.ACM Transactions on Graphics, 36(4):141:1–141:11, 2017. doi: 10.1145/3072959.3073684 5, 7
-
[29]
A. Gyulassy, P.-T. Bremer, B. Hamann, and V . Pascucci. A practical approach to Morse-Smale complex computation: Scalability and generality. IEEE Transactions on Visualization and Computer Graphics, 14(6):1619– 1626, 2008. doi: 10.1109/TVCG.2008.110 1
-
[30]
Heine, H
C. Heine, H. Leitte, M. Hlawitschka, F. Iuricich, L. De Floriani, G. Scheuermann et al. A survey of topology-based methods in visu- alization.Computer Graphics Forum, 35(3):643–667, 2016. doi: 10. 1111/cgf.12933 1, 2
2016
-
[31]
F. Lan, B. Gamelin, L. Yan, J. Wang, B. Wang, and H. Guo. Topologi- cal characterization and uncertainty visualization of atmospheric rivers. Computer Graphics Forum, 43(3):e15084, 2024. doi: 10.1111/cgf.15084 1
-
[32]
D. Laney, P.-T. Bremer, A. Mascarenhas, P. Miller, and V . Pascucci. Un- derstanding the structure of the turbulent mixing layer in hydrodynamic instabilities.IEEE Transactions on Visualization and Computer Graphics, 12(5):1053–1060, 2006. doi: 10.1109/TVCG.2006.186 1
-
[33]
S. Le Thanh and T. Weinkauf. A comparative study of different edit distance-based methods for feature tracking using merge trees on time- varying scalar fields. InProceedings of the IEEE Workshop on Topological Data Analysis and Visualization (TopoInVis), pp. 1–10, 2025. doi: 10. 1109/TopoInVis68599.2025.00005 2
arXiv 2025
-
[34]
M. Li, D. Chatterjee, F. Glassmeier, F. Senf, and B. Wang. Tracking low- level cloud systems with topology. InProceedings of the IEEE Workshop on Topological Data Analysis and Visualization (TopoInVis), pp. 89–99,
-
[35]
doi: 10.1109/TopoInVis68599.2025.00013 1, 2
-
[36]
M. Li, S. Palande, L. Yan, and B. Wang. Sketching merge trees for scien- tific visualization. InProceedings of the IEEE Workshop on Topological Data Analysis and Visualization (TopoInVis), pp. 61–71, 2023. doi: 10. 1109/TopoInVis60193.2023.00013 2, 5
arXiv 2023
-
[37]
M. Li, C. Storm, A. Y . Li, T. Needham, and B. Wang. Comparing Morse complexes using optimal transport: An experimental study. In2023 IEEE Visualization and Visual Analytics (VIS), pp. 41–45, 2023. doi: 10.1109/ VIS54172.2023.00017 2, 5, 6
arXiv 2023
-
[38]
M. Li, X. Yan, L. Yan, T. Needham, and B. Wang. Flexible and probabilis- tic topology tracking with partial optimal transport.IEEE Transactions on Visualization and Computer Graphics, 31(10):7951–7969, 2025. doi: 10. 1109/TVCG.2024.3561300 2
arXiv 2025
-
[39]
J. Lukasczyk, G. Aldrich, M. Steptoe, G. Favelier, C. Gueunet, J. Tierny et al. Viscous fingering: A topological visual analytic approach.Applied Mechanics and Materials, 869:9–19, 2017. doi: 10.4028/www.scientific. net/AMM.869.9 1, 5, 9
-
[41]
F. Mémoli. Gromov-Wasserstein distances and the metric approach to object matching.Foundations of Computational Mathematics, 11(4):417– 487, 2011. doi: 10.1007/s10208-011-9093-5 1
-
[42]
G. Meng, R. Zhou, L. Liu, P. Liang, F. Liu, D. Z. Chen et al. Efficient approximation of Earth Mover’s Distance based on nearest neighbor search. IEEE Transactions on Multimedia, 28:227–240, 2025. doi: 10.1109/TMM .2025.3623529 3
work page doi:10.1109/tmm 2025
-
[43]
J. W. Milnor.Morse Theory. Number 51 in Annals of Mathematics Studies. Princeton University Press, Princeton, NJ, 1963. 2
1963
-
[44]
D. Morozov, K. Beketayev, and G. H. Weber. Interleaving distance be- tween merge trees. InProceedings of Topology-Based Methods in Visual- ization (TopoInVis), 2013. doi: 10.1007/978-3-319-44684-4_5 2
-
[45]
Oudot.Persistence Theory: From Quiver Representations to Data Analysis
S. Oudot.Persistence Theory: From Quiver Representations to Data Analysis. American Mathematical Society, Dec. 2015. doi: 10.1090/surv/ 209 2
-
[46]
G. Peyré and M. Cuturi. Computational optimal transport: With appli- cations to data science.Foundations and Trends® in Machine Learning, 11(5-6):355–607, 2019. doi: 10.1561/2200000073 1, 3, 5
-
[47]
Peyré, M
G. Peyré, M. Cuturi, and J. Solomon. Gromov-Wasserstein averaging of kernel and distance matrices. InProceedings of the 33rd International Conference on Machine Learning, vol. 48 ofProceedings of Machine Learning Research, pp. 2664–2672. PMLR, 2016. 3
2016
-
[48]
M. Pont, J. Vidal, J. Delon, and J. Tierny. Wasserstein distances, geodesics and barycenters of merge trees.IEEE Transactions on Visualization and Computer Graphics, 28(1):291–301, 2022. doi: 10.1109/TVCG.2021. 3114839 2
-
[49]
S. Popinet. Gerris: A tree-based adaptive solver for the incompressible Euler equations in complex geometries.Journal of Computational Physics, 190(2):572–600, 2003. doi: 10.1016/S0021-9991(03)00298-5 5, 6
-
[50]
S. Popinet. Free computational fluid dynamics.ClusterWorld, 2(6), 2004. 7
2004
-
[51]
Y . Qin, B. T. Fasy, C. Wenk, and B. Summa. Rapid and precise topological comparison with merge tree neural networks.IEEE Transactions on Visualization and Computer Graphics, 31(1):1322–1332, 2025. doi: 10. 1109/TVCG.2024.3456395 2
arXiv 2025
-
[52]
H. Saikia and T. Weinkauf. Global feature tracking and similarity es- timation in time-dependent scalar fields.Computer Graphics Forum, 36(3):1–11, 2017. doi: 10.1111/cgf.13163 2
-
[53]
M. Soler, M. Plainchault, B. Conche, and J. Tierny. Lifted Wasserstein matcher for fast and robust topology tracking. InProceedings of the 8th IEEE Symposium on Large Data Analysis and Visualization (LDAV), pp. 23–33, 2018. doi: 10.1109/LDA V.2018.8739196 2
work page doi:10.1109/lda 2018
-
[54]
R. Sridharamurthy, T. B. Masood, A. Kamakshidasan, and V . Natarajan. Edit distance between merge trees.IEEE Transactions on Visualization and Computer Graphics, 26(3):1518–1531, 2020. doi: 10.1109/TVCG. 2018.2873612 2, 5, 8
-
[55]
J. Sun, M. Ovsjanikov, and L. J. Guibas. A concise and provably infor- mative multi-scale signature based on heat diffusion.Computer Graphics Forum, 28(5):1383–1392, 2009. doi: 10.1111/j.1467-8659.2009.01515.x 8
-
[56]
D. M. Thomas and V . Natarajan. Detecting symmetry in scalar fields using augmented extremum graphs.IEEE Transactions on Visualization and Computer Graphics, 19(12):2663–2672, 2013. doi: 10.1109/TVCG.2013. 148 2
-
[57]
J. Tierny, G. Favelier, J. A. Levine, C. Gueunet, and M. Michaux. The Topology ToolKit.IEEE Transactions on Visualization and Computer Graphics, 24(1):832–842, 2017. doi: 10.1109/TVCG.2017.2743938 1, 5, 7, 8
-
[58]
Q. H. Tran, H. Janati, N. Courty, R. Flamary, I. Redko, P. Demetci et al. Unbalanced CO-optimal transport. InProceedings of the AAAI Conference on Artificial Intelligence, vol. 37(8), pp. 10006–10016, 2023. doi: 10. 1609/aaai.v37i8.26193 3
2023
-
[59]
P. Tseng. Convergence of a block coordinate descent method for nondiffer- entiable minimization.Journal of Optimization Theory and Applications, 109(3):475–494, June 2001. doi: 10.1023/a:1017501703105 5
-
[60]
Vayer, N
T. Vayer, N. Courty, R. Tavenard, L. Chapel, and R. Flamary. Optimal transport for structured data with application on graphs. InProceedings of the 36th International Conference on Machine Learning, vol. 97 of Proceedings of Machine Learning Research, pp. 6275–6284. PMLR, 2019. 1
2019
-
[61]
Vayer, R
T. Vayer, R. Flamary, R. Tavenard, L. Chapel, and N. Courty. Sliced Gromov-Wasserstein. InAdvances in Neural Information Processing Systems, vol. 32, pp. 5728–5738, 2019. 3
2019
-
[62]
Vayer, I
T. Vayer, I. Redko, R. Flamary, and N. Courty. CO-optimal transport. Advances in Neural Information Processing Systems, 33:17559–17570,
-
[63]
Wetzels, H
F. Wetzels, H. Leitte, and C. Garth. Branch decomposition-independent edit distances for merge trees.Computer Graphics Forum, 41(3):367–378,
-
[64]
doi: 10.1111/cgf.14547 2
-
[65]
Whalen and M
D. Whalen and M. L. Norman. The IEEE SciVis contest.https://vis. computer.org/VisWeek2008/vis/contests.html, 2008. 6
2008
-
[66]
Whalen and M
D. Whalen and M. L. Norman. Ionization front instabilities in primordial H II regions.The Astrophysical Journal, 673(2):664–675, 2008. doi: 10. 1086/524400 5, 6, 7
2008
-
[67]
L. Yan, T. B. Masood, F. Rasheed, I. Hotz, and B. Wang. Geometry- aware merge tree comparisons for time-varying data with interleaving distances.IEEE Transactions on Visualization and Computer Graphics, 29(8):3489–3506, 2023. doi: 10.1109/TVCG.2022.3163349 2, 5
-
[68]
L. Yan, T. B. Masood, R. Sridharamurthy, F. Rasheed, V . Natarajan, I. Hotz et al. Scalar field comparison with topological descriptors: Properties and applications for scientific visualization.Computer Graphics Forum, 40(3):599–633, 2021. doi: 10.1111/cgf.14331 1, 2
discussion (0)
Sign in with ORCID, Apple, or X to comment. Anyone can read and Pith papers without signing in.