CritLens: Visual Analytics for Criteria Discovery in Review-Based Decision Making
Pith reviewed 2026-06-27 18:15 UTC · model grok-4.3
The pith
CritLens turns reviews into initial AHP models via LLMs then supports human refinement of criteria and weights with consistency checks.
A machine-rendered reading of the paper's core claim, the machinery that carries it, and where it could break.
Core claim
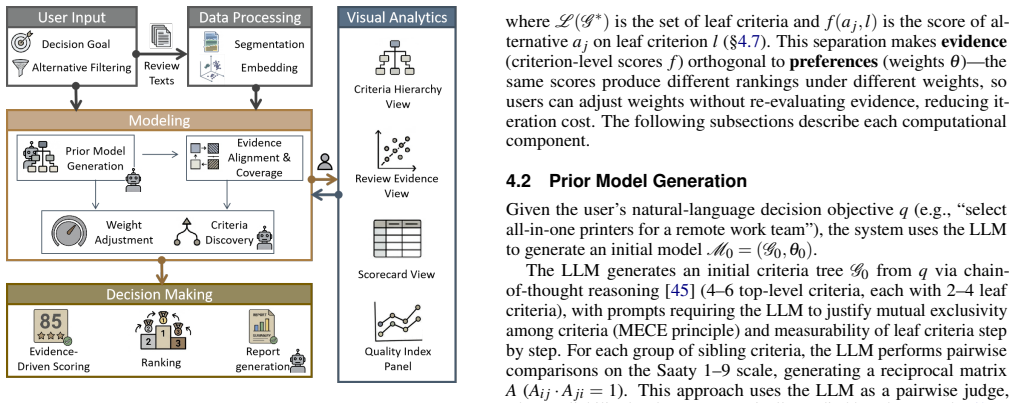
CritLens uses LLMs to build an initial AHP decision model from reviews, then provides coverage gap detection in embedding space, interactive weight adjustment under AHP consistency constraints, and a multi-level scorecard that links every ranking back to the source review text.
What carries the argument
Human-in-the-loop AHP refinement pipeline that starts with LLM-generated models and adds embedding-space coverage detection plus consistency-preserving weight adjustment.
If this is right
- Users gain the ability to identify and add criteria that initial LLM outputs overlook.
- Every final ranking remains traceable to specific sentences in the original reviews.
- Weight changes remain mathematically consistent with AHP rules without manual matrix repair.
- The same workflow can support repeated decisions on the same review set as new preferences emerge.
Where Pith is reading between the lines
- The approach could be tested on review corpora from domains with stronger regulatory constraints, such as medical devices or financial products.
- Embedding-based gap detection might be replaced or augmented by other similarity measures if the initial embedding model introduces its own blind spots.
- Exportable decision reports could serve as audit artifacts when decisions affect multiple stakeholders.
Load-bearing premise
LLM-generated starting models plus embedding-space coverage detection will surface criteria users actually value and the resulting models will stay usable after consistency repair.
What would settle it
A controlled test in which participants state that the criteria surfaced by the system do not reflect their real priorities or that repaired models still produce rankings they reject.
Figures


read the original abstract
We present CritLens, a visual analytics system that helps users build personalized multi-criteria decision models from review text. In everyday decisions -- choosing equipment, hotels, or restaurants -- evaluation criteria are either preset by platforms or generated by LLMs, leaving users unable to discover, adjust, or verify them against the underlying evidence. This is problematic because many preferences are latent: they surface only upon encountering specific reviews, and any fixed framework risks overlooking low-frequency but decisive details. CritLens addresses this gap by using LLMs to transform reviews into an initial AHP decision model, then supporting iterative, human-in-the-loop refinement. Through coverage gap detection in the embedding space, users discover criteria missed by the initial model; through interactive weight adjustment under AHP consistency constraints, they express personal priorities; and through a multi-level scorecard and exportable decision report, they trace every ranking back to the original review text. Two case studies, an eight-participant user study, and a quantitative consistency-repair experiment demonstrate the system's effectiveness.
Editorial analysis
A structured set of objections, weighed in public.
Referee Report
Summary. The paper presents CritLens, a visual analytics system for building personalized multi-criteria decision models from review text. It uses LLMs to initialize an AHP hierarchy, then supports human-in-the-loop refinement via embedding-space coverage gap detection, interactive weight adjustment under consistency constraints, and a multi-level scorecard that traces rankings to source reviews. Effectiveness is asserted through two case studies, an eight-participant user study, and a quantitative consistency-repair experiment.
Significance. If the LLM-to-AHP pipeline and embedding-based gap detection reliably identify user-valued criteria that remain consistent under repair, the work would contribute a concrete workflow for surfacing latent preferences in review-driven decisions, extending visual analytics techniques into interactive decision modeling.
major comments (3)
- [Abstract, §5] Abstract and §5 (User Study): the claim that the eight-participant study and consistency-repair experiment demonstrate effectiveness is unsupported because no quantitative metrics are reported (e.g., precision/recall of LLM-extracted criteria against a gold standard, fraction of coverage-gap suggestions adopted by participants, or pre/post consistency ratios with error bars). Without these, the central mapping from embedding distance to decision relevance cannot be evaluated.
- [§4.2] §4.2 (Coverage Gap Detection): the assumption that embedding-space distance reliably surfaces criteria users actually care about is load-bearing for the discovery claim, yet the section provides no validation against participant-elicited criteria or comparison to a manual baseline; this leaves the human-in-the-loop workflow's effectiveness unverified.
- [§6] §6 (Consistency-Repair Experiment): the experiment is described as quantitative, but the abstract and evaluation summary give no numbers on repair success rate, number of iterations required, or comparison to an unconstrained baseline, undermining the assertion that AHP constraints remain usable after refinement.
minor comments (2)
- [Figures 4-6] Figure captions and axis labels in the case-study figures should explicitly state the embedding model and distance metric used for coverage gaps.
- [§3] The AHP consistency threshold (e.g., CR < 0.1) should be stated once in §3 and reused consistently rather than reintroduced in multiple subsections.
Simulated Author's Rebuttal
We thank the referee for the thoughtful feedback, which highlights opportunities to strengthen the quantitative presentation of our evaluation. We will revise the abstract, §5, and related sections to include explicit metrics from the existing studies where data permits, while clarifying the qualitative focus of the user study. We respond to each major comment below.
read point-by-point responses
-
Referee: [Abstract, §5] Abstract and §5 (User Study): the claim that the eight-participant study and consistency-repair experiment demonstrate effectiveness is unsupported because no quantitative metrics are reported (e.g., precision/recall of LLM-extracted criteria against a gold standard, fraction of coverage-gap suggestions adopted by participants, or pre/post consistency ratios with error bars). Without these, the central mapping from embedding distance to decision relevance cannot be evaluated.
Authors: We agree that the abstract and §5 would benefit from more explicit quantitative summaries. The consistency-repair experiment (§6) contains quantitative results on repair iterations and consistency maintenance, which we will extract and highlight in the abstract and evaluation summary, including pre/post ratios. From the user study we can report the fraction of coverage-gap suggestions adopted by participants. However, precision/recall against a gold standard was not feasible in the study design because decision criteria are inherently subjective and personalized; no such gold standard was collected. The validation instead rests on user adoption, traceability to source reviews, and qualitative feedback. revision: yes
-
Referee: [§4.2] §4.2 (Coverage Gap Detection): the assumption that embedding-space distance reliably surfaces criteria users actually care about is load-bearing for the discovery claim, yet the section provides no validation against participant-elicited criteria or comparison to a manual baseline; this leaves the human-in-the-loop workflow's effectiveness unverified.
Authors: We acknowledge the absence of a formal validation study in §4.2. The gap-detection method is presented as a heuristic motivated by semantic coverage in embedding space, with its practical value shown via the two case studies. In revision we will augment §4.2 and §5 with quantitative adoption rates of the suggested gaps drawn from the eight-participant study logs. A retrospective comparison to a manual baseline or direct matching against participant-elicited criteria can be added if the raw study data supports it; otherwise we will note this as a limitation of the current evaluation. revision: partial
-
Referee: [§6] §6 (Consistency-Repair Experiment): the experiment is described as quantitative, but the abstract and evaluation summary give no numbers on repair success rate, number of iterations required, or comparison to an unconstrained baseline, undermining the assertion that AHP constraints remain usable after refinement.
Authors: The quantitative results (repair success rate, iteration counts) are present in §6. We will revise the abstract and the evaluation overview in §5 to surface these specific figures and, where the experimental data allow, add a comparison against an unconstrained baseline. This change is limited to clearer reporting and does not require new experiments. revision: yes
- Precision/recall evaluation of LLM-extracted criteria against a gold standard, as no gold-standard criteria set was collected in the original study design.
Circularity Check
No circularity: system claims rest on external user studies and experiments, not self-referential derivations
full rationale
The paper describes a visual analytics system (LLM-to-AHP initialization, embedding-based coverage detection, interactive AHP refinement, multi-level scorecard) whose effectiveness is asserted via two case studies, an eight-participant user study, and a quantitative consistency-repair experiment. No equations, fitted parameters, predictions, or uniqueness theorems appear in the provided text. No load-bearing step reduces by construction to its own inputs or to a self-citation chain; the evaluation is presented as separate from the system construction itself. This is the normal non-circular outcome for a systems paper whose central claims are empirically tested rather than mathematically derived from the authors' prior results.
Axiom & Free-Parameter Ledger
Reference graph
Works this paper leans on
-
[1]
Amershi, D
S. Amershi, D. Weld, M. V orvoreanu, A. Fourney, B. Nushi, P. Collisson et al. Guidelines for human-ai interaction. InProceedings of the 2019 chi conference on human factors in computing systems, pp. 1–13, 2019. 9
2019
-
[2]
Antognini and B
D. Antognini and B. Faltings. Hotelrec: a novel very large-scale hotel rec- ommendation dataset. InProceedings of the Twelfth Language Resources and Evaluation Conference, pp. 4917–4923, 2020. 7
2020
-
[3]
Asahi, D
T. Asahi, D. Turo, and B. Shneiderman. Using treemaps to visualize the analytic hierarchy process.Information Systems Research, 6(4):357–375,
-
[4]
Becker and A
J. Becker and A. Becker. Graphical analysis of consistency in the ahp/anp pairwise comparison matrix of criteria or decision alternatives.Procedia Computer Science, 246:4805–4814, 2024. 6
2024
-
[5]
Boggust, B
A. Boggust, B. Carter, and A. Satyanarayan. Embedding comparator: Visualizing differences in global structure and local neighborhoods via small multiples. InProceedings of the 27th international conference on intelligent user interfaces, pp. 746–766, 2022. 5
2022
-
[6]
Borg and P
I. Borg and P. J. Groenen.Modern multidimensional scaling: Theory and applications. Springer, 2005. 6
2005
-
[7]
Bostock, V
M. Bostock, V . Ogievetsky, and J. Heer. D3 data-driven documents.IEEE transactions on visualization and computer graphics, 17(12):2301–2309,
-
[8]
R. J. Campello, D. Moulavi, and J. Sander. Density-based clustering based on hierarchical density estimates. pp. 160–172, 2013. 4
2013
-
[9]
R. J. Campello, D. Moulavi, and J. Sander. Density-based clustering based on hierarchical density estimates. InPacific-Asia conference on knowledge discovery and data mining, pp. 160–172. Springer, 2013. 4
2013
-
[10]
Carenini and J
G. Carenini and J. Loyd. Valuecharts: analyzing linear models expressing preferences and evaluations. InProceedings of the working conference on Advanced visual interfaces, pp. 150–157, 2004. 2
2004
-
[11]
J. Choo, H. Kim, E. Clarkson, Z. Liu, C. Lee, F. Li et al. Visirr: A visual analytics system for information retrieval and recommendation for large- scale document data.ACM Transactions on Knowledge Discovery from Data (TKDD), 12(1):1–20, 2018. 3
2018
-
[12]
Crawford and C
G. Crawford and C. Williams. A note on the analysis of subjective judg- ment matrices.Journal of mathematical psychology, 29(4):387–405, 1985. 4, 5
1985
-
[13]
S. Das, D. Cashman, R. Chang, and A. Endert. Gaggle: Visual analytics using interactive multi-model steering. InGraphics Interface, 2020. 3
2020
-
[14]
Dimara and J
E. Dimara and J. Stasko. A critical reflection on visualization research: Where do decision making tasks hide?IEEE Transactions on Visualization and Computer Graphics, 28(1):1128–1138, 2021. 2
2021
-
[15]
El-Assady, R
M. El-Assady, R. Sevastjanova, F. Sperrle, D. Keim, and C. Collins. Progressive learning of topic modeling parameters: A visual analytics framework.IEEE transactions on visualization and computer graphics, 24(1):382–391, 2017. 3
2017
-
[16]
Endert, P
A. Endert, P. Fiaux, and C. North. Semantic interaction for sensemaking: inferring analytical reasoning for model steering.IEEE Transactions on Visualization and Computer Graphics, 18(12):2879–2888, 2012. 2
2012
-
[17]
Endert, W
A. Endert, W. Ribarsky, C. Turkay, B. W. Wong, I. Nabney, I. D. Blanco et al. The state of the art in integrating machine learning into visual analytics. 36(8):458–486, 2017. 3
2017
-
[18]
K. A. Ericsson and H. A. Simon.Protocol Analysis: Verbal Reports as Data. MIT Press, revised ed., 1993. 8
1993
-
[19]
Gleicher, D
M. Gleicher, D. Albers, R. Walker, I. Jusufi, C. D. Hansen, and J. C. Roberts. Visual comparison for information visualization.Information Visualization, 10(4):289–309, 2011. 2, 6
2011
-
[20]
Gratzl, A
S. Gratzl, A. Lex, N. Gehlenborg, H. Pfister, and M. Streit. Lineup: Visual analysis of multi-attribute rankings.IEEE transactions on visualization and computer graphics, 19(12):2277–2286, 2013. 2, 6
2013
-
[21]
Hutto and E
C. Hutto and E. Gilbert. Vader: A parsimonious rule-based model for sentiment analysis of social media text. InProceedings of the international AAAI conference on web and social media, vol. 8, pp. 216–225, 2014. 4
2014
-
[22]
Ishizaka, S
A. Ishizaka, S. Siraj, and P. Nemery. Which energy mix for the uk (united kingdom)? an evolutive descriptive mapping with the integrated gaia (graphical analysis for interactive aid)–ahp (analytic hierarchy process) visualization tool.Energy, 95:602–611, 2016. 2
2016
-
[23]
H. Lam, E. Bertini, P. Isenberg, C. Plaisant, and S. Carpendale. Empirical studies in information visualization: Seven scenarios.IEEE transactions on visualization and computer graphics, 18(9):1520–1536, 2011. 7
2011
-
[24]
S. Liu, X. Wang, C. Collins, W. Dou, F. Ouyang, M. El-Assady et al. Bridging text visualization and mining: A task-driven survey.IEEE transactions on visualization and computer graphics, 25(7):2482–2504,
-
[25]
X. Lu, J. Li, K. Takeuchi, and H. Kashima. Ahp-powered llm reasoning for multi-criteria evaluation of open-ended responses. InFindings of the Association for Computational Linguistics: EMNLP 2024, pp. 1847–1856,
2024
-
[26]
Mareschal and Y
B. Mareschal and Y . De Smet. Visual promethee: Developments of the promethee & gaia multicriteria decision aid methods. In2009 IEEE International conference on industrial engineering and engineering man- agement, pp. 1646–1649. IEEE, 2009. 2
2009
-
[27]
L. McInnes, J. Healy, and J. Melville. Umap: Uniform manifold ap- proximation and projection for dimension reduction.arXiv preprint arXiv:1802.03426, 2018. 4
Pith/arXiv arXiv 2018
-
[28]
J. Ni, J. Li, and J. McAuley. Justifying recommendations using distantly- labeled reviews and fine-grained aspects. InProceedings of the 2019 conference on empirical methods in natural language processing and the 9th international joint conference on natural language processing (EMNLP-IJCNLP), pp. 188–197, 2019. 7
2019
-
[29]
O’Donovan, B
J. O’Donovan, B. Smyth, B. Gretarsson, S. Bostandjiev, and T. Höllerer. Peerchooser: visual interactive recommendation. InProceedings of the SIGCHI Conference on Human Factors in Computing Systems, pp. 1085– 1088, 2008. 3
2008
-
[30]
Pajer, M
S. Pajer, M. Streit, T. Torsney-Weir, F. Spechtenhauser, T. Möller, and H. Piringer. Weightlifter: Visual weight space exploration for multi- criteria decision making.IEEE transactions on visualization and computer graphics, 23(1):611–620, 2016. 2
2016
-
[31]
D. Park, S. Kim, J. Lee, J. Choo, N. Diakopoulos, and N. Elmqvist. Con- ceptvector: Text visual analytics via interactive lexicon building using word embedding.IEEE transactions on visualization and computer graph- ics, 24(1):361–370, 2017. 3
2017
-
[32]
H. Park, H. Oh, F. Gao, and O. Kwon. Enhancing analytic hierarchy process modelling under uncertainty with fine-tuning llm.Expert Systems, 42(6):e70051, 2025. 2
2025
-
[33]
Pirolli and S
P. Pirolli and S. Card. The sensemaking process and leverage points for analyst technology as identified through cognitive task analysis. In Proceedings of international conference on intelligence analysis, vol. 5, pp. 2–4. McLean, V A, USA, 2005. 2
2005
-
[34]
Sacha, M
D. Sacha, M. Kraus, D. A. Keim, and M. Chen. Vis4ml: An ontology for visual analytics assisted machine learning.IEEE transactions on visualization and computer graphics, 25(1):385–395, 2018. 2
2018
-
[35]
Sacha, M
D. Sacha, M. Sedlmair, L. Zhang, J. A. Lee, J. Peltonen, D. Weiskopf et al. What you see is what you can change: Human-centered machine learning by interactive visualization.Neurocomputing, 268:164–175, 2017. 2
2017
-
[36]
Schmid, L
J. Schmid, L. Cibulski, I. Al Hazwani, and J. Bernard. Rankasco: A visual analytics approach to leverage attribute-based user preferences for item rankings. InEuroVA@ EuroVis, pp. 7–11, 2022. 2
2022
-
[37]
L. Shen, E. Shen, Y . Luo, X. Yang, X. Hu, X. Zhang et al. Towards natural language interfaces for data visualization: A survey.IEEE transactions on visualization and computer graphics, 29(6):3121–3144, 2022. 3
2022
-
[38]
Sparck Jones
K. Sparck Jones. A statistical interpretation of term specificity and its application in retrieval.Journal of documentation, 28(1):11–21, 1972. 4
1972
-
[39]
Y . Sun, X. Zhou, C. Yang, and T. Huang. A visual analytics approach for multi-attribute decision making based on intuitionistic fuzzy ahp and umap.Information Fusion, 96:269–280, 2023. 2
2023
-
[40]
Susmaga, I
R. Susmaga, I. Szcz˛ ech, and D. Brzezinski. Towards explainable topsis: Visual insights into the effects of weights and aggregations on rankings. Applied Soft Computing, 153:111279, 2024. 2
2024
-
[41]
I. Svoboda and D. Lande. Enhancing multi-criteria decision analysis with ai: Integrating analytic hierarchy process and gpt-4 for automated decision support.arXiv preprint arXiv:2402.07404, 2024. 2
arXiv 2024
-
[42]
M. H. Vahidnia. Multi-agent systems of large language models as weight assigners: An approach to collaborative weighting in spatial multi-criteria decision-making.Geomatica, p. 100071, 2025. 2
2025
-
[43]
E. Wall, S. Das, R. Chawla, B. Kalidindi, E. T. Brown, and A. Endert. Podium: Ranking data using mixed-initiative visual analytics.IEEE transactions on visualization and computer graphics, 24(1):288–297, 2017. 2
2017
-
[44]
H. Wang, F. Zhang, and C. Mu. One for all: A general framework of llms-based multi-criteria decision making on human expert level.arXiv preprint arXiv:2502.15778, 2025. 2
arXiv 2025
-
[45]
J. Wei, X. Wang, D. Schuurmans, M. Bosma, F. Xia, E. Chi et al. Chain- of-thought prompting elicits reasoning in large language models. vol. 35, pp. 24824–24837, 2022. 4
2022
-
[46]
H. Wu, S. Zhou, H. Zhang, and W. Chen. Doc2ahp: Inferring structured multi-criteria decision models via semantic trees with llms.arXiv preprint arXiv:2601.16479, 2026. 2
arXiv 2026
-
[47]
Y . Wu, F. Wei, S. Liu, N. Au, W. Cui, H. Zhou et al. Opinionseer: interactive visualization of hotel customer feedback.IEEE transactions on visualization and computer graphics, 16(6):1109–1118, 2010. 3
2010
-
[48]
Zhang, X
W. Zhang, X. Li, Y . Deng, L. Bing, and W. Lam. A survey on aspect-based sentiment analysis: Tasks, methods, and challenges.IEEE Transactions on Knowledge and Data Engineering, 35(11):11019–11038, 2022. 3
2022
-
[49]
Y . Zhao, Y . Zhang, Y . Zhang, X. Zhao, J. Wang, Z. Shao et al. Leva: Using large language models to enhance visual analytics.IEEE transactions on visualization and computer graphics, 31(3):1830–1847, 2024. 3
2024
-
[50]
Zheng, W.-L
L. Zheng, W.-L. Chiang, Y . Sheng, S. Zhuang, Z. Wu, Y . Zhuang et al. Judging llm-as-a-judge with mt-bench and chatbot arena.Advances in neural information processing systems, 36:46595–46623, 2023. 4
2023
discussion (0)
Sign in with ORCID, Apple, or X to comment. Anyone can read and Pith papers without signing in.